An optical glucose sensor could replace painful finger-prick tests for millions of people with diabetes. So why hasn’t someone built one yet? Kate Bechtel explains why advances in physics, not just engineering, are needed to make such a device possible

I am currently in the market for a smartwatch that doubles as a fitness tracker. As I perused the seemingly endless options online, I came across a device that claimed to offer an additional feature: an optical sensor that could give me real-time information about my blood glucose levels. This is an enticing possibility. A continuous, non-invasive measure of blood sugar would help athletes optimize their intake during gruelling workouts. The wellness crowd could use it to improve nutrition. Most importantly, though, it would mean that millions of people with diabetes would no longer have to prick their fingers several times a day to extract a blood droplet for testing.
Unfortunately, the “glucose sensor” in this fitness tracker was useless. In fact, I only found out about the tracker by reading an article lambasting it. But although the article was good at dismissing the manufacturer’s claims, it failed to convey why the device didn’t work – or indeed why the hundreds of millions of dollars poured into optical glucose sensing by government-funded academic labs and deep-pocketed companies have not produced a functional product. Why isn’t this technology available yet? Like flying cars, jetpacks and tricorders, why are we being denied this boon of modern science?
Challenges ahead
The general idea behind non-invasive glucose sensing is to shine light onto skin and collect and analyse the reflected light for information relating to glucose content. This information could be a direct measure of glucose’s optical response (spectrum), or an indirect measure based on the effect glucose has on the tissue’s optical properties. Many researchers have treated this as strictly an engineering challenge: surely, all they need to do is devise a better instrument or apply better algorithms to the data. The lure of helping all those diabetes patients (and turning a massive profit) is strong and it is easy to believe that some promising new technique will bring it within reach. However, in reality, optical glucose sensing is fundamentally a physics challenge, not an engineering challenge, and this is why the vast majority of efforts have failed.
Techniques that directly measure glucose’s spectral signature are widely considered the best at producing reliable and robust measures of glucose content. Spectral signatures that arise from molecular rotational-vibrational motions can be recorded via absorption or Raman spectroscopy. However, glucose is far from the only molecule present in tissue, so measured spectra also include contributions from collagen, lipids, water and other constituents. In such cases, indistinct spectral features or large and varying background levels mean that measurements at multiple wavelengths are required to tease out the relative contributions of each substance.
This type of multiple-equation, multiple-unknown analysis is familiar to most scientists, so you might surmise that we need to know all of the component spectra before we can solve the system of equations for the concentration of the analyte of interest. Unfortunately, we don’t have this information. Certainly, we can make assumptions as to what the largest contributors will be, but a model derived from incomplete component spectra produces errors that are too high for the results to be clinically useful.
To solve this problem, we turn to a class of analysis called multivariate calibration. The fundamental goal of multivariate calibration is to derive a vector b of the same length as a measured multivariate dataset (in this case a spectrum) s, such that the inner product gives the quantity of glucose c. Written in linear algebra form, the expression is: c = sTb.
Here, lower-case boldface type denotes a column vector and the superscript T denotes a transpose. The vector b is often called the “regression vector” or just “b-vector”. Finding b is where the calibration step comes in. What we need is a set of tissue spectra, Scal, that are associated with known “reference” concentrations of glucose, cref. The linear-algebra expression looks nearly identical to the previous one, except cref is a column vector and the calibration spectra Scal is a matrix: cref = ScalTb.
In theory, this expression can be inverted to find b. In practice, a direct inversion is difficult because the system is underdetermined: there are more variables (wavelengths) than equations (calibration spectra). Researchers have tried myriad ways of addressing these challenges and solving for b, including acquiring more calibration spectra and applying novel advanced mathematical techniques. However, these tactics alone will not suffice, because developing an accurate regression vector b requires highly accurate values of cref and Scal. Small variations in either can lead to large errors in b and therefore unacceptably high errors in predictions of glucose concentration. Thus, the challenge of optical glucose sensing boils down to two seemingly simple prerequisites: an accurate knowledge of glucose reference concentrations and an associated set of high-quality calibration spectra.
Accurate reference concentrations
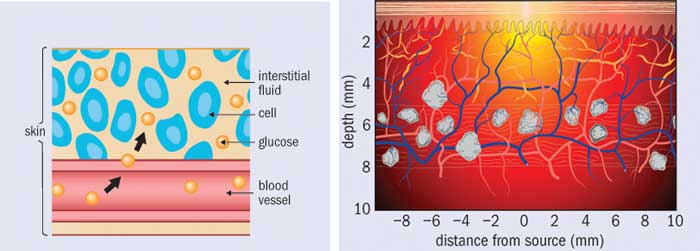
Finding the concentration of glucose in each spectrum of a calibration set might seem like an easy enough task. After all, finger-prick glucose tests are readily available. However, veins and capillaries contain different levels of blood glucose, and the act of squeezing out a small droplet changes the measured glucose concentration. In addition, many over-the-counter blood glucose meters are not accurate enough to act as references; indeed, even clinical laboratory instruments are only just good enough. To complicate things further, the concentration of glucose in blood is only part of the true cref, because the beam of light passes through interstitial fluid and tissue as well as veins and capillaries. Glucose is present in these spaces as well, and in differing concentrations. And when glucose concentration rapidly changes, as it does after someone eats, these differences in glucose concentrations are time dependent.
Out of all these problems, time dependence is perhaps the most challenging. The lag time between interstitial-fluid glucose levels and blood glucose levels is one of the major issues facing non-invasive sensing. Indeed, minimally invasive techniques (such as implantable sensors) struggle with it too, as they must wait for glucose to diffuse into the interstitial space and then to diffuse across the sensor membrane. Some researchers have attempted to characterize these lag times or develop mass transfer models. Others have focused on measuring both interstitial-fluid glucose and blood glucose simultaneously during a calibration study and weighting the contribution of each. However, the relative fraction of blood plasma, interstitial fluid and intracellular fluid is affected by a multitude of factors ranging from diet and water intake to medications and activity levels. How one is supposed to ascertain the actual glucose concentration within the optical volume in a particular patient, at a particular time, is an open question.
Even if the concentrations of glucose were equivalent in all tissue spaces, there is yet another challenge that most researchers have ignored: the measured spectral intensity is proportional to the number of sampled glucose molecules, not to the glucose concentration. For a fixed optical sampling volume, this distinction would be irrelevant. But in fact the optical sampling volume varies with a tissue’s absorption and scattering properties, which depend on a large number of factors. These include exposure to sunlight, temperature and contact pressure at the sampling site, plus properties of the patient such as the amount of melanin in their skin, hydration level, activity level and so on. What this means is that from person to person, from site to site, and even from time to time, the number of sampled glucose molecules can vary even if the glucose concentration were constant.
One could, of course, acquire spectra from more and varied subjects, but that is not going to be enough to account for the error in glucose values used to develop the model. It is possible to correct for sampling volume variations, but to make such a correction one need to know the optical properties of the tissue at the same time as every measurement.
All in the calibration
Let us turn now to our other prerequisite: high-quality calibration spectra. The ideal dataset for spectral calibration would have several properties. Unfortunately, only one subset of them – low noise and minimal drift – can be addressed directly through instrument engineering. The others – a high ratio of glucose signal to background; high spectral “distinctness” (orthogonality); and spectral constituents that do not co-vary with glucose levels – all require a more fundamental approach.
Maximizing glucose signal-to-background and spectral orthogonality is useful because it minimizes contributions to b from other (non-glucose) constituents. This makes the model robust against the influence of other analytes, so it should reduce the error in predicting glucose concentration. To accomplish this, we need to select our spectroscopic technique carefully, and choose an appropriate wavelength region and spectral resolution. However, regardless of the spectroscopic technique employed, other tissue constituents will still contribute strongly to the spectrum. It is therefore of utmost importance for calibration spectra to sample varying levels of all possible tissue constituents, and for these levels not to co-vary with glucose. This means that the way we obtain calibration spectra is crucial if we want a model that is applicable to future measurements, rather than just the set of data it was developed on.
As an example, consider a test in which the subject is asked to fast for 12 hours and is then set up with an instrument to begin collecting spectral data on their arm or finger. After a baseline period, the subject quickly drinks a beverage containing 75 g of glucose (for comparison, a sweet soft drink contains 40 g of sugar). The subject’s blood glucose concentration rises relatively rapidly and then falls over time as their pancreas releases insulin and glucose is removed from the bloodstream. Spectral data are collected at pre-determined time points along with blood samples to obtain reference glucose concentrations.
The procedure described above is a commonly employed test of glucose tolerance. Unfortunately, this study design is rife with challenges, including non-equilibrium glucose concentrations in different types of tissue; time-dependent physiological responses to glucose that cause the spectra of many tissue constituents to co-vary with glucose concentrations; and even time-dependent changes in how the instrument responds. Indeed, glucose tolerance tests are notorious for generating spurious correlations.
The optimal study design is a randomized, multi-level glucose clamp. In this type of test, both glucose and insulin are injected via a syringe pump such that the concentration of glucose within the subject’s bloodstream is maintained at a constant level for long enough that glucose levels reach equilibrium across various tissues. Next, the concentrations of glucose and insulin are changed in order to reach a new equilibration level, either higher or lower than the previous level. To avoid confounding effects, changes in the equilibrium level should not be time-dependent (so, for example, a protocol that repeatedly stepped up the equilibrium level would not be suitable). In this type of study, calibration spectra are acquired during the period of equilibrated glucose values. This minimizes any effects due to spectral properties co-varying with glucose concentrations. It is, however, a very expensive study, and it poses safety concerns that far exceed anything associated with gulping down a very sweet beverage. Hence, animal models should be used until confidence in performance is high enough to warrant testing in humans.
Why so much hype?
The hype around “imminent” optical glucose sensing has often been fed not by patient groups or breathless media reports, but by the researchers themselves. Many seem genuinely unaware of the common traps so many others have fallen into. The most frequent mistake is touting performance based on a “cross-validated” glucose tolerance test, where the term cross-validated means that the model was both generated by and applied to data acquired within the same study session, giving false confidence in the results. Such models will give far worse glucose-prediction results when they are applied to data taken at different times where the physiological and environmental conditions vary. Yet such tantalizing results are often enough to spur investment by people willing to believe. If you enjoy your informative materials with a heavy dose of snark, I recommend The Pursuit of Noninvasive Glucose: Hunting the Deceitful Turkey, in which glucose-sensing researcher John L Smith offers his personal take on why many companies have failed. While his manuscript does not focus on the underlying physics, it contains many of the same insights that appear in this article.
There are, undoubtedly, many instrumentation challenges in developing non-invasive glucose monitors in addition to the physics ones I have outlined here. Among other things, a practical device must be small enough to be convenient for patients and inexpensive enough to be marketable. Because improvements in these areas are easily apparent to investors, companies are often driven to show progress in engineering at the expense of science. Alas, without scientific progress, in which the problem is considered as a whole rather than in part, a smartwatch that can tell me my blood sugar – and diabetics’ hopes of ditching finger-prick tests for good – will remain out of reach.
- Enjoy the rest of the 2017 Physics World Focus on Optics and Photonics in our digital magazine or via the Physics World app for any iOS or Android smartphone or tablet.