Most industrial operations based on electrode reactions involve electrochemical flow reactors. Applications include inorganic/organic electrosynthesis, water electrolysis, environmental remediation and energy storage. The versatile “filter-press” flow reactor offers a controlled reaction environment for processing large volumes of electrolytes. Meanwhile, porous electrodes improve the productivity and efficiency of electrochemical reactors by enhancing surface area and mass transport.
Metal and carbon materials are used as meshes, foams and felts, often coated with catalysts. Under forced flow, the permeability of electrodes becomes important for energy efficiency and balance of plant design. A compromise must be found between the electrode surface area and permeability of porous electrodes.
This presentation highlights the characteristics and benefits of flow cells through the development of Pt/Ti electrodes for flow batteries and the optimization of 3D printed electrodes. After showing the advantages of computed tomography for the study of porous materials, their performance is quantified by the volumetric mass transport coefficient and their permeability to fluids. The importance of tomography parameters to the analysis of surface area and volume is exemplified by reticulated vitreous carbon. The concept of tailorable, 3D-printed electrodes for electrochemical reactors is introduced.
Different geometries are considered. Future progress in 3D printed electrodes for prototype production, model validation and quick availability of specialized devices is discussed.
Dr Luis Fernando Arenas is presently a Humboldt Research Fellow at Technische Universität Clausthal, where he collaborates with Prof. Thomas Turek on the development of organic flow batteries. He is also a visiting academic at the University of Southampton (UOS), UK, and early career representative at the Electrochemical Technology Group of the Society of Chemical Industry, UK.
After completing a BSc in chemistry and MSc degree in chemical technology at the Universidad Autónoma de Coahuila, Mexico, he pursued doctoral studies in electrochemical engineering at UOS. There he focused on zinc-cerium flow batteries under the supervision of Profs Carlos Ponce de León and Frank C Walsh, graduating in 2017. He was a research fellow at UOS, developing PEM fuel cells and electrochemical hydrogen pumps (2017–2019). Arenas has also been a private contractor for the development of new organic- and electrodialysis-based flow batteries for INEEL (Instituto Nacional de Electricidad y Energías Limpias) and consultant for the chlor-alkali industry (2019–2021).
Additional interests include 3D printed electrodes, computed tomography, electrodeposition of noble metals, porous electrodes, and sustainable electrochemical engineering. He became an ECS member in 2014. His research has resulted in 31 peer-reviewed papers, four book chapters, six conference papers, and 17 posters, as well as 40 talks, seven of them by invitation (Google Scholar: 1018 citations, h-index 17). He received the 2019 Schwäbisch Gmünd Prize for Young Scientists for excellence in electrochemical surface technology.
At the British Museum in London, there is a small turquoise-blue jug, originating from Egypt under the reign of the pharaoh Thutmose III. About the size of a salt shaker, the pretty opaque object was probably designed to hold perfumed oil, and is made almost entirely of glass. Yet despite being over 3400 years old, it is not considered one of the earliest examples of human glass making. Historians believe that Mesopotamians were amongst the leading glass-making cultures, fashioning beads and other simple decorative items from glass as long as 4500 years ago.
At first glance, glass does not seem very complicated. It merely refers to a material that has an amorphous rather than a crystalline structure – that is, one in which the atoms or molecules have no long-range order. Almost all common glasses, including those made by the ancient Egyptians and Mesopotamians, involve melting just three ingredients: silica (sand) for the basic structure; along with an alkali oxide (typically soda, or sodium carbonate) to lower the melting temperature; and lastly, calcium oxide (lime) to prevent the mixture from being soluble in water. In fact, the recipe can be simpler still, for we now know that almost any material can turn glassy if it is cooled from its liquid state so fast that its atoms or molecules are arrested before they have a chance to form a well-ordered solid state. But this simple description belies the depth of physics going on under the surface – physics that has been the subject of intense research for well over a century, with some aspects that still baffle us today.
The biggest question physicists want to answer is why a cooling liquid forms a hard glass at all, when no distinct change in structure occurs between the liquid and glass states. One might well expect glass to deform like a very viscous liquid. Indeed, there is a persistent myth that glass in old window panes is warped because it flows slowly over time (see box “The flowing myth”). In truth, glass is hard and brittle, and remains stable over surprisingly long periods. The stability of glass is one of its most attractive characteristics, for example in the storage of nuclear waste.
An ideal glass is where molecules are packed together in the densest possible random arrangement
As seen through the conventional lens of “phase transitions”, put forth by Soviet physicist Lev Landau, there is no sudden shift in the underlying order (at least, no obvious one) when a substance turns into a glass – as would be seen for the emergence of any other genuine state of matter. The main difference between a liquid and a glass is that a liquid can continue to explore different disordered configurations, whereas a glass is, more or less, stuck with one. What makes a cooling liquid select a particular state on transition to glass is a question that goes back over 70 years (see box “In search of the ‘ideal’ glass”).
The fact that, as an amorphous solid, a material can potentially adopt so many different states makes glass incredibly versatile. With small changes in composition or processing, glass properties vary wildly (see box “Two routes to better glass”). This accounts for the huge range in glass applications – from camera lenses to cookware, from windscreens to staircases, and from radiation protection to fibre-optic cables. Smartphones too, as we know them, would not have been possible without the development of thin-but-strong glass, such as “Gorilla Glass” glass, first made by the US manufacturer Corning. Even metals can turn into glass (see box “Mastering the metallic”). Often, the optical and electronic properties of a material do not differ greatly between its glassy and crystalline states. But sometimes they do, as is seen in phase-change materials, which, besides being of importance for data storage, are offering fundamentally new insights into chemical bonding (see box “The future of phase-change materials”).
Perhaps the most surprising question to ask about glass is not what it is, but what it isn’t
However, perhaps the most surprising question to ask about glass is not what it is, but what it isn’t. While we are accustomed to thinking of glass as a hard, transparent substance, a vast swathe of other systems exhibit “glass physics”, from ant colonies to traffic jams (see box “Glass where you least expect it”). Glass physics helps scientists to understand these analogues, which in turn can shed light on glass physics itself.
The flowing myth
(Courtesy: Shutterstock/Zvonimir Atletic)
Look through the stained-glass windows of any medieval church, and you will almost certainly see a distorted view. The effect has long led scientists and non-scientists alike to suspect that, given enough time, glass flows like an exceptionally viscous liquid. But is there any validity to this claim?
The question is not as straightforward as it might at first appear. In truth, no-one can say precisely when a liquid stops being a liquid and starts being a glass. Conventionally, physicists say a liquid has become a glass when the atomic relaxation – the time for an atom or molecule to move a significant portion of its diameter – is longer than 100 seconds. This relaxation rate is about 1010 times slower than in runny honey, and 1014 times slower than in water. But the choice of this threshold is arbitrary: it reflects no distinct change in the fundamental physics.
Even so, a 100 second relaxation is definitive for all human purposes. At this rate, a piece of common soda-lime glass would take aeons to slowly flow and turn into the more energetically favourable crystalline silicon dioxide – otherwise known as quartz. If the stained glass in medieval churches is warped, therefore, it is more likely a result of the original glassmaker’s (by modern standards) poor technique. On the other hand, no-one has performed a thousand-year experiment to check.
In search of the “ideal” glass
Perfect solution? Artist’s impression of an ideal glass. (Courtesy: University of Bristol)
As a liquid cools, it can either harden into a glass, or crystallize. However, the temperature at which a liquid transitions to a glass is not fixed. If a liquid can be cooled so slowly that it does not form a crystal, then the liquid will ultimately transition to a glass at a lower temperature, and form a denser one as a result. The US chemist Walter Kauzmann noted this fact in the late 1940s, and used it to predict the temperature at which a glass would form if a liquid was cooled “in equilibrium” – that is, infinitely slowly. The resultant “ideal glass” would, paradoxically, have the same entropy as a crystal, despite still being amorphous, or disordered. Essentially, an ideal glass is where molecules are packed together in the densest possible random arrangement.
In 2014 physicists including Giorgio Parisi of the Sapienza University of Rome in Italy (who shared the 2021 Nobel Prize for Physics, for his work on “the interplay of disorder and fluctuations in physical systems”) worked out an exact phase diagram for the formation of an ideal glass, in the (mathematically easier) limit of infinite spatial dimensions. Usually, density can be an order parameter to distinguish different states, but in the case of glass and a liquid, the density is roughly the same. Instead, the researchers had to resort to an “overlap” function, which describes the similarity in positions of molecules in different possible amorphous configurations, at the same temperature. They found that when the temperature is less than the Kauzmann temperature, the system is prone to fall into a distinct state with a high overlap: a glass phase.
In three dimensions, or indeed any small finite number of dimensions, the theory of the glass transition is less certain. Some theorists have attempted to describe it thermodynamically, again using the ideal glass concept. Others believe it is a “dynamic” process in which, at progressively lower temperatures, more and more pockets of molecules become arrested, until the entire bulk becomes more glass than not. For a long time, proponents of the two camps have been at loggerheads. In the last couple of years, however, condensed-matter theorist Paddy Royall at ESPCI Paris in France and colleagues claim to have shown how the two approaches can be largely reconciled (J. Chem. Phys.153 090901). “A lot of the resistance [to agreement] we saw 20 years ago has been lost,” he says.
Two routes to a better glass
(Courtesy: Shutterstock/Jorge Isaac MC)
To change the properties of glass, you have two basic options: alter its composition, or alter the way in which it is processed. For instance, using borosilicate rather than the common soda and lime makes glass less prone to stress when heated, which is why borosilicate glass is often used in place of pure soda lime for bakeware. To make the glass even more robust, its exterior surface can be cooled more rapidly than its bulk in a “tempering” process, as in Corning’s original Pyrex.
Another of Corning’s innovations, Gorilla Glass for smartphones, has a more complicated recipe of composition and processing to achieve its strong, scratch-resistant properties. An alkali-aluminosilicate material at heart, it is produced in a sheet mid-air in a special fast-quenched “fusion drawn” process, before being immersed in a molten salt solution for additional chemical strengthening.
Typically, the denser a glass is, the stronger it is. In recent years, researchers have discovered that very dense glass can be created by physical vapour deposition, in which a vaporized material is condensed onto a surface in a vacuum. The process allows molecules to find their most efficient packing one at a time, like a game of Tetris.
Mastering the metallic
(Courtesy: NASA)
In 1960 Pol Duwez, a Belgian condensed-matter physicist working at Caltech in California, US, was rapidly cooling molten metals between a pair of cooled rollers – a technique known as splat quenching – when he discovered that the solidified metals had turned glassy. Since then, metallic glasses have enthralled materials scientists, partly because they are so hard to make and partly because of their unusual properties.
With none of the grain boundaries inherent in ordinary crystalline metals, metallic glasses don’t wear easily which is why NASA has tested them for use in lubricant-free gearboxes, seen here, in its space robots. These glasses also resist the absorption of kinetic energy – for example, a ball made of the material will bounce for a weirdly long time. Metallic glasses also have excellent soft magnetic properties, making them attractive for highly efficient transformers, and can be manufactured in intricate shapes, like plastics.
A lot of metals will only turn glassy (if they do so at all) at breathtakingly fast cooling rates – billions of degrees per second or more. For that reason, researchers usually seek alloys that transition more easily, typically by trial and error. In the past few years, however, Ken Kelton at Washington University in St Louis, US, and colleagues have suggested that it is possible to predict the likely glass transition temperature by measuring the shear viscosity and thermal expansion of a liquid metal (Acta Mater.172 1). Kelton and his team ran a research project on the International Space Station, to study the temperature at which a metal actually becomes glassy, and found that the transition process starts while the metal is still a liquid. By measuring how viscous the liquid is the researchers can now determine whether a glass will form, and what some of its properties will be. Should prediction become commonplace, so too could metallic glasses in commercial devices. In fact, the US tech company Apple has long held a patent for the use of metallic glass on smartphone covers, but has never put it into practice – perhaps due to the difficulty in finding a metallic glass that is economically viable.
The future of phase-change materials
(Courtesy: Wladimir Bulgar/Science Photo Library)
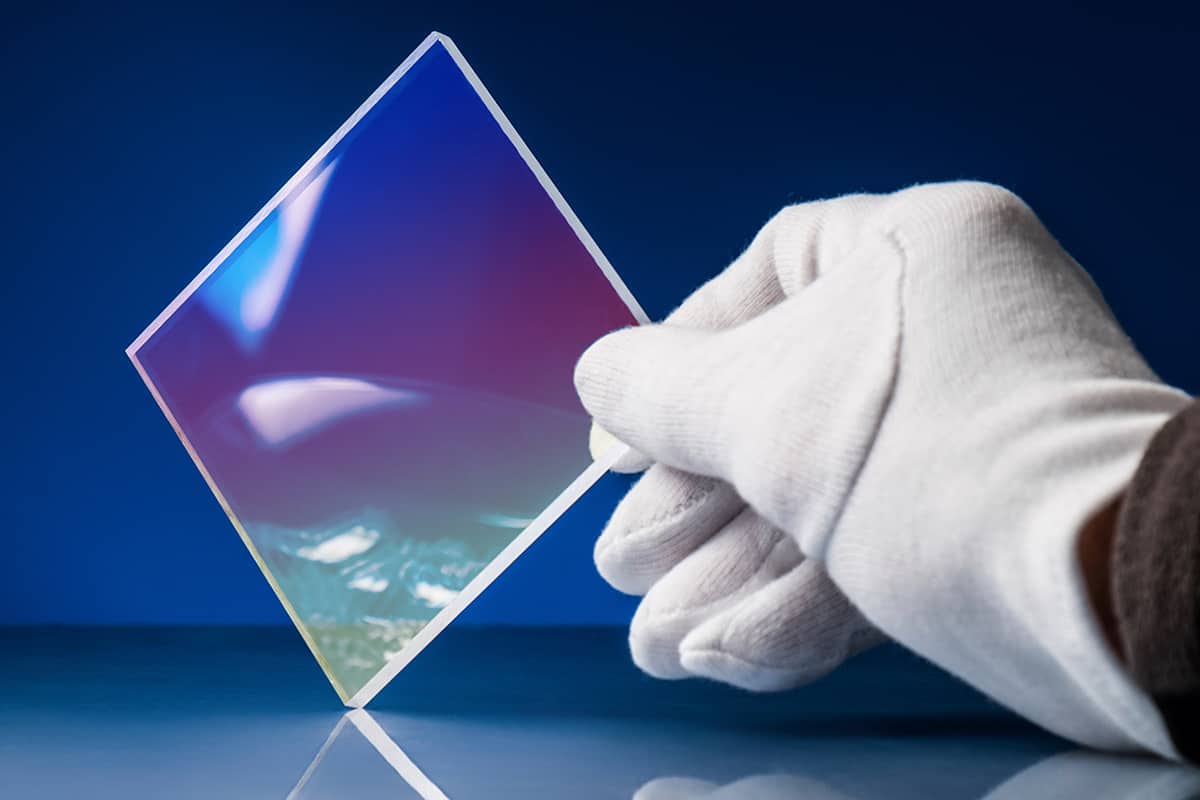
The mechanical properties of glasses and crystals may be different, but usually their optical and electronic properties are fairly similar. To the untrained eye, for instance, normal silicon-dioxide glass looks almost the same as quartz, its crystalline counterpart. But some materials – notably chalcogenides, which include elements from the oxygen group of the periodic table – have optical and electronic properties that are markedly different in their glassy and crystalline states. If these materials also happen to be “bad” glass formers (that is, crystallize when modestly heated) then they serve as so-called phase-change materials.
Most of us will have handled phase-change materials at one time or another: they are the data-storage medium of rewritable DVDs and other optical discs. Insert one of these into a suitable drive, and a laser can switch any bit on the disc between the glassy and crystalline state, representing a binary zero or one. Today, optical discs have been largely supplanted by electronic “flash” memory, which has a greater storage density and no moving parts. Chalcogenide glass is also sometimes used in photonic integrated optical circuits, as pictured here. Phase-change materials have continued to find applications in data storage by the US tech company Intel, and its “Optane” brand of memory, which is fast to access yet non-volatile (it is not erased when the power is switched off). This application remains niche, however.
More profitable, says solid-state theorist Matthias Wuttig at RWTH Aachen University, Germany, is to ask where the phase-change property comes from. Four years ago, he and others proposed a new type of chemical bonding, “metavalent” bonding, to explain its origin. According to Wuttig, metavalent bonding provides some electron delocalization, as in metallic bonding, but with an added electron-sharing character, as in covalent bonding. Unique properties, including phase-changing, result (Adv. Mater.30 1803777). Not everyone in the field wants to add a new type of bonding to the textbooks, but Wuttig believes the proof will be in the pudding. “The question now is whether [metavalent bonding] has predictive power,” he says. “And we are convinced it has.”
Glass where you least expect it
(Courtesy: Karl Gaff/Science Photo Library)
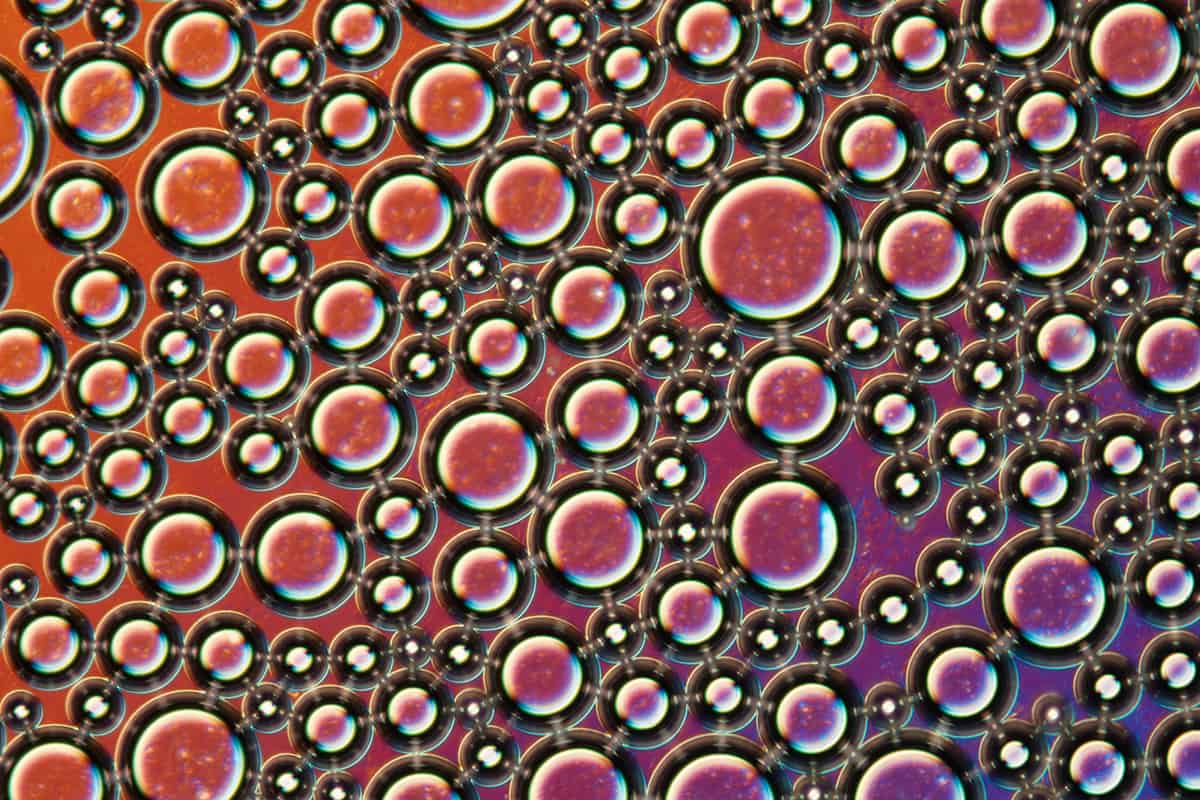
Fans of music festivals will recognize the phenomenon: you are slowly trying to leave a performance along with thousands of other people, when all of a sudden the crowd halts, and you can move no more. Like a molecule in cooling molten silica, your motion is suddenly arrested – you and your fellow festival-goers have turned into a glass. Or a glass analogue, at least.
Other glass analogues include ant colonies, biological cells trapped between slides, and colloids, such as shaving foam (see image above). Colloids in particular, with particles ranging up to microns in size, are convenient systems for testing theories of the glass transition, as their dynamics can actually be seen through a microscope. Even more surprising, though, is the onset of glass behaviour in certain computer algorithms. For instance, if an algorithm is designed to seek out progressively better solutions to a problem with a large number of variables it can become overwhelmed by complexity and grind to a halt before the optimal solution is found. By borrowing statistical methods designed for the fundamental study of glasses, however, such algorithms can be improved, and better solutions found.
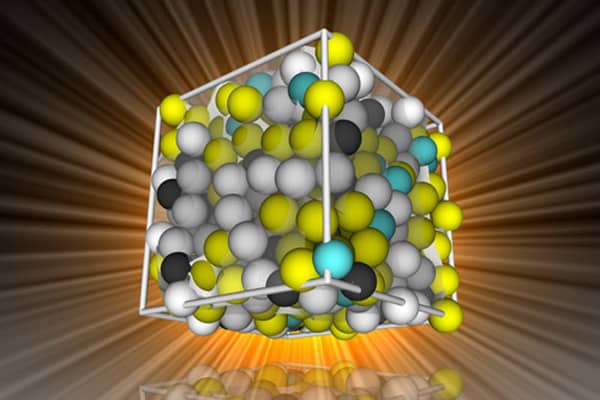
A longstanding explanation for why perovskite materials make such good solar cells has been cast into doubt thanks to new measurements. Previously, physicists ascribed the favourable optoelectronic properties of lead halide perovskites to the behaviour of quasiparticles called polarons within the material’s crystal lattice. Now, however, detailed experiments at Germany’s BESSY II synchrotron revealed that no large polarons are present. The work sheds fresh light on how perovskites can be optimized for real-world applications, including light-emitting diodes, semiconductor lasers and radiation detectors as well as solar cells.
Lead halide perovskites belong to a family of crystalline materials with an ABX3 structure, where A is caesium, methylammonium (MA) or formamidinium (FA); B is lead or tin; and X is chlorine, bromine or iodine. They are promising candidates for thin-film solar cells and other optoelectronic devices because their tuneable bandgaps enable them to absorb light over a broad range of wavelengths in the solar spectrum. Charge carriers (electrons and holes) also diffuse through them over long distances. These excellent properties give perovskite solar cells a power conversion efficiency of more than 18%, placing them on a par with established solar-cell materials such as silicon, gallium arsenide and cadmium telluride.
Researchers are still unsure, however, exactly why charge carriers travel so well in perovskites, especially since perovskites contain far more defects than established solar-cell materials. One hypothesis is that polarons – composite particles made up of an electron surrounded by a cloud of ionic phonons, or lattice vibrations – act as screens, preventing charge carriers from interacting with the defects.
Measuring the kinetic energy of electrons
In the latest work, a team led by solid-state physicist Oliver Rader of the Helmholtz-Zentrum Berlin tested this hypothesis using a technique known as angle-resolved photoemission spectroscopy (ARPES). This technique yields information about a material’s electronic band structure via the kinetic energy E=1/2 mv2 of its electrons, where m is the electron’s mass and v is its velocity. Written in terms of the electron momentum p=mv, this relation corresponds to a parabola E=(p2)/(2m) that can be directly measured in the experiment.
If polarons are indeed present during charge transport, the electrons should move more slowly – and thus their effective mass should be higher – thanks to interactions with the polarons. The larger the electron’s effective mass, the smaller the curvature of the parabola. However, measurements led by team member Maryam Sajedi on samples of crystalline CsPbBr3 failed to identify the expected reduction in the parabola’s curvature. This was a surprise, Rader says, because theory predicted an enhancement of the effective mass by 28% in a related lead halide perovskite, while a competing experiment derived an enhancement of 50% from ARPES data.
Rader attributes the discrepancy to a combination of factors. In principle, he says, the effective mass is simple to measure, but there is an important caveat. “We measure a parabola in the binding energy versus momentum (where the momentum comes directly from the ‘angle’ in ‘angle-resolved photoemission’),” he explains. “However, in a three-dimensional solid, this parabola is a cut of a three-dimensional paraboloid, and if we do not cut it at its apex, we may obtain the wrong – usually higher – effective mass.”
Rader goes on to explain that in ARPES, the momentum in the x- and y-directions is related to the electron emission angle, but the momentum in the z-direction is determined by the energy of the photons used to excite the electrons. In BESSY II’s case, this photon energy comes from synchrotron radiation at wavelengths in the vacuum ultraviolet region of the spectrum. The main part of the experimental work was therefore finding the correct photon energy to determine the effective mass, he says.
A further task was to calculate the expected effective mass without polarons. “We used an advanced method and found that previous calculations predicted a too-small effective mass,” Rader says. “The problem with this previous work was therefore half on the experimental and half on the theoretical side.”
A reliable technique
Rader notes that ARPES has previously detected an enhancement in the effective electron mass due to the presence of polarons in two non-perovskite compounds, TiO2 and SrTiO3. It is therefore a reliable technique for this type of measurement, he says. “Our conclusion is that our experimental method shows that there is no indication for formation of large polarons,” he says. “This result should lead to a reassessment of the theories that predict the presence and an important role of polarons for the properties of lead halide perovskites, most importantly their high efficiency as a solar-cell material.”
As a follow-up, the researchers say they would like to perform similar measurements on a sample of crystalline CsPbBr3 while shining light on it, but they expect this to be “challenging” experimentally. They report their present research in Physical Review Letters.
A weather satellite has helped explain why the red supergiant star Betelgeuse experienced an unprecedented dimming in 2019–2020.
Its findings corroborate earlier studies that concluded the dimming was the consequence of a lower-temperature spot on the star, which reduced the heat going to a nearby gas cloud. This, astronomers believe, allowed the cloud to cool and condense into dust that blocked some of Betelgeuse’s light.
As a variable star, nearby Betelgeuse normally fluctuates in brightness, but in October 2019 it began to grow fainter than had ever been seen before. This led to speculation that it may explode in a supernova. By the end of February 2020, however, Betelgeuse had returned to its normal brightness range, leaving astronomers scratching their heads about what had caused the extreme dip in luminosity.
Rival theories
Two rival theories emerged for the reduction in light. One involves the development of a large convective cell in the star that was cooler (and dimmer) than the rest of Betelgeuse’s surface. The other theory involves the partial obscuration of the star by a dust cloud. However, neither theory on its own could explain the star’s dimming.
Then, in 2021 a team led by Miguel Montargès of the Observatoire de Paris in France proposed, on the basis of observations with the SPHERE (Spectro-Polarimetric High-contrast Exoplanet REsearch) instrument at the Very Large Telescope in Chile, that the dimming involves both a convective cell and obscuring dust.
Now, a group of astronomers and meteorologists, led by Daisuke Taniguchi of the University of Tokyo, has found supporting evidence for this dual explanation – all thanks to the chance observations of a Japanese weather satellite, Himawara-8.
Stellar background
The satellite was launched in 2014 and is in geostationary orbit 35,786 km above the western Pacific. It takes whole-Earth pictures at a multitude of infrared wavelengths, and stars including Betelgeuse are visible in the background.
“Honestly, this project started from Twitter” Taniguchi explains, recalling how he saw a tweet describing how the Moon is visible in the background of images taken by Himawari-8. He and his collaborators then realized that Himawari-8 also had a constant view of Betelgeuse over four years back to 2017.
Himawari-8’s daily observations of Betelgeuse were an advantage over every other telescope, which could only monitor Betelgeuse some of the time. Himawari-8 could even observe the star during the summer, when the star is too close to the Sun for visible wavelength observations. The satellite revealed that the star itself cooled by 140 °C. This was sufficient to reduce irradiative heating to a nearby warm gas cloud, causing the cloud to cool and condense into obscuring dust that is detectable at mid-infrared wavelengths. Taniguchi’s team calculates that both the cooling of the star and the formation of the dust cloud contributed almost equally to what astronomers are referring to as the “Great Dimming”.
“Beautiful result”
“It is really a beautiful result,” says Montargès, who was not involved in this latest research. “The method they use is very original.”
The Himawari-8 observations also suggest that something was happening to the atmospheric structure of Betelgeuse 10 months before the dimming. Water molecules on the star that would normally create absorption lines in the star’s spectrum suddenly changed to form emission lines instead, indicating that something had energized them.
While there is no firm proof for what happened, Taniguchi speculates that “an irregular pulsation might have led to the temperature drop on the star’s surface, and the occurrence of a shockwave that might eject a gas cloud from the star”. This shockwave could have passed through the cloud, instigating the observed transition from absorption to emission of notable spectral lines.
Montargès agrees that this seems to be a reasonable idea. Indeed, he argues that convection cells bubbling up on the star’s surface, called the photosphere, are the only plausible explanation.
Photospheric activity
“The gas cloud can only originate from the photosphere and the only photospheric activity we detect comes from the convection, the powerful motion of the gas,” he says.
It’s too early to tell whether this is normal behaviour for a red supergiant star like Betelgeuse. Montargès alludes to another possible dimming event in the 1940s, but otherwise in over two centuries of monitoring Betelgeuse and other red supergiants, nothing like the Great Dimming has been seen. It may be that such events have happened on other red supergiants, only for us to have missed them because of their relatively short duration.
“Before concluding that it is a common behaviour for this class of stars, we need to observe it elsewhere,” says Montargès.
Meanwhile, Taniguchi and colleagues are making full use of Himawari-8 to monitor other stars. They have initiated new projects to make a catalogue of the variability of aged stars in infrared light, as well as searching for new classes of object that are variable at infrared wavelengths.
“All these projects use the same satellite, Himawari-8,” says Taniguchi. “I hope that some other scientists will also start their own projects using Himawari-8 or other weather satellites.”
A new single-mode optical fibre made from sapphire rather than the usual silica can withstand temperatures of over 2000 °C as well as high levels of radiation. Although the fibre’s length is currently limited to 1 cm, its developers at the University of Oxford, UK, say that the technique they used to construct it could be extended by up to several metres, making it useful for remote sensing in ultra-extreme environments.
Optical fibres usually consist of a central core surrounded by cladding. Because the core has a slightly higher refractive index than the cladding, light travels down the fibre by undergoing near-total internal reflection at the core/cladding interface. In fibres with relatively large cores (around 50 µm), the extra space allows light to follow paths of varying length, meaning that many different wavelengths of light get reflected at once. Such fibres are termed “multimode”, and each mode has a different effective refractive index. In contrast, fibres with narrower cores (around 9 µm) can support a single mode, such that the light follows just one path.
From very multimoded to single-mode sapphire fibre
Optical fibres made from sapphire differ from this design in several ways, explains team member Mohan Wang. Rather than having a core and cladding, sapphire fibres are made from a solid single crystal of the material, and light is guided by the interface between the sapphire and the surrounding air. The relatively large (between 60 and 425 µm) diameter of the crystal means that sapphire fibres are highly multimodal: a typical 75 µm fibre may contain 20,000 modes. Light in each mode propagates at a different speed, resulting in the distortion of optical signals.
In the new work, Wang and colleagues found a way to make a single-mode sapphire fibre by writing a channel along the length of a 425 µm-diameter fibre such that the light is contained within a tiny cross-section less than 10 µm in diameter. The researchers did this by choosing a point within the sapphire fibre cross-section to be the “core”. They then exposed the sapphire around this region to extremely short (170 femtoseconds) pulses of laser light, effectively forming a cladding by lowering the local refractive index.
“We achieved this by writing a series of stripes along the length of the fibre, starting at the bottom and working our way around the core to the top,” Wang explains. A significant challenge, he continues, is that the sapphire has a high refractive index and is not flat. Instead, its cross-section resembles a rounded hexagon, giving rise to significant distortion when the researchers attempted to focus light inside the fibre and forcing them to use adaptive optics to correct for it.
A Bragg-grating-based sensor
The researchers used this laser-writing technique to create a so-called Bragg grating, which is a periodic variation of the refractive index along the length of the fibre. “If the fibre is single-mode, the fibre Bragg grating reflects light at a specific (Bragg) wavelength according to the pitch of the grating and the effective refractive index,” Wang explains. “Changes in temperature and strain affect these properties and can be measured from the wavelength of the reflected light, allowing the fibre to be used a sensor. Previous attempts at Bragg gratings in multimode sapphire fibre had a multiple reflection peaks – one for each mode, resulting in measurement uncertainty.”
The Oxford team is now working on making its sapphire fibres longer – a few centimetres to begin with, but ultimately up to several metres, study leader Julian Fells says. Longer fibres could contain multiple sensors and might be used to measure temperatures throughout the volume of a jet engine, where temperatures easily exceed the 1000 °C maximum for silica fibres. Fells suggests that data from such measurements could help reduce nitrogen dioxide emissions by altering engine conditions mid-flight or improving overall efficiency. “We are also exploring opportunities to instrument an aero-engine test-rig with our partners Rolls-Royce and Cranfield University,” he says.
Other possible applications for the fibre include sensing in environments with high levels of radiation. “Since sapphire is robust to radiation, it has an advantage over conventional silica fibres, which are damaged by radiation,” Fells tells Physics World. In the future, the team plans to supply devices to MDA Space and Robotics and to the UK Atomic Energy Authority for evaluation by its Remote Applications in Challenging Environments (RACE) division. “Sapphire is also transparent over a much wider wavelength than silica, out to the mid infrared, so it is of interest for gas sensing using spectroscopy,” Fells concludes.
The fibre’s construction is described in Optics Express.
A sensing technique that can precisely detect the release and diffusion of dopamine from individual neuron release sites has been developed by researchers in Germany. Led by Sebastian Kruss at Ruhr University Bochum, the team created their sensor using specially-modified carbon nanotubes that fluoresce at specific near-infrared wavelengths on contact with dopamine.
Dopamine is a signalling molecule exchanged by neurons in the brain. It controls a wide range of processes in the brain including our sense of reward and motivation. Scientists know that issues with dopamine exchange are tied to multiple brain disorders, including Parkinson’s disease, schizophrenia and addiction. Yet so far, a clear understanding of how these conditions arise has been limited by the low spatial and temporal resolutions of existing techniques for imaging dopamine concentrations in biological tissues.
To tackle the challenge, Kruss’ team has fabricated a new type of nanosensor that uses modified, single-walled carbon nanotubes. When illuminated with visible light, these structures undergo fluorescence by emitting photons with near-infrared (NIR) wavelengths. This makes them ideal for imaging, because NIR light can propagate relativity long distances in biological tissues – providing sharper images than visible light.
Nucleic acid molecules
The researchers modified the nanotubes by binding them to a specific set of nucleic acid molecules, which themselves bind to dopamine. This caused the nanotubes to fluoresce at specific NIR wavelengths when they interacted with dopamine, with a light intensity that is proportional to dopamine concentration.
To create a 2D nanosensor, Kruss and colleagues painted a concentrated solution of the nanotubes onto a glass coverslip. This thin layer was then used to coat a culture of neuron cells. When these neurons were stimulated to produce dopamine, the nanotube paint immediately fluoresced at the distinctive NIR wavelengths.
The spatial and temporal resolution of the sensor is good enough to detect both discrete release events from specific sites, and the diffusion of dopamine between cells. By applying a machine-learning-based analysis tool, the researchers could visualize up to 100 release sites simultaneously, and discriminate between sites by the amount of dopamine they released.
Kruss’ team hope that their technique will enable neurologists to better understand the molecular- and cellular-scale mechanisms that drive the release of dopamine; and subsequently, to identify the factors which inhibit this signalling. This could eventually lead to new progress towards treatments for conditions including Parkinson’s disease and drug addiction. In addition, by binding different sets of molecules to carbon nanotube sensors, the technique could be extended to detect other types of signalling molecule.
Physicists in the UK have created a camera that can image the complex tangles of vortices that form inside a helium-3 superfluid. Developed by Theo Noble and colleagues at Lancaster University, the approach could help researchers to better understand the behaviour of quantum fluids.
When cooled to temperatures just above absolute zero, liquid helium-3 becomes a superfluid, which below a certain critical velocity, can flow without any loss of kinetic energy. The effect arises because at very low temperatures atoms of helium-3 – which are fermions – can form Cooper pairs. These pairs are bosons, which means that helium-3 can become a superfluid.
Physicists are fascinated by the dynamics of superfluid helium-3 at high flow velocities. Here, thermal fluctuations break Cooper pairs to create quasiparticles that propagate through the superfluid. These structures cannot exist within a certain energy range, which can prevent them from entering certain regions of a superfluid. As quasiparticles approach these regions, they will trap a partner to form a Cooper pair, leaving behind a quasiparticle called a hole, which propagates in the opposite direction – a process called “Andreev reflection”.
Tangled vortices
This process can be triggered by the quantized vortices that form around obstacles to the flow of a superfluid. In liquid helium-3, these vortices can exist as a disorderly tangle of strings just tens of nanometres thick and can shift the forbidden range of quasiparticles in the fluid by a certain amount – which varies with distance from the vortex.
A variety of techniques have been used to probe these structures: including measuring the magnetic fields surrounding helium-3 nuclei and passing sound waves through the fluid. Yet so far, physicists have struggled to image these tangles directly without the use of invasive techniques, such as artificial tracer particles.
The Lancaster team used a partially closed box within their superfluid to create quasiparticles using a vibrating curved wire. Some of the quasiparticles could move into the rest of the superfluid via a small hole in the box – thus creating a beam of quasiparticles. Upon leaving the box, the beam encounters another vibrating wire that creates a “turbulent tangle” of vortices. Quasiparticles that pass through the tangle are then detected using a 5×5 array of quartz tuning fork resonators.
New discoveries
This allowed the team to produce a series of pixelated images revealing the shadows of vortices, where the quasiparticle beam had been blocked by Andreev reflection. Using this method, the team has already made new discoveries about the properties of superfluid helium-3. For example, they observed many more vortices appeared on the inner edge of the curved wire than its outer edge, despite flow velocities being roughly the same on each side.
The team intends to study these effects in more detail through further improvements to the set-up: including larger pixel arrays, and higher operation speeds to enable video recordings. If achieved, these improvements could allow researchers to mimic a wide variety of complex, large-scale flow patterns in quantum fluids: including sudden accelerations in the rotations of neutron stars; and the break-up of Cooper pairs by incoming cosmic rays, or even by as-yet undiscovered dark matter particles.
Stereotactic radioablation is a novel, non-invasive treatment option for cardiac arrhythmias. The heart is dose sensitive and its motion contributes significantly to dose delivery uncertainties.
To increase dose conformality and minimize toxicity, we explore the parallel application of respiratory MLC-tracking and cardiac-gated radiation delivery for cardiorespiratory motion mitigation for the first time, using the Modus QA QUASAR MRI4D. Cardiac and respiratory motion management decreases dose uncertainties significantly and might therefore be highly beneficial for treating cardiac arrhythmia patients in the future.
Osman Akdag is a PhD candidate at the University Medical Center Utrecht (UMCU) in the Netherlands under supervision of Dr Martin Fast. He obtained his master’s degree in medical engineering at the University of Technology Eindhoven in 2019. During his master’s, Osman worked on diffusion-weighted cardiac MRI in a four-months internship at the King’s College Cardiac MRI group. He has written his master’s thesis on abdominal 4D-MRI at the UMCU. In his current research, Osman is focused on prototyping MRI-guided cardiac radioablation workflows on a hybrid MRI and radiotherapy treatment device. His research is published in renowned, peer-reviewed international journals. He also presented cardiac MRI and dosimetry-focused work at recent AAPM, ISMRM and ESTRO meetings.
For a few early-career scientists, the future is a preordained pathway written in the stars; for others, it seems, the future is just as likely to be found on the back of a grocery-store receipt. Take Christine Tremblay who, in the early 1980s, had just completed the first year of an undergraduate degree in engineering physics at Université Laval, Quebec City, and was all set for a summer job at the Canadian Post Office. It was then that she bumped into one of her lecturers in the local supermarket.
Upon learning of her plans, Tremblay’s would-be careers counsellor scribbled down an alternative option on the back of his till receipt, providing contact details for two professors likely to be in need of a research assistant over the summer break. Curiosity piqued, Tremblay went to the physics department, knocked on some doors and landed a three-month placement within Laval’s Centre for Optics, Photonics and Lasers (COPL).
While there, she worked on a prototype laser-based fingerprint detection set-up and rebuilt a rather sorry-looking – in fact, totally dismantled – CO2 laser system. “I loved that summer – the atmosphere in the department was amazing,” Tremblay recalls. “I was very much the new kid in town, working alongside all these talented graduate students, but I have a can-do mindset and was eager to learn from all of them.”
Tremblay never looked back. Her engineering physics degree was followed by a Master’s degree in integrated optics and a PhD in optoelectronics, after which she spent 14 years accumulating domain knowledge and applied know-how at Canada’s leading fibre-optic technology companies. These included INO (a private research centre that focuses on optics and photonics innovation for industry partners); Nortel (at the time, one of the telecoms industry’s biggest network equipment makers); EXFO (a specialist provider of fibre-optic test and measurement gear); and Roctest (which develops fibre-optic sensors and measurement kit for geotechnical applications).
Building a hierarchy of knowledge
That granular understanding rooted in the building blocks of the fibre-optic communications network – specifically, the laser transmitters, optical amplifiers, switches, receivers and fibres that underpin high-bandwidth data transmission – has informed and enriched Tremblay’s subsequent academic research career at École de technologie supérieure (ÉTS) in Montreal over the past 18 years. “It helps you to design real-world solutions for the network when you know what the optical components can deliver and what their limitations are in terms of performance and optimization,” she explains.
For Tremblay, one big attraction of the optical communications sector is the opportunity it gives her to work with people across a wide range of disciplines, such as electrical engineers, physicists, mathematicians, component integrators, computer scientists and more recently, machine-learning specialists. There’s also lots of collaboration between academia and industry, where the focus is very much on working with equipment makers’ R&D teams (as well as marketing and business development) to translate and commercialize research breakthroughs into network-ready technologies and applications.
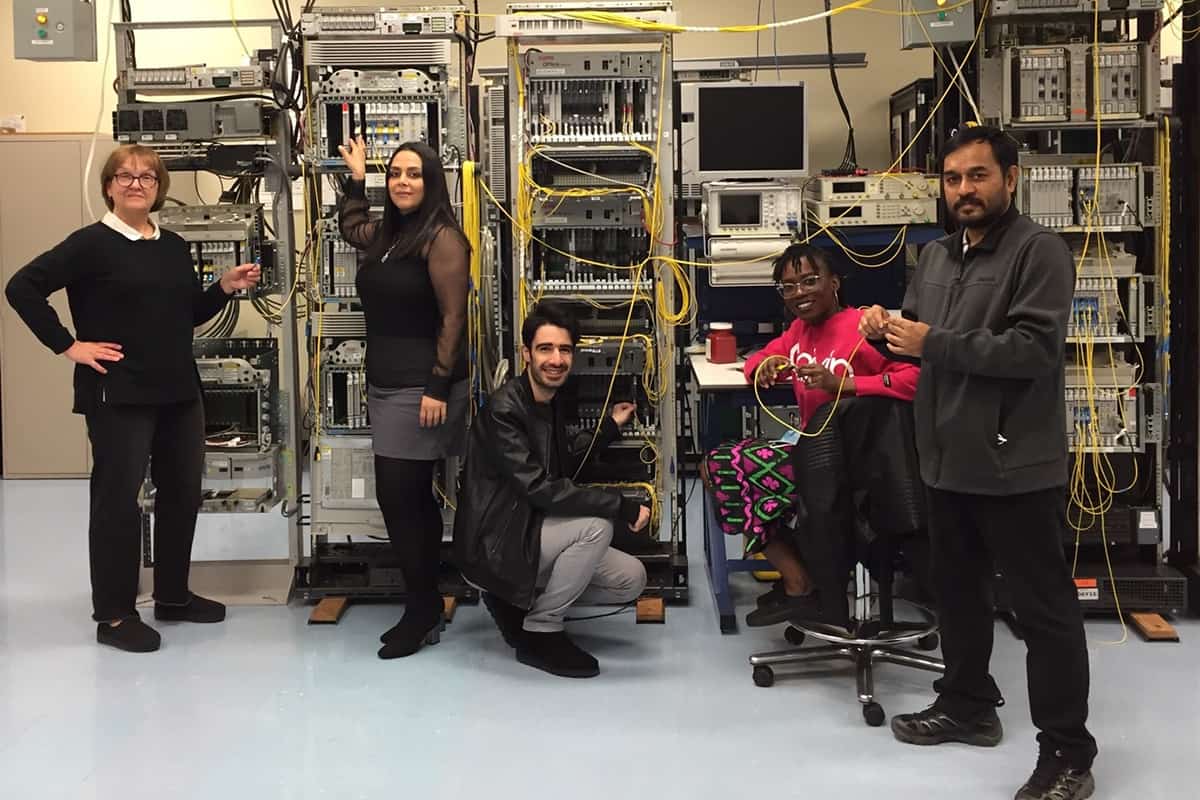
Multidisciplinary by nature Christine Tremblay (left) and members of the ÉTS Network Technology Lab. (Courtesy: ÉTS)
“My R&D pathway has allowed me to work across a broad and still-evolving physics and engineering canvas,” Tremblay says. “It helps, of course, that I’m inherently curious – someone who likes to push out in new directions to pursue fresh lines of enquiry. All sorts of opportunities follow when you’re open-minded and willing to connect and collaborate with partners working on interesting problems of their own.”
That R&D focus and diversity of approach is mirrored in Tremblay’s ÉTS research group, which she says is a “multidisciplinary melting pot” comprising two postdocs, three PhD students and another 10 team members (mainly MSc/MEng students and research assistants). Significantly, given the long-term gender imbalance in telecoms engineering disciplines, Tremblay’s group has included more women than men over the last five years – and she confesses to being “very proud to have such a talented mix of applied scientists and engineers working in my team”.
Training the next generation
Beyond her broad-scope research interests, Tremblay is also passionate about professional development and education. In particular, she has done much to train the next generation of communications engineers to support the installation, testing and maintenance of high-speed optical networks – chiefly through a long-standing association with the Optical Society’s flagship Optical Fiber Communication (OFC) annual conference.
Working alongside industry colleagues, Tremblay was academic co-instructor for two well-received continuing education courses at OFC: one on optical-fibre characterization and testing in long-haul and metro-area networks; the other on polarization-related measurements in fibre networks. “These were hands-on, practical workshops targeting a mixed audience of research students, early-career engineers and senior telecoms and photonics people from all over the world,” she explains.
Crucially, all of the optical kit used by the attendees was loaned free of charge by various test and measurement companies, with Tremblay having to “wheel and deal” in advance to call in favours from the likes of her former employer EXFO. Given the interactive nature of the training, Tremblay reckons she learnt as much from the delegates as they likely took from the instructors, making some long-lasting contacts too. “I was very glad and proud to contribute to the OFC professional development programme,” she notes. “Although a non-trivial overhead on top of my ÉTS research activities, it was great fun and incredibly rewarding in equal measure.”
These days, Tremblay is a full professor in the ÉTS electrical engineering department as well as the founding researcher and head of the institute’s Network Technology Lab. This advanced fibre-optic layer testbed, developed with the telecoms equipment maker Ciena over the past decade and more, comprises 2500 km of various fibre types linking an array of high-speed optical transmission systems. Alongside Ciena, her current R&D partners are Chalmers University of Technology in Sweden, the French engineering school Télécom SudParis and Canadian telecoms service provider TELUS.
As such, Tremblay’s research programme spans several broad areas of interest. It covers, for example, “smart optical networks”, in which machine learning is used to forecast the quality of transmission in optical fibre systems, as well as the performance monitoring of installed networks (including predictive methods for degradation and failure across multiple fibre plant deployments to inform engineering upgrades). Tremblay’s group also works on “filterless” optical network architectures (based on low-cost passive optical-routing technologies) as well as photonic device modelling and polarization measurements for sensing applications in telecoms networks.
Another emerging opportunity is quantum communications. “Quantum is largely aspirational for us just now, though we are already talking to relevant experts in Canada,” says Tremblay. If funding is forthcoming, however, her team plans to optimize the performance of secure, long-distance quantum key distribution across a classical optical network using engineered quantum-entangled photonic technologies.
Research pathways aside, Tremblay’s key message for today’s early-career physicists is the same as it was 40 years ago, back in that Quebec City grocery store. “Follow your instinct and be curious,” she concludes. “It’s equally important to be alert so that when new opportunities arise, you can take advantage of them.”
• AI autocontouring of organs in preclinical radiation studies for cancer
Frank Verhaegen
An overview will be given of the role of artificial intelligence (AI) in automatic delineation (contouring) of organs in preclinical cancer research models. It will be shown how AI can increase efficiency in preclinical research.
Speaker: Frank Verhaegen is head of radiotherapy physics research at Maastro Clinic, and also professor at the University of Maastricht, both located in the Netherlands. He is also a co-founder of the company SmART Scientific Solutions BV, which develops research software for preclinical cancer research. His interests are radiotherapy physics, imaging, preclinical research and Monte Carlo simulations.
• Deep learning prostate segmentation in three-dimensional ultrasound
Nathan Orlando
This presentation will explore the development and validation of a generalisable deep-learning-based automatic prostate segmentation algorithm for three-dimensional ultrasound images. Practical considerations for implementing deep-learning segmentation tools will be explored including the effect of dataset size, image quality, and image type on segmentation performance.
Speaker: Nathan Orlando is a fifth-year PhD candidate in the Department of Medical Biophysics at Western University and Robarts Research Institute in London, Ontario, Canada, supervised by Dr Aaron Fenster and Dr Douglas Hoover. His research has focused on improving ultrasound-guided prostate brachytherapy through both software- and hardware-based solutions. Prior to starting at Western University, Nathan completed a BSc (Hons) in physics at the University of Alberta in Edmonton, Alberta, Canada.
• Prospectively-validated deep learning model for segmenting swallowing and chewing structures in CT
Aditi Iyer
In this presentation, we present a deep learning-based method to automatically delineate the swallowing and chewing structures in CT. Its potential for use in radiotherapy treatment planning to improve efficiency is demonstrated through prospective validation.
Speaker: Aditi Iyer, is a senior scientific application developer in the Department of Medical Physics at Memorial Sloan Kettering Cancer Center, where she has served as a key contributor to the open-source Computational Environment for Radiological Research (CERR) software for six years. Her research interests include the application of machine learning and radiomics for image analysis and predictive modeling. Prior to joining MSKCC, she received her master’s degree from Purdue University, Indiana, where she worked on the estimation of multi-subject functional connectivity maps from fMRI data.
Speakers relationship with IOP Publishing
They are accepted authors of the focus collection.
Webinar chairs Georgios Papanastasiou and Guang Yang, guest editors of the joint Physics in Medicine & Biology and Machine Learning: Science and Technology focus issue, Focus on Machine Learning Models in Medical Imaging.