Ryan Flanagan, Vincenzo Nicosia and Lucas Lacasa from Queen Mary University of London have developed a new way of analysing “horizontal visibility graphs” – a time series of data points that can be used, for example, in medicine to distinguish patients who have certain diseases from those who do not.
The research is reported in full in Journal of Physics A, published by IOP Publishing – which also publishes Physics World.
What was your motivation for performing this research?
By means of the so-called horizontal visibility algorithm, a sequence of data points (a time series) can be transformed into a horizontal visibility graph (HVG). After doing that, tools of network science and graph theory can be used to describe the time series combinatorically, opening new avenues for characterization.
A typical application of this method often tackled in the literature is that of classifying and distinguishing patients with a certain pathology from healthy controls, by using the properties of HVGs as features for automatic diagnosis. But applications range from physiology or neuroscience, to physics (characterizing turbulence, for example), finance, biology and more.
While we have a theoretical understanding of why certain properties of these graphs provide important information on the time series structure, for some other metrics, such a link is more difficult to grasp. Among other properties, practitioners have used the spectral (i.e. eigenvalue) properties of HVGs as features to distinguish and characterize the complexity of time series. However, to date, the amount of theoretical work on how these spectral properties behave is very scarce. This was the main motivation for this work.
What approach did you take?
We explored the spectral (eigenvalues) properties of HVGs from a theoretical angle. We constructed HVGs from different types of time series, generated by the so-called Feigenbaum scenario (periodic series with different periods, and chaotic series with different Lyapunov exponents). We then derived rigorous, analytical and numerical results on the spectral properties of these graphs, to understand how these relate to the time series structure.
We also wanted to understand to what extent the approach often employed in the literature (use of the maximal eigenvalue of the adjacency matrix as a quantifier of the time series complexity) was sensible and well-defined.
What was the most interesting finding?
The most striking result was that, at odds with what was assumed before, the maximal eigenvalue of the adjacency matrix is in general not a proper quantifier of the time series complexity. Additionally, we found that other spectral features of the HVG could do a better job.
Besides this, this paper is the first one that attempts to make a rigorous analysis of the spectral properties of these kind of graphs. It opens up a line of research on the spectral properties of this family of graphs.
Why is this research significant?
We hope that this research will catch the interest of different groups of scientists. From an applied point of view, our results show that spectral properties of HVGs should be used cautiously if the aim is to characterize the complexity of a time series. From a theoretical point of view, we hope that spectral graph theorists and algebraic combinatorialists will be interested in a range of open problems that we flag. While HVGs have been mostly used in applications, their mathematical foundation is mostly in its infancy, and there is room for a lot of interesting work to be done.
What do you plan to do next?
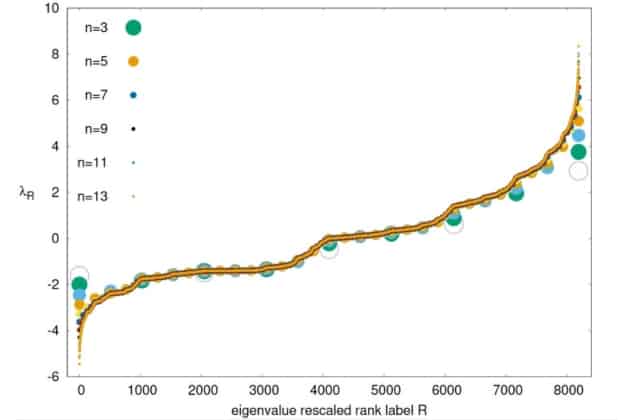
There are several open problems. From a mathematical point of view, we aim to fully analytically solve the spectrum of HVGs (at least in the context of current analysis). In the paper, we propose several possible avenues for doing that. Particularly intriguing is to understand the apparent fractal shape of this spectrum (as seen in the image above).
The full results of the study are reported in Journal of Physics A: Mathematical and Theoretical.


