You may have noticed that not everyone agrees with the outcome of the 2020 US Presidential election. But looking beyond the ALL CAPS TWEETS of Donald Trump, one claim circulating on social media is that some of Joe Biden’s votes look suspicious because they don’t adhere to “Benford’s law “.
So do the claims stack up? In short, no – but the reasons are interesting.
Named after the US physicist Frank Benford, the law relates to frequencies of first digits in large sets of numbers. Benford described the law in a 1938 paper, though it had been observed in 1881 by Canadian astronomer Simon Newcomb.
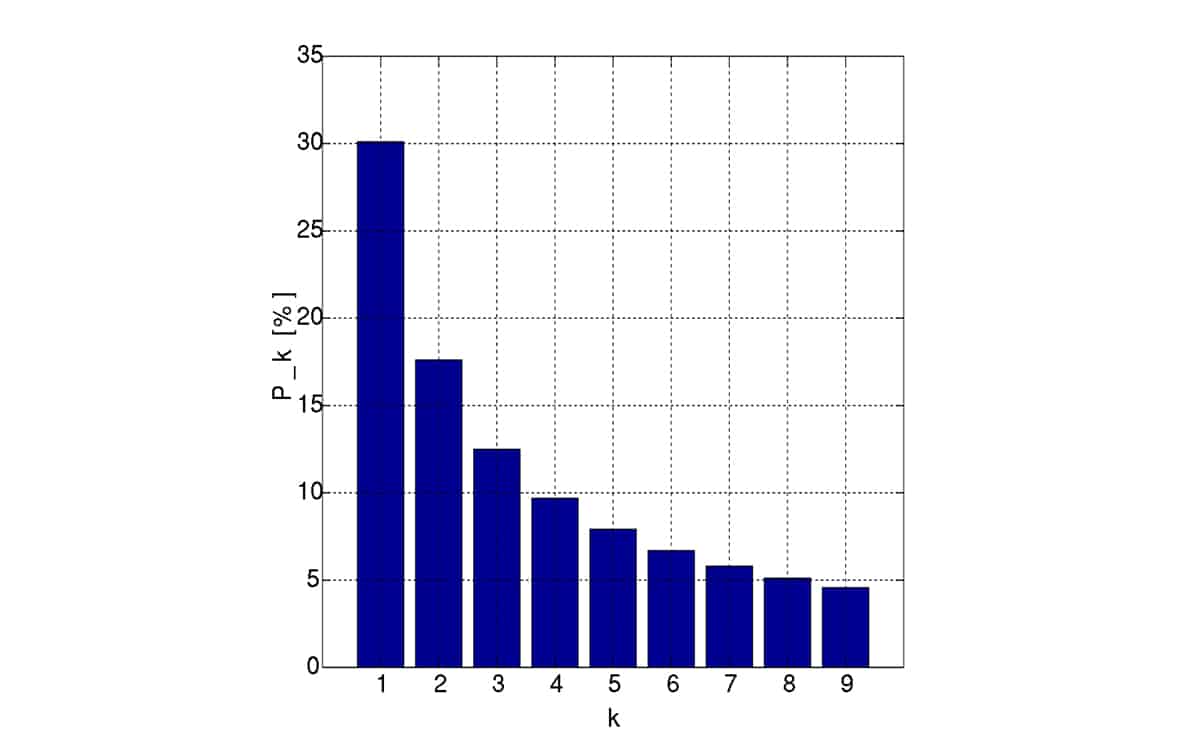
According to the law, in many big, natural datasets far more numbers begin with a 1 than any other digit. Numbers start with 1 for roughly 30% of the data, followed by the digit 2 for 17.6% of the data, whereas 9 is the leading digit just 5% of the time. Remarkably, this rule applies to everything from distributions of river lengths and volcano sizes to molecular weights.

Benford’s curve is also observed in human systems. Take a huge random sample of streets of varying sizes, for example, and you’d expect more addresses starting with 1 than those starting with 9. It can even shed light on financial fraud: with a legitimate tax return you might expect profit and expense totals to approximate a Benford curve, but if the books have been cooked, you might see more figures rounded off to 0 or 5.
But back to elections. Data scientists have previously analysed vote tallies from elections in Iran, Ukraine and elsewhere – examining the first, second and final digits of vote tallies. However, the efficacy of using Benford’s law to identify electoral fraud is contentious, with one 2011 study concluding that finding meaningful patterns is like “seeing cats, dogs, and crows in clouds”.
One proponent of “Benfordizing” election results is Walter Mebane, a political scientist from the University of Michigan, but he sees no signs of foul play in the recent US election.
The physics of public opinion
In the latest episode of the Radiolab podcast, Mebane explains why the US electoral vote counts don’t follow the law. Essentially it is because the US has a two-party political system and voter precincts are drawn up to be roughly the same size within a given district. If precincts register 1000 votes, for example, and are split roughly evenly between Trump and Biden, you’d expect most tallies to start with 4s, 5s and 6s, not 1s and 2s.
In a working paper published on 10 November, Mebane looks deeper at the US election data using a 2BL test, based on the second digits and Benford’s law digit probabilities, along with other statistical tools.
The bottom line: there are no signs of irregularity in the officially declared precinct vote counts data from Fulton County, GA, Allegheny County, PA, Milwaukee, WI, and Chicago, IL, as some have claimed.
You can find more information in this blog post by data scientist Jenifer Golbeck and this video by mathematician and author Matt Parker.


