By Louise Mayor
Today CERN announced on its Twitter feed that “the first 7 TeV LHC [proton] collisions of 2011 were recorded last night, round midnight, with low intensity beams”.
But how do particle physicists work out from the millions of detected collision events per day whether they are observing a new particle or phenomenon?
Tommaso Dorigo, a collaborator on the Compact Muon Solenoid collaboration at CERN and the Collider Detector at Fermilab, has described just what researchers are looking for and how they go about their search in a fabulous new article, “On the road to discovery”, in the March 2011 issue of Physics World. You can read it here.
In his article Dorigo breaks down the search for new physics into four general steps and to make this clear he sent us these four charming hand-drawn sketches (below).
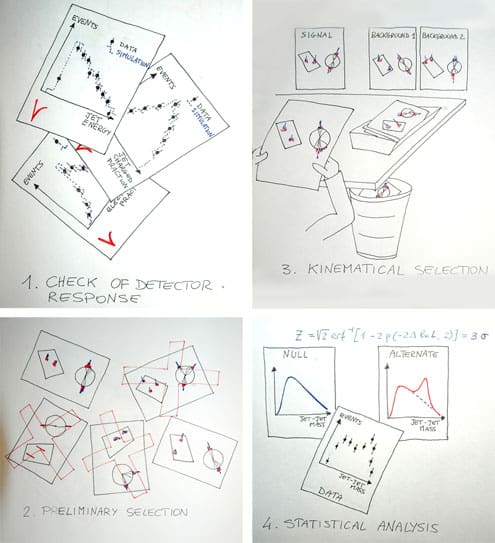
In the sketches, Dorigo imagines looking for a particle that theory says will decay to a pair of particle jets which fly out back-to-back. But before even looking for new physics, the detector must first be checked – does it do everything we expect for particles and phenomena that we do know about already? That’s step 1.
Now we’re ready to take on the maelstrom of data – huge files where as much as possible about each collision has been recorded. To make a detailed analysis of every single file would take ridiculous amounts of computer power, so step 2 involves culling anything that’s obviously not what we’re looking for. Here we’re looking for two jets back-to-back, so anything else – no jets, three jets, or two jets not back-to-back – is scrapped.
In step 3, the remaining events are split into either “background” or “signal”, and the background events – those we already understand with the Standard Model – are discarded. These are in effect considered to be background noise, and the aim is to remove this so that any signal is easier to spot.
Events are classed as “background” if the particles produced are only at a small angle to the beam so have not undergone much momentum change – you can imagine these events to be like a truck that hits a stray goose and does not go far off course, as opposed to a head-on truck-on-truck crash where debris might fly off sideways.
In the fourth and final step, the mass of the jet pairs is plotted on a histogram along with all the other events analysed so far. The shape of this distribution is compared to the “null” hypothesis – the shape if the particle being searched for doesn’t exist – and the “alternate” hypothesis – the shape if the particle does exist. Statistics are used to say how confidently the data agrees with the new idea – usually converted into units of “standard deviations”.
You can read more about this in Dorigo’s feature article: On the road to discovery.