By James Dacey
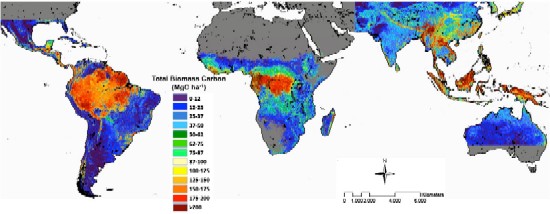
The distribution of stored carbon across the globe is considered to be a major uncertainty in greenhouse gas emissions calculations. But this map could help to improve the situation by detailing the spread of biomass carbon stocks over 2.5 billion hectares of forests across three continents – encompassing all tropical forests.
The map was created by researchers in the US, the UK and Gabon, who combined satellite data and ground-based observations to calculate above- and below-ground biomass quantities to a resolution of 1 km. To calculate forest heights, the researchers collected more than 3 million lidar shots using an instrument aboard NASA’s Ice, Cloud,and land Elevation Satellite (ICESat).
Presenting their map in a paper published online yesterday in Proceedings of the National Academy of Sciences, the researchers say that forests in the study region contained 247 GT of carbon. Forests in Latin America, sub-Saharan Africa, and south-east Asia accounted for 49%, 25% and 26% of the total carbon stock respectively.
The regions with the largest carbon biomasses are highlighted in deep red, while the zones with the least carbon are coloured in violet.
The researchers say that the new data and accompanying map could help developing countries in the study area to implement climate change mitigation policies relating to deforestation and degradation (REDD).