Sprinters are running faster than ever before, but why are javelin throwers not throwing further and swimmers not swimming faster? Steve Haake explains the effects of technology and rule change on sporting performance
We can be seduced into thinking that the only requirements for a good sporting performance are sleek bikes, golden running shoes and hydrophobic swimsuits. I have often heard people say “It’s all about the equipment these days.” But how much does technology actually affect sport? We can test the latest equipment in the lab, on a running track or in a wind tunnel to prove that one design is better than another. But to understand its effect on real performances, the proof is in the outcome – the results we see at tournaments throughout the years. If a sporting technology really does make a difference, then surely it will be visible in the results.
One way of finding out how exactly technology affects sporting performance is to examine the physics involved. We can then try to quantify the effect of technology on sporting events – and find out whether it really is all about the equipment.
Results matter
Many researchers – including me – start investigating sporting performance by looking at world records or Olympic results. The problem with world records, though, is that there can be decades between results and they only ever improve, so you cannot tell if some technology or intervention has made things worse in the gaps. Olympic results are marginally better data because they occur (mostly) every four years. Olympic data, however, are very tournament specific; a windy or rainy day (very possible this year in London), or false-start disqualifications can mean that the results do not faithfully represent performance during that four-year period.
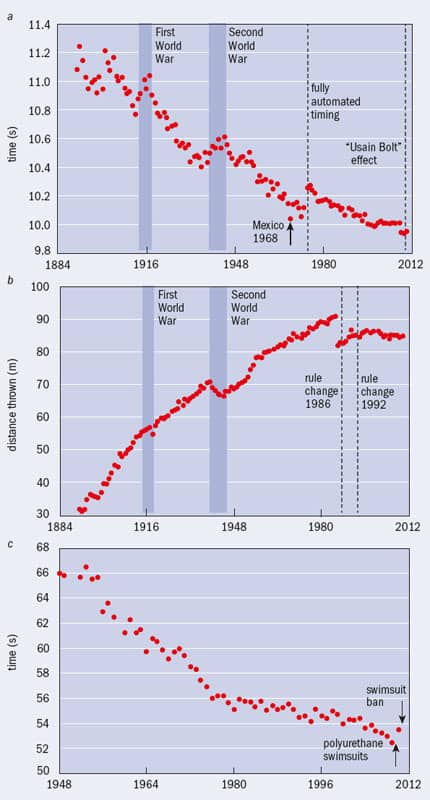
In 2010 Leon Foster, then a sports-engineering PhD student at Sheffield Hallam University in the UK, used the mean of the top 25 performances in each year going back to 1891 to look at the effects of technology on various sports. Foster used the top performance of 25 different athletes so that each athlete was used only once. There are three advantages of these data: they minimize the chance of outliers, which could appear if only the best individual is studied; there are 120 or so consecutive years of data; and they can reveal the deterioration as well as improvement in performance. What Foster found was that from 1891 to 2010 the men’s 100 m sprint times have got faster by about 1 s (figure 1a), while the men’s javelin has improved by 60 m (figure 1b). Figure 1c shows the best available data for swimming – the average of the top three times in the women’s 100 m freestyle from 1948 to 2010, which has decreased by around 13 s over that period. Common to all three sports are that performance tends to get better over time but also appears to be levelling off; and that the First and Second World Wars reduced performance dramatically.
A significant step forward in understanding the general underlying improvement in these three sports (ignoring for now the blips and step-changes) came in 2008 when Mark Denny, a professor of biomechanics at Stanford University in the US, examined the effects of population increase on running speeds in greyhounds, racehorses and humans. He started with the principle that the larger a population, the likelier it is that exceptional performances will be found by chance alone. He showed that although running performance increased as global population increased, the performance of greyhounds and racehorses has reached a plateau, which Denny put down to intensive selective breeding having already produced the optimum performance qualities in these species. But the performance of humans has not yet levelled off, indicating that there is further improvement yet to be seen. The effect of the First and Second World Wars seen in figure 1, then, was to decrease the population available to compete (as well as the number of competitions), so that performance declined. The general improvements in nutrition, coaching, access to facilities as well as population increase produce an underlying improvement that exists in all sports.
100 m sprint
So, what of technological improvements specific to running? There is an obvious step-change in the statistics for the men’s 100 m in the mid-1970s. It is caused by technology, but perhaps not the one you might have expected: it is down to the introduction of fully automated timing – and it lengthened recorded running times by about 0.2 s.
In previous years sprint times had been measured by judges, who started their stopwatch when the pistol fired and stopped it when the athlete crossed the finish line. However, the natural reaction time of the human body meant that there was a delay between the gun going off and the judge starting their stopwatch, while at the end of the race the judges could be more accurate as they could anticipate when an athlete would cross the finish line. Overall, this caused recorded times to be shorter than the sprinters’ actual times.
Fully automated timing does away with judge error as it records the time between the bang of the starter pistol and the finish, using a light beam across the finish line, to an accuracy of 0.01 s. Instrumented starting blocks are used so that a false start is registered if the athlete moves within 0.1 s of the pistol being fired, which is deemed to be the limit of human reactions. In fact, the International Association of Athletics Federations (IAAF) now adds on 0.24 s to hand-timed 100 m results when comparing them with times measured electronically.
The average of the top 25 times for 1968 of 10.04 s stands out as an exception: it is shorter than that for 1967 or 1969 by 0.1 s. Looking in the record books, the most obvious explanation is that the Olympics took place that year in Mexico City at a height of around 2300 m above sea level. To understand the consequence of this it is useful to know that the drag force on a body moving through a fluid of density ρ at speed v is ρACdv2/2, where A is the cross-sectional area of the body presented to the air and Cd is the drag coefficient of the athlete. The air density at Mexico City’s altitude is about 80% that at sea level, which means that the drag force would reduce proportionately, leading to a faster run. (Sprinters run aerobically so they are relatively unaffected by the lowered oxygen levels of high altitude during the race.) Although the Olympics was only one of the competitions held in 1968, athletes trained and competed at altitude in preparation for it, so that of the top 25 performances, a third were at altitude, leading to a distinct improvement in the 100 m performance for the whole of 1968.
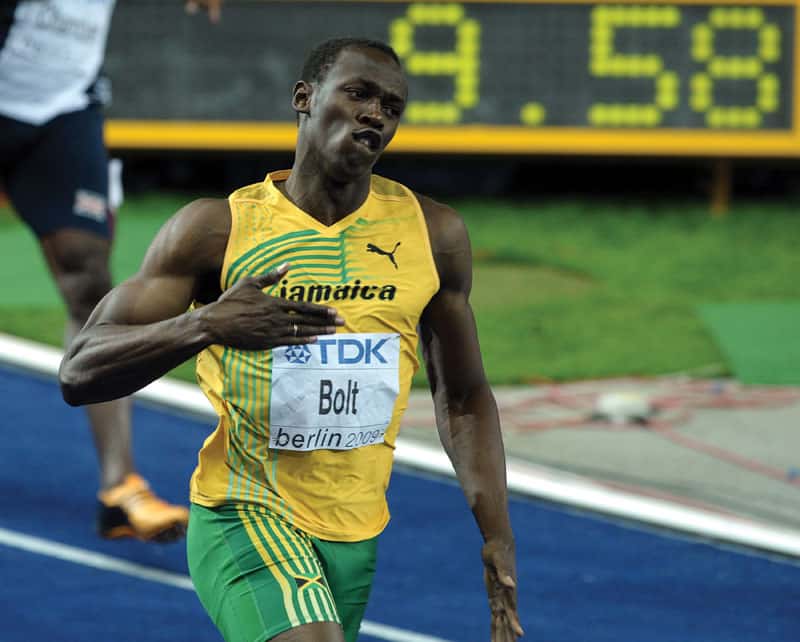
There is also a sustained step-change in average performance in the 100 m of 0.06 s in 2008 – the year when Jamaica’s Usain Bolt stormed onto the scene. It is tempting to guess that this effect is all down to Usain Bolt’s extraordinary time of 9.69 s in Beijing, but if his time is removed so that the average is taken of the remaining 24 athletes, then the step-change is almost the same. It appears, then, that these tremendous athletes suddenly competed at an even higher level than before because of the dramatic performance of their peer Usain Bolt.
Javelin throw
The most obvious feature of the men’s javelin is the downward step-change in the mid-1980s. Around this time, average distances thrown were more than 90 m, with one astounding throw of 104.8 m by Uwe Hohn in 1984. However, there was an issue at the time that made the event difficult to adjudicate: the javelin would seemingly float to the ground and land flat, so that it was hard to tell whether the tip had landed first – the main requirement in javelin competitions. To solve this, the IAAF decided to change the specifications of the javelin itself by moving its centre of mass towards the tip by 4 cm. The effect of this was to keep the nose down, reduce lift while it was in the air and force the javelin to land tip first about 9 m shorter than previously. Given that throws over 100 m were potentially endangering spectators – with javelins being hurled almost the full length of a sports stadium – this was seen as a success by the IAAF.
Following this rule change, alternative javelin designs appeared in the early 1990s with roughening or dimples (similar to those on a golf ball) on the tail to change the drag characteristics. This helped improve performances and counter the previous rule change, but ultimately a ban on these tail features was imposed at the end of 1991 (just visible in figure 1b). Performances have now levelled off at a top-25 average of around 84.5 m, which clearly falls short of the distances achieved before the rule change. The authorities handled the issue of world records by having a “new rules” world record for throws after the 1986 rule change and they even nullified some records between 1986 and 1991 rather than creating a new-new-rules world record in this period, when increasingly aerodynamic surfaces were being used. The pre-rule-change world record of 104.8 m is unlikely ever to be beaten.
100 m freestyle
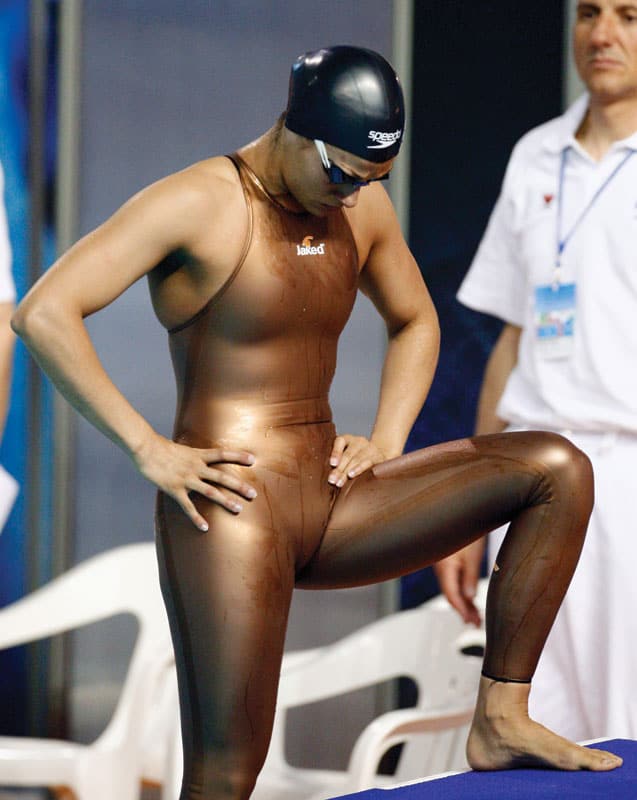
Swimming went through a tricky period between 2008 and 2010: an unprecedented 25 and 47 world records were broken in 2008 and 2009, respectively, with new technologies seen as the main cause. So although times in the women’s 100 m freestyle had gradually dropped by 12.6 s between 1948 and 2008, there was a sudden fall in 2009. This coincided with the introduction of full-body swimsuits with polyurethane panels.
The formula for drag force, mentioned earlier, can be used to understand how the new swimsuits might have improved performance. They were relatively tight and reduced the cross-sectional area of the body, A, by pulling it into a more cylindrical shape, thus reducing drag. Also, the polyurethane affected the way the water flowed over the body and effectively reduced Cd by reducing skin friction, as evident in the reduced size of the wake. A further effect was on the dynamics of the human body itself: the stiff suits stopped the relatively soft tissues wobbling, which reduced any transient changes in A or Cd during the swimming action. A further claim is that the suit trapped air, which increases buoyancy and allows the swimmer to float higher and more horizontally in the water.
On 1 January 2010 FINA (the ruling body of swimming) banned the full-body polyurethane swimsuits – a feature clearly seen in the data. As a consequence some records may not be broken for quite some time. Perhaps FINA should have created a “new rules” world record, as the IAAF did with the javelin.
Quantifying performance
One obvious problem with comparing performance across events is that the units of measurement are different, being either in metres or seconds, for example. The 100 m sprint time, for example, has decreased by about 10% in 120 years, while the javelin distance has increased by 165%. But these numbers are not necessarily valid comparisons. It is difficult to fairly compare two performances within a single sport, let alone compare performances across different sports, or quantify the effects of technologies or rule changes.
To tackle this dilemma, in 2009 I came up with the idea of the performance improvement index (PII). This works on the principle of using simple equations to determine the useful work done in a performance. For instance, the performance measure in the pole- vault is the height of the bar, so an approximation to the potential energy in the jump is mgh for an athlete of mass m. If we take a baseline performance h1 for our comparison, then the height of any other jump h2 can be compared using (work)2/(work)1 = (mgh)2/(mgh)1.
If we use an average of the top 25 athletes, then the average mass is not likely to change too much so that the PII is the ratio h2/h1. For example, comparing the top-25 average performance in the pole vault in 2010 of 5.76 m to the 4.26 m average for 1948 gives an index of 1.23 (equating to an improvement of 23%).

For a throwing event such as the javelin, the PII works out as d2/d1, where a throw of distance d2 is compared with a baseline performance d1. Comparing the top-25 average of the men’s javelin in 2010 of 84.78 m with that in 1948 of 68.81 m gives a PII of 1.35 (equating to an improvement of 35%).
In running, the dominant retarding force is the ubiquitous drag force. The PII here – a ratio of work done (force × distance) for two events – simplifies to the square of the inverse ratio of the times taken to run the race: (t1/t2)2. This assumes fixed air density and distance, and that the top-25 average ACd is a constant over time. As an example, the top-25 average of the men’s 100 m sprint in 1948 was 10.42 s. Comparing this with the average of 9.96 s in 2010 gives a PII of 1.10 (or a 10% increase).
The same PII equation can be used for swimming, where hydrodynamic drag is also the dominant retarding force. In the women’s 100 m freestyle, the 12.4 s decrease between 1948 and 2010 equates to a PII of 1.52 (or a 52% increase).
One to watch

These PII equations can be used to compare performance change within or across sports and to quantify the effect of technologies or any other effect visible in the data. For example, figure 2 compares the PII for the men’s 100 m sprint and javelin, and the women’s 100 m freestyle swimming, using the post-war performances of 1948 as a baseline.
PII values for the 100 m sprint can be seen to have increased by around 10% by 2010, with fully automated timing causing a decrease of 2.8% in 1974. The year 1968 saw a transient 2.2% improvement caused by performances at altitude, while the “Usain Bolt effect” since 2008 has caused a boost of 1.4%. The 1986 javelin rule change – moving the centre of mass – reduced performance by about 13%, while the 1991 rule change about aerodynamics further reduced it by 2.4%. The 2010 ban on full-body polyurethane swimsuits lowered the PII in the women’s 100 m freestyle by around 6.1%, showing the approximate gain they must have given. There is also a steep rise of more than 10% between 1970 and 1976, which is likely caused by something that is less controversial these days – the introduction of hats and goggles, and the concept of shaving off body hair to reduce drag.
So what can we expect this summer? Of the sports studied here, the javelin is the least likely to show significant improvement, as it appears to have reached a plateau. In swimming, there will be few world records in the sprint events because of the swimsuit ban. If there are any records in swimming, they are likely to be in the long-distance events where the suits had less effect (possibly because their stiffness caused an increase in fatigue).
The data point toward the men’s 100 m sprint being one event not to miss. The top-25 average coming into 2012 is already consistently below 10 s, so expect fast performances and extreme rivalry. Weather permitting, of course.
At a glance: Elite performance
- Sporting performance has improved over time because of population increase, improved nutrition, coaching and access to facilities
- In addition, there have been step-changes and blips in performance caused by new technologies, rule changes and more abstract causes such as the “Usain Bolt effect”
- The amount by which these steps and blips affect performance can be quantified using the “performance improvement index” (PII)
- The PII can also be used to compare performances within and across sports, and to predict in which events to look out for new world records
More about: Elite performance
M W Denny 2008 Limits to running speed in dogs, horses and humans J. Exp. Biol. 211 3836
L Foster, D James and S J Haake 2010 Understanding the influence of population size on athletic performance Procedia Engineering 2 3183
S Haake 2009 The impact of technology on sporting performance in Olympic sports J. Sports Sci. 27 1421