The international financial markets are proving profitable for physicists who can apply techniques from theoretical and statistical physics to the complex dynamics of stocks, shares, interest rates and complex financial products known as derivatives.

A small number of physicists have always worked on the financial markets. Employed by banks and other financial institutions, these so-called “rocket scientists” have been valued for their mathematical and computational skills, and their ability to analyse extremely complex problems. And as international finance has become even more complicated, the demand for rocket scientists – most of whom have PhDs – has increased, as have their famously high salaries.
In the past decade these physicists, who tend to be in their twenties, have been joined by more senior physicists who have become interested in both the theoretical and applied problems raised by the financial industry. Many of these physicists have set up their own companies, and some have even abandoned research altogether for a career in finance. While much of the work is confidential in nature, a good deal of it is published in physics journals and on the Web (see further reading). And in July this year the first European Physical Society meeting on the applications of physics in finance will take place in Dublin.
There is no single international finance market. Rather, there are many different markets working in different time zones and dealing in various assets in a large number of currencies. It is this complexity – coupled with the dynamic nature of the markets – that makes international finance an exciting career for physicists. For example, there are stock exchanges in New York, Tokyo, London, Paris, Hong Kong and many other cities across the world, and the values of shares traded on these exchanges can vary from second to second. And just as stocks and shares are bought and sold on stock exchanges, products as diverse as coffee and precious metals are traded on commodity markets around the globe. There are also, for example, markets for interest rates, the debts of emerging countries and more complex financial products known as “derivatives”.
There are also many different players in each of these markets – several types of bank (national, merchant, investment), insurance companies and international finance houses such as Goldman Sachs, Merrill Lynch and Salomon Smith Barney. Although these companies all have different aims – some banks lend money to customers, others help raise capital for clients – they are all interested in increasing the value of their investments while, at the same time, minimizing the risk associated with this investment.
Physicists can play a key role in helping all the players in the finance markets achieve this goal. Whether modelling interest rates or evaluating the risk associated with complex financial deals such as derivatives, there is a need for a mixture of intuition based on observation and an ability to use highly technical mathematical tools – a combination of skills that good physicists possess. Many of these physicists work for large financial institutions and investment houses, but an increasing number are employed by . Many of these have been set up by physicists.
Selected finance companies set up by physicists
Numerix, New York (www.dews.com). Managing partners include Mitchell Feigenbaum, head of the physics department at Rockerfeller University in New York, and Nigel Goldenfeld, professor of physics at the University of Illinois. Numerix’s director of R&D, Alexander Sokol, has a PhD from the Landau Institute for Theoretical Physics in Moscow.
Olsen & Associates, Zurich (www.olsen.ch). Founding members include Michel Dacorogna, who has a PhD in solid-state physics from the University of Geneva.
Oxford Financial Group, Oxford (www.oxfordfinancial.ac.uk). Set up by three mathematicians at Oxford University – Jeff Dewynne, Sam Howison and Paul Wilmott. Key personnel include Adam Hartley, a theoretical atomic physicist from Oxford.
Prediction Company, Santa Fe (www.predict.coni). Founded by Doyne Farmer, a former physicist at Los Alamos, and Norman Packard, previously professor of physics at the University of Illinois. Farmer and Packard were early pioneers in chaos theory and their attempt to “beat the odds” at roulette in Las Vegas using computers built into their shoes was the subject of the book The Newtonian Casino.
Science & Finance, Paris (www.science-finance.fr). Set up in 1994 by one of the authors (JPB), a theoretical condensed-matter physicist at the French atomic energy commission (CEA) in Saclay near Paris, and by Jean-Pierre Aguilar, an engineer and one-time trader. The staff all have PhDs in statistical physics. Aguilar also founded a financial software company that employs more than 120 people, and a fully automated trading company.
Random walks in science and finance
The idea that some financial problems can be addressed with the help of scientific tools is not new. It dates back to 1900 when Louis Bachelier, who studied under Poincaré in Paris, proposed that fluctuations in the prices of stocks and shares could be viewed as a random walk. His PhD thesis actually contained remarkable results and insights, which anticipated not only Einstein’s theory of Brownian motion, published in 1905, but also many of the post-war ideas in theoretical finance.
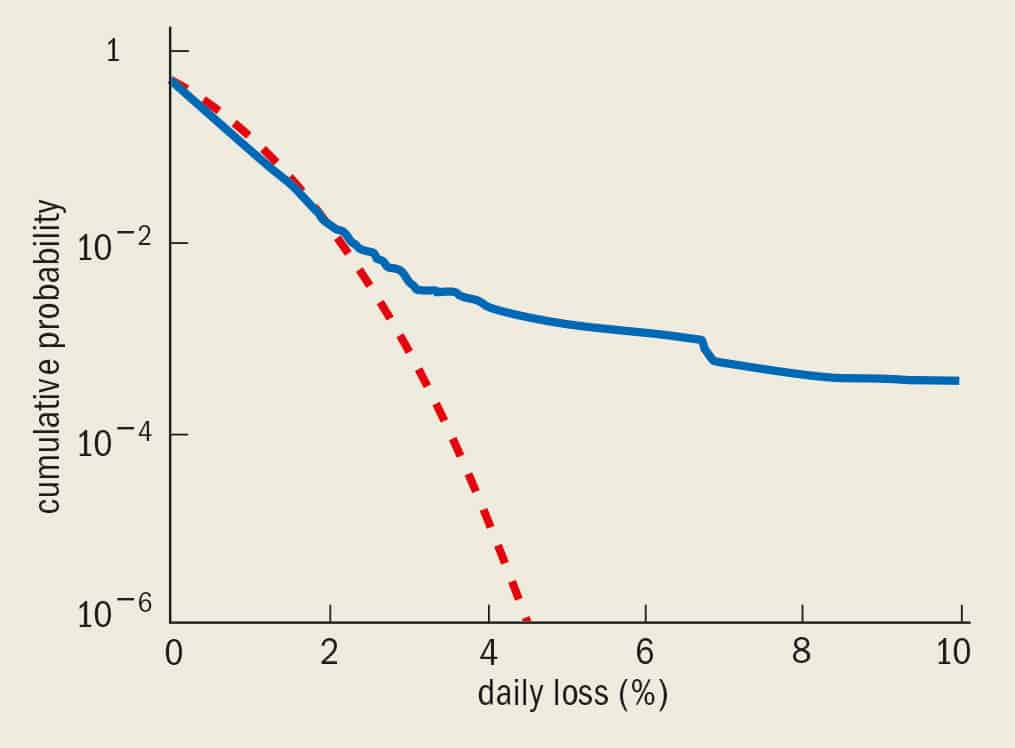
Bachelier’s model of the stock market was, however, too simple and failed to capture many of the crucial aspects of price fluctuations – for example the possibility of crashes. Bachelier assumed that many of the fluctuations followed a Gaussian probability distribution, but crashes were absent from his model because the probability of extreme events is embarrassingly small in a Gaussian world (see figure 1). Since then many scientists have tried to develop better models. The development of a reliable model for price fluctuations is crucial for better control of financial risk by all the key players on the international finance markets. Indeed, the markets can be seen as “risk exchanges” in which players are always trying to reduce risk.
A model of price fluctuations tries to predict what may happen in the future, and with what probability. However, the idea that one could predict what will happen with certainty is obviously absurd. The aim is to develop statistical rules – for example, what is the probability that the price of a particular share will go up (or down) by $1 between today and tomorrow? Inputs to the models include current and past share prices, interest rates and so on. One can test the model by comparing its predictions with actual price changes, and then adjust the value of the parameters in the model to obtain the best representation of reality. A good model is always a trade-off between mathematical simplicity and descriptive power.
From the model, one can then compute various interesting quantities, such as the price of a derivative or the probability for an adverse move, which is essential information when assessing and managing the risk associated with a portfolio of investments. Indeed, Bachelier actually proposed a model for the price of “options”, a form of derivative, in 1900 and compared it with the data available at the time.
Several models of increasing complexity, starting with Mandelbrot’s 1963 “fat tailed” model, have been proposed over the years, but none of these has been firmly established yet. Put simply, all of these models get some things right and some things wrong.
So where does a physicist who is interested in analysing the finance markets begin? The international financial markets generate lots of data about the high-frequency variations in price of many different assets (stocks, currencies, bonds and so on), and these data are available to physicists for analysis. Physicists have their own way of analysing data, which is very different from the way econometricians (as economists who specialize in this area are called) look at data. For example, physicists are not interested in proving that a statistical model is right, but rather in extracting useful intuitions based on observation and developing computational methods to develop this intuition. As physicists we are sure that analysis of financial data will undoubtedly benefit from ideas and methods invented for statistical physics, such as critical phenomena, turbulence and various non-equilibrium phenomena. There is certainly no shortage of data for physicists to look at – one year of trading on the New York stock exchange generates enough data to fill tens of CD-ROMs.
Physicists have also become interested in the development of simple microscopic models that deal with the interaction between traders, and the feedback of past price variations on their behaviour. Whereas models of price fluctuations aim to be descriptive (like, for example, the ideal gas equation, which links the temperature, pressure and volume of a gas), these microscopic models aim to be explicative (like the statistical theory of gases, which explains why the ideal gas equation works).
Signals and noise
From a physical point of view some of the most interesting phenomena on the stock markets – and for which relatively little data are available – are extreme events such as crashes. The probability of such extreme events, which are obviously the most relevant ones for risk management, are also those for which the observation of past time series is not reliable – precisely because only very few of these events occur. Furthermore, the amplitude of “big crashes” is systematically larger than what the extrapolation based on “small” and “moderate” crashes would suggest, as if some nonlinear amplification effect (probably due to imitation and panic) comes into play beyond a certain level of price drop. There is therefore a need for a better theoretical description of crashes to supplement the shortage of real data.
A topic of much research is the possible connection between financial crashes and “critical points” in statistical mechanics, where the response of a physical system to a small external perturbation becomes infinite because all the subparts of the system respond co-operatively. Classic examples include the liquid-gas critical point in water and the Curie point in magnetism (i.e. the temperature above which ferromagnetic materials become paramagnetic). Similarly, during crashes, a large proportion of the players in a market decide simultaneously to sell their stocks.
It was recently claimed by Didier Sornette of the University of Nice in France and Anders Johansen of the University of California at Los Angeles, by James Feigenbaum and Peter Freund of the University of Chicago, and by Marcel Ausloos of the University of Liege in Belgium and colleagues, that this critical point was one with so-called “log-periodic” corrections. This type of critical point is increasingly being used to describe earthquakes and the fracture of materials. The basic idea behind the log-periodic approach is that oscillations in a system occur closer and closer together until they all accumulate at one time, the critical time, tc. When this method is applied to the stock market, the crash occurs at tc. Therefore, to predict when a crash will occur, it is necessary to identify these oscillations – the precursors to the crash – and the parameter, l, relating the period between them.
Recently some physicists claimed to have successfully predicted the October 1997 turmoil on the markets – when shares crashed in value on several stock exchanges across the world – using the log-periodic approach. However, this claim has been disputed by other groups, including ourselves (see box “Can crashes be predicted?”).
Among the ideas coming from statistical physics that might prove quite fruitful is the concept of “noise”. For example, although we know that the Brownian motion of a large particle interacting with many small molecules can, in principle, be described in terms of deterministic equations, Langevin showed that the intricate influence of the molecules can be replaced by an random force that fluctuates with time and has an amplitude related to what we call “temperature”. It is much easier to predict the statistical properties of the motion of the particle with Langevin’s approach than it is to solve all the equations of motion.
Similarly, although it may in principle be possible to model the behaviour of each individual operator or “agent” in a financial market, this is obviously a daunting task. The fact that one of them needs to sell his stock because he wants to buy a car, or that another one wants to buy some stocks because a friend advised him to do so, might be more conveniently described, on a coarser scale, by a Langevin noise.
However, many economists – who believe that agents are rational and try to optimize their “utility function” (essentially a trade-off between profit and risk) – are reluctant to accept such a theoretical shortcut. Indeed, some economists even claim that it is “an insult to the intelligence of the market” to invoke the presence of a noise term!
Interestingly, the same debate happened recently between engineers and physicists in the context of traffic modelling, where the analogue of the rational-agent hypothesis is that each driver wants to maximize his or her speed. Without any “noise” to account for unexpected braking events (caused, for example, by the driver sneezing), the rational-driver model predicts a steady flow of cars all moving rapidly along the road. As soon as a small amount of noise is introduced, however, traffic jams appear and disrupt the steady flow – and make the model more realistic. In other words, the addition of an arbitrarily small amount of noise allows one to reproduce an everyday phenomenon that would be absent in a perfectly rational world. Similarly, one can expect that small irrational effects might completely change the picture emerging from a completely rational economic model.
One of the fundamental tenets of the rational economy is that it is impossible to make a risk-free profit – this means that successful automated trading should also be impossible. Notwithstanding this impossibility, the quest for this modern “philosophical stone” – a guaranteed (“risk-free”) way to make money on the financial markets – is still blossoming. Many different techniques from physics and the other sciences have been explored, sometimes frantically, including methods from deterministic chaos, neural networks and pattern recognition. We feel, however, that the bulk of the published results on trading models suffer from serious flaws, probably due to enthusiasm taking over from scientific rigour. On the other hand, it is possible that some of these methods could be used successfully by more systematic trading managers.
Can crashes be predicted?

Recently Marcel Ausloos of the University of Liege in Belgium and colleagues claimed that the October 1997 turmoil on the markets – when shares crashed in value on the Hang Seng and several other stock exchanges – could have been anticipated. Their prediction was announced in Tendances, a Belgian economics magazine, on18 September 1997. The prediction was based on a log-periodic approach (see Vandewalle et al. in further reading).
In a log-periodic scenario the times, ti, of successive minima (and maxima) should follow a geometrical progression, i.e. (tn+1 – tn)/(tn – tn–1) = λ(tn – tn–1)/(tn–1 – tn–2)(λ < 1). The minima or maxima will get closer and closer together until they converge at the critical (or crash) time, tc = t∞. Ausloos and co-workers based their prediction on a log-periodic continuation of the four local minima in the S&P 500 stock index labelled t1 through t4 in the figure. A follow-up story in the 30 October issue reported that the crash had been predicted in advance.
However, serious doubts about these claims have also been put forward by us (see Laloux et al. in further reading). For example, the procedure is ambiguous since other minima exist. Moreover, the theory predicts that a still bigger crash should have occurred at the end of November 1997 (this would have been t6), but this did not happen. Furthermore, unlike the Hang Seng, which crashed, the S&P experienced only a “correction”, whereas it was predicted to crash by the log-periodic fits. Apart from the fact that the empirical evidence is thin, a plausible theoretical link between “log-periodic” oscillations and price fluctuations has yet to be established.
Complexity in action
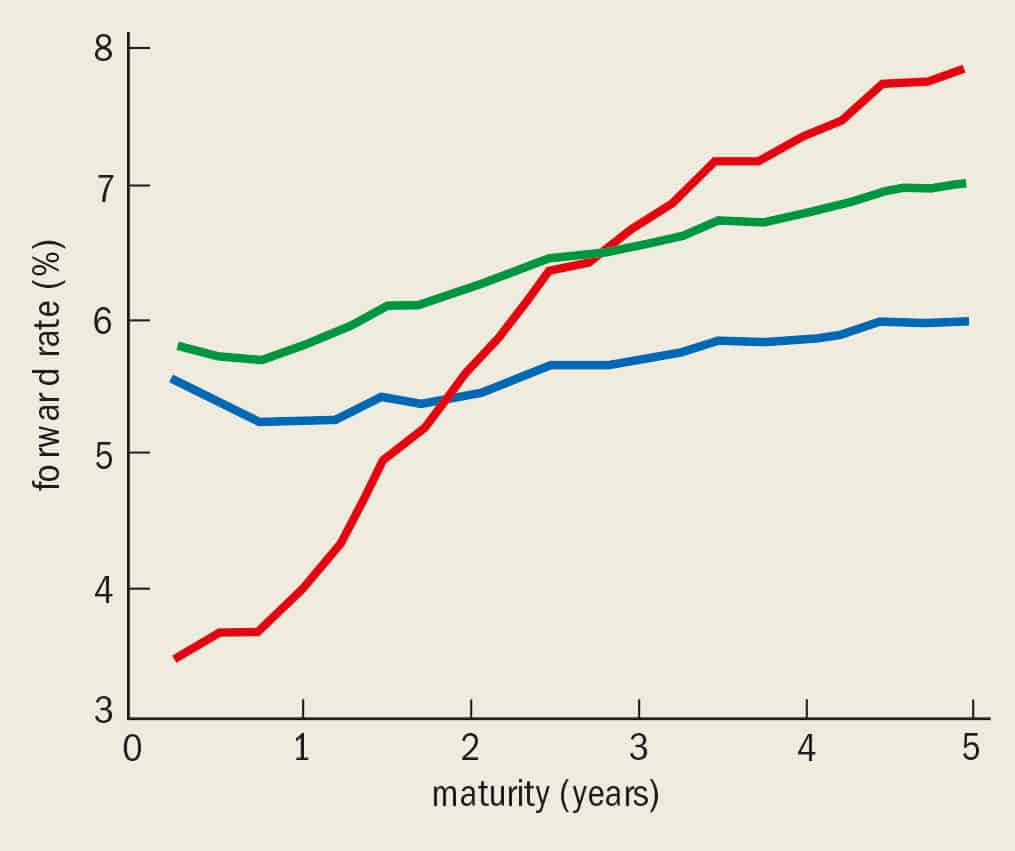
Another reason for scientists to be interested in financial problems is that some of these are truly complex. Take, for example, the “interest-rate curve”: this is essentially the graph that shows how the rate of interest charged to a borrower depends on the length of time of the loan. The interest-rate curve reflects the fact that the cost of borrowing a certain sum from one day to the next differs from the cost of borrowing the same amount for a week, a month, a year, ten years and so on. The interest rate for a loan of fixed duration will also vary with time: for example, the interest rate for a three-month loan taken out one year in the future will differ from the rate for a three-month loan two years in the future. The curve showing how this rate varies is called the forward-rate curve. At any time all of these different rates will be determined by the market, but they will all change over time, much like stocks (see figure 2). However, they will change in a correlated manner because, for instance, the four-year rate and the four-and-a-half year rate will not be very different.
In many ways the evolution of the forward-rate curve resembles the behaviour of an elastic string, with fictitious springs holding loans taken out at different times (i.e. loans of different “maturity”) together. By modelling how the interest-rate curve will vary over time, physicists can help to reduce risk, manage debt and set prices for derivatives based on interest rates (see Bouchaud et al. in further reading).
Other complex problems are found on the derivatives markets. “Options” and “futures” are examples of derivatives – products whose values are derived from the value of something else, for example shares or interest rates. A future is an agreement to buy (or sell) something at a given time in the future for a price agreed now. No money changes hands initially, although the buyer has to put up a from of surety (called the margin) to cover potential losses.
Options are basically insurance contracts. In an option, the buyer pays a small amount now for the right – not the obligation – to buy or sell something at a given price some time in the future. If the price of the stock happens to drop below this price, then the “writer” of the option will pay the difference. There are many different types of options, and most of them are heavily geared. Take a simple example of a “call option”. I pay £5 now for the option to buy some stock, currently worth £95, at a price of £100 six months from now. If in six months the stock is worth, say, £110, I can sell it immediately. Therefore the £5 I invested is now worth £10 – a profit of 100%. If I had bought the stock itself for £95 and sold it for £110, I would only have made a profit of 16%. But if the stock never rises above £100, I lose all my £5.
Options involve two basic questions. First, what price should the buyer agree to pay? (or how much should the writer of the option charge?). And second, what is the best strategy for the writer to follow – in terms of the number of stocks they should buy or sell during the lifetime of the contract – in order to minimize their risk?
One of the major achievements of modern finance is the Black-Scholes theory of option pricing, which addresses the above two questions. The theory was developed by the late Fischer Black – who had a first degree in physics and a PhD in applied mathematics – and Myron Scholes, an economist at Stanford University in California. Scholes shared the 1997 Nobel Prize for Economics with Robert Merton of Harvard, whose first degrees are in engineering and applied maths. Black would almost certainly have shared the prize had he still been alive. The serves as a common language for all participants in option markets, and it underpins most of the software used in the business.
Unfortunately, the model used by Black and Scholes is Gaussian. This is very convenient from a mathematical point of view because one can rely on a score of useful tools, such as stochastic calculus, to solve it. However, as shown in figure 1, the markets are far from Gaussian. Moreover, in the Black-Scholes world, option writing can be made a completely risk-free operation – which is completely at odds with common sense (see Hull in further reading). The idea that risk can be reduced to zero can lead to a misleading – and potentially disastrous – sense of security on the financial markets.
However, it has recently been shown that this risk-free property is very specific to the Gaussian model and is not true for more realistic models (see Bouchaud and Potters in further reading). In reality, the residual risk is not, perhaps not surprisingly, that small compared with the price of the option. Developing a theory of derivative products in which the risk is properly estimated is a major challenge for econometricians and physicists alike.
The Black–Scholes equation
The Black–Scholes model assumes that the statistics of relative price changes is Gaussian, and that the time between two trades can be made arbitrarily small. This means that prices follow a continuous random walk with time. A further assumption is that markets are efficient and that arbitrage opportunities cannot exist. In other words, there is no risk-free way to make money by trading options.
These assumptions allow one to use the formalism of stochastic differential equations, from which the existence of a zero-risk strategy easily follows. However, the financial return on a zero-risk strategy can only be zero, or else one of the parties would lose money for sure. (In order to allow the possibility of making a profit it is necessary to introduce some risk into the problem.) This, in turn, leads to a partial differential equation – the Black-Scholes equation – for the price of the derivative
δV/δt + 1/2α2S2(δ2V/δS2) + rS(δV/δS) – rV= 0
where V(S,t) is the value of the derivative, S is the price of the root asset, t is time, α is the volatility and r is the risk-free interest rate.
This equation is very similar to the heat (or diffusion) equation in physics. The equation can be readily solved to set the price of the option or devise the perfect “hedging” strategy. (Hedging is the reduction of risk.) Unfortunately, as soon as one of the assumptions (i.e. Gaussian statistics or continuous time) underlying the equation fails, the stochastic differential methods fail and, more importantly, the idea of zero-risk falls to pieces.
On the other hand, the theory is internally consistent and yields a fair first approximation for the option price and the optimal hedging strategy: this is why the model has been adopted by the option market and empirically improved over the years. However, the idea that risk is somehow small, if not exactly zero, has remained in most people’s minds. Given the nature of the market, this can be a very dangerous and expensive perception.
Options for the future
There are many other areas in economics and finance where physicists can usefully try out their favourite tools. Monte Carlo simulations and path-integral techniques for solving partial differential equations are proving useful as derivatives become more sophisticated and analytic solutions are no longer available. And random matrix theory – which has been used in areas of physics as diverse as quantum transport theory and nuclear physics – is being investigated to optimize investment portfolios.
One of the primary assets that physicists bring to finance and economics is their intermediate level of mathematical sophistication – half way between the empirical knowledge of traders and the highly formal approach taken by economists, which is sometimes remote from reality. The use of intuition based on decades of research into the highly complex systems found in statistical physics – including finely honed approximation schemes and problem-solving techniques – offers a new dimension not found in economics textbooks.
Further reading
Much of the research described in this article has been published in Europhysics Letters, European Physical Journal B (formerly Journal de Physique), Physica A and the newly created International Journal of Theoretical and Applied Finance, and on Web sites such as www.ge.infm.it/econophysics and xxx.lanl.gov/abs/cond-mat
J-P Bouchaud et al. 1998 Strings attached RISK Magazine July p56
J-P Bouchaud and M Potters 1997 Theorie des Risques Financiers (Alea-Saclay, Eyrolles, Paris)
D M Gulllaume et al. 1997 From the bird’s eye to the microscope Finance and Stochastics 1 2
J C Hull 1997 Futures, Options and Other Derivative Securities (Prentice Hall, International Edition)
L Laloux et al. 1998 Are financial crashes predictable? cond-mat/9804111 Europhysics Letters at press
B Mandelbrot 1997 Scaling and Fractals in Finance (Springer, Berlin)
N Vandewalle et al. 1998 How the financial crash of October 1997 could have been predicted Eur. Phys. J. B4 139