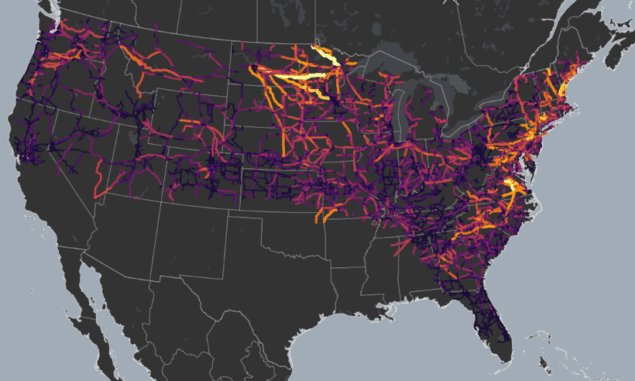
A new geoelectrical hazard map covering two-thirds of the United States has been released by the US Geological Survey (USGS). The map shows the voltages liable to be induced on the US power grid in the event of a once-in-a-century magnetic super-storm and it could help power companies better protect their infrastructure and reduce the risk of future blackouts.
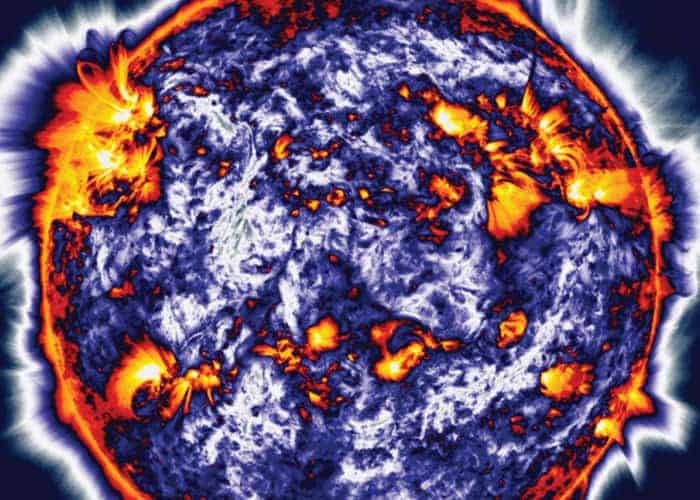
Geomagnetic storms are rare disturbances of the Earth’s magnetic environment that begin with large ejections of charged particles from the Sun that boost the intensity of the solar wind. When these particles reach Earth, they interacts with the magnetosphere and ionosphere to create a magnetic storm. If the original coronal mass ejection is large enough, the result is a magnetic super-storm.
These storms generate electric fields in the Earth’s crust and mantle — which have the potential to disrupt electric power grids and even cause large-scale outages. In the March of 1989, for example, a storm caused a 9 h blackout in Quebec, Canada. Larger events — like the storms that struck in May 1921 and “Carrington storm” of 1859 — caused stunning aurora and widespread disruption to telegraph networks, even setting some telegraph stations on fire.
Huge economic cost
According to the US National Academy of Sciences, were a super-storm of similar intensity to the Carrington event to strike the US today, it would cause widespread blackouts, significant infrastructure damage and cost the US economy some $2 trillion.
In their study, Jeffrey Love and colleagues at the USGS analysed magnetic measurements – both long-term monitoring of geomagnetic disturbances by ground-based observatories during 1985-2015 and magnetotelluric surveys of the local electrical conductivity of the Earth.
They combined these with the most recent public maps of America’s high-voltage transmission lines. The geographical limits of the study were constrained by the fact that, to date, only the upper two thirds of the US mainland has been magnetically surveyed.
Four regions at high risk
The team identified four areas of the US that would be particular vulnerable in the event of a geomagnetic super-storm: the East Coast; the Denver metropolitan area; the Pacific Northwest; and the Upper Midwest. In some areas, transmission line voltages could approach 1000 V in the event of a super-storm, they found.
“It is noteworthy that high hazards are seen in the northern Midwest and in the eastern part of the United States – near major metropolitan centres,” Love told Physics World. These areas of increased hazard are the result of three factors, he explained – “the level of magnetic storm activity, the electrical conductivity structure of the solid Earth, and the topology of the power grid”.
The research demonstrates the importance of underlying geological structures on the intensity of storm-induced voltages in given areas. In areas of more electrically resistive rock, it is difficult for currents to flow through the ground in response to a storm-induced geoelectric field. Instead, huge and destructive currents are driven along power lines – a scenario that played out in Quebec.
Long lines are more susceptible
In addition, the team note that regions full of long transmission lines – such as might connect geographically sparse centres of population — might be particularly susceptible to geomagnetically-induced current. “Long transmission lines tend to experience greater storm-time voltage because voltage is the integration of an electric field across a length — in this case the length of the transmission line,” Love explained. “Whether or not this voltage, however, translates to a problem for the power grid depends on the parameters of the grid: line resistance and interconnectivity.”
“The new voltage map is a critical step forward in our ability to assess the nation’s risk to geoelectrical hazards,” said USGS director Jim Reilly. “This information will allow utility companies to evaluate the vulnerability of their power-grid systems to magnetic storms and take important steps to improve grid resilience.”
What if a solar super-storm hit?
“One of the main challenges for risk analysts when it comes to space weather hazards has been the lack of data available to help establish worst-case scenario,” commented Edward Oughton, a data scientist from the University of Oxford’s Environmental Change Institute. “This uncertainty holds back effective decision making, and leads to a non-optimal allocation of limited resources.”
With their initial study complete, the researchers are now awaiting the completion of the magnetotelluric surveying of the outstanding, southwestern, part of the contiguous United States – a project for which funding has recently been legislated. When this has been completed, Love said, the team will combining these measurements with observatory data to complete the mapping project.
The research is described in the journal Space Weather.
