Martin Jones describes how new approaches to electron microscopy are helping biomedical scientists get the most out of ever-increasing flows of data
.")
Most of you are probably familiar with at least some of the “big data” involved in biomedical research. In the decade and a half since the Human Genome Project mapped the sequence of the three billion or so nucleotide base pairs in human DNA, datasets in the study of genomics (both human and other organisms) have expanded into the terabyte regime. These datasets are often handled by specialist “bioinformaticians” – the job title alluding to the central role of maths and informatics it entails – rather than by the biomedical specialists themselves.
In recent years, a variety of imaging methods have joined bioinformatics in the big data era. An ever-expanding panoply of imaging modalities, including various flavours of light microscopy, electron microscopy, X-ray microscopy, imaging mass cytometry and others, are now being put to work on biomedical problems. With these new techniques come new data challenges, including cases where data is produced faster than a standard hard drive can write, and the large-volume, high-resolution images from a single experiment can take up many terabytes of storage. This has created a need for instrument scientists like me, who specialize in developing custom systems and techniques, for times when the one-size-fits-all commercial solutions can’t cope with the data onslaught.
The evolution of biomedical microscopy
When the likes of Robert Hooke and Antonie van Leeuwenhoek began experimenting with biological samples and light microscopes in the 17th century, their “imaging process” consisted of hand-drawing the sample as they saw it through their home-made scopes. Modern technologies such as lasers and digital cameras have made the imaging process far more automated, while advances in light microscopy have greatly expanded the range of structures that can be imaged. One of the most important recent advances has been the ability to label structures of interest with fluorescent markers. For example, green fluorescent protein – a substance that was originally cloned from a jellyfish, and which won its discoverers the 2008 Nobel Prize for Chemistry – allows scientists to “tag” objects of interest so that they shine like a beacon when illuminated with a particular wavelength of light. This provides functional information about the sample, and multiple different objects (such as subcellular organelles or virus particles), can be tagged with different colours within the same sample.

There are, however, limits to what even the most advanced light microscopes can see. The Rayleigh criterion (or the similar Abbe limit more commonly used in biology) states that two objects cannot be resolved if they are separated by less than around half of the wavelength of the light – around 200 nm for typical experiments. Since many important biological structures and molecules are much smaller than this, we must turn to other methods to probe them. One solution is the family of “super-resolution” fluorescent techniques, such as stimulated emission depletion (STED) and single molecule localization (the subject of the 2014 Nobel Prize for Chemistry). Another is electron microscopy, where the short de Broglie wavelength of electron beams gives a much higher resolution than visible-light microscopy. This reveals the ultrastructure of the sample in exquisite detail, but without the functionally specific labelling we can achieve with fluorescence microscopy.
Another drawback of electron microscopy is that traditionally, it has been a relatively low-throughput method, with extensive and time-consuming sample preparation required for each 2D snapshot. For example, slicing a sample into sections thin enough for an electron beam to pass through them, as occurs in transmission electron microscopy (TEM), involves embedding soft biological materials in a hard substance such as resin. This allows the sample to be sliced into sections around 100 nm thick using a device called an ultramicrotome. These sections are then collected on a tiny metal grid and loaded into the microscope.
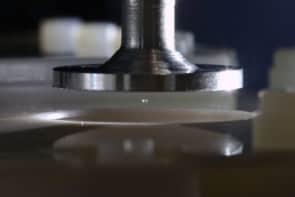
Newer electron microscopy techniques, in contrast, incorporate a cutting mechanism into the vacuum chamber of the microscope itself. In these systems, the sample’s surface is imaged with a scanning electron microscope (SEM). Next, a tiny sliver is shaved off to reveal a new surface a few nanometres deeper. The cutting mechanism can be either a diamond knife (in a serial block face scanning electron microscope – SBF SEM) or a beam of high-energy ions (in a focused ion beam scanning electron microscope – FIB SEM), as shown in the image at the beginning of this article. Repeating this process automatically can produce terabytes of dense 3D image data per day. For example, the reconstruction of a single HeLa cell shown in the image above was created from data in the terabyte regime captured in a FIB SEM system at a scale of 5 nm per pixel. High levels of precision, however, do not come quickly: this single image took a few days to create.
Analysing the data
Many of the analysis tasks we perform fall broadly into the “finding a needle in a haystack” category. Often, when we acquire data from a sample containing many cells, only one or a few are exhibiting a behaviour or structure of interest. An example might be a rare event such as the transient initial interaction and fusion of cells that creates blood vessels (2009 PLOS One 4 e7716). This process is of particular interest because cancerous tumours sometimes co-opt the formation of new blood vessels in order to grow. For practical purposes, when studying such events, it is often necessary to image a relatively large region of tissue to ensure the structure of interest is captured in full. However, this leaves us with the problem of finding the cell of interest amongst the sea of its much more abundant, but less relevant, neighbours.
In general, EM image analysis has been stubbornly resistant to automated computational processing. Consequently, it is often done manually, with a researcher sifting through the images and tracing around different structures (a process called “segmentation”) to ascertain which of the many similar looking cells are the ones to be studied. This takes a huge amount of time – frequently many times longer to analyse the images than to acquire them.
If this problem sounds familiar, it’s probably because physicists have been dealing with similar data gluts for years. Particle physicists and astronomers, in particular, are well versed in data reduction techniques, which help to ensure that uninteresting data does not unnecessarily trouble the processors of the computers doing the analysis. In biomedical imaging, we can perform similar tricks. For example, we can combine the benefits of fluorescence microscopy (functional localization) and electron microscopy (ultrastructural resolution) into a hybrid known as correlative light and electron microscopy (CLEM). By using fluorescent labels to highlight the objects of interest, we can determine which regions we should image at high resolution in the electron microscope. This can be performed at different stages of the process, either before preparation for electron imaging, or after resin embedding by using new “in-resin fluorescence” methods.
To make use of this additional information, our group at the Francis Crick Institute in London has developed custom miniature microscopes that allow us to image these fluorescent regions (2016 Wellcome Open Res. 1 26). The first microscope (now commercialized by RMC Boeckeler) attaches to the ultramicrotome to allow us to monitor the cutting process and collect only the slices of the sample that contain the fluorescent signal, thus limiting the number of slices that we need to load into the microscope for imaging. The second is a tiny device (less than 3 mm in diameter) that fits inside the SBF SEM and can monitor the fluorescent signal after each tiny sliver is removed. This allows us to identify which areas contain fluorescently tagged objects so that we only image those regions of interest, maximizing the useful information content of the data. These methods can drastically reduce both the data footprint, saving money on storage costs, and the associated complexity of the analysis, saving time.
Sometimes, of course, big data is unavoidable. It is not always possible to prepare samples in a form that is amenable for effective CLEM imaging, so there are times when we still have to deal with large amounts of data using brute-force processing. In these situations, manual annotation of the data is still the gold standard, and thus usually the preferred method, but the laborious nature of the work means that data is analysed much more slowly than it is acquired.
Sharing the load
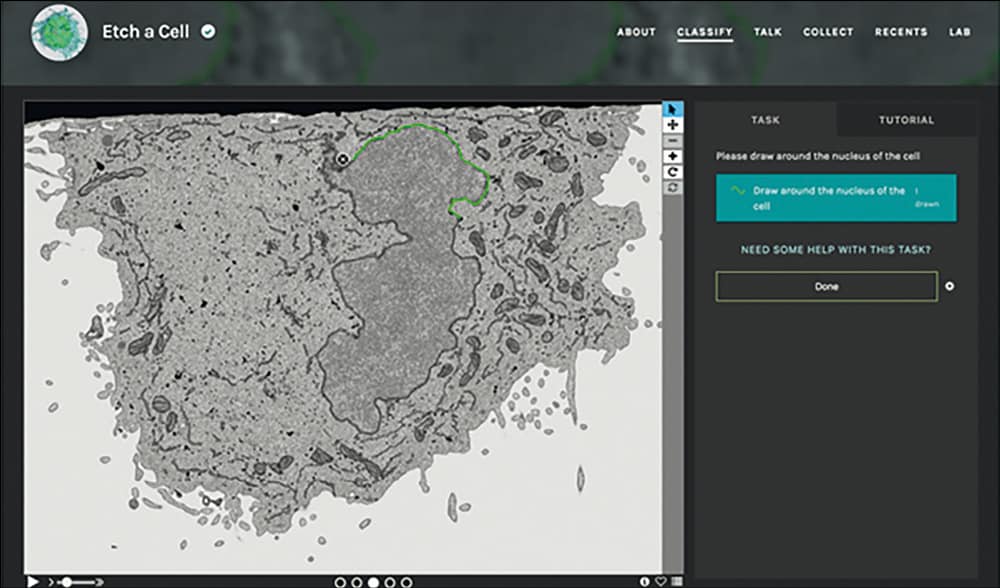
For certain structures, however, it is possible for a person with limited biological knowledge to be trained to recognize and trace over the desired objects where even the best computational methods struggle. This class of “human easy – computer hard” image processing problem is not unique to biology. Astronomers began applying “citizen science” methods to such problems in 2007, calling upon members of the public to help them classify their mountains of telescope images using a web-based project called Galaxy Zoo. This project has since grown into a platform called The Zooniverse that hosts many other citizen-science efforts – including one called Etch a Cell, which we built to enlist the public’s help with some of our segmentation tasks, tracing around the nuclear envelope in their web browser, as shown above. By aggregating the contributions from several citizen scientists for each slice of the data, we can construct annotations that are as accurate as ones performed by experts.
Of course, no discussion of big data is complete without mentioning machine learning, and this is certainly another area seeing rapid growth in biomedical imaging. Many deep-learning methods are well suited to image-analysis problems such as object detection and segmentation. Indeed, technologies like self-driving cars and robotics make extensive use of very similar image-processing methods. Several variants of supervised convolutional neural network architectures have proved very successful in automating biomedical image analysis.
There is, however, a bottleneck on the road to handing image-analysis tasks over to machines, and that is the “ground truth” data that are used to train them. Such data normally take the form of manual annotations, created by experts. Given the complexity of the images, we generally need enormous amounts of this training data to achieve good results, often much more than is readily available from experts. The aggregated annotations from our citizen scientists give us the dataset we need to train our system robustly on a wide range of images. Once well trained, a deep-learning system can produce image segmentations quickly. In principle, it could even be used to guide the electron microscope on-the-fly, so that it records only the interesting regions of images, even in the absence of a fluorescent beacon.
The principle behind all this work can probably be summed up with the old adage “Work smarter, not harder”. By viewing the big data problem beyond its purely computational aspects – that is, by combining new sample preparation techniques with custom-built hardware, in addition to new computational pipelines – we can reduce the effort and resources required for finding the needle in a haystack and significantly minimize both the strain on computational infrastructure and the analytical burden on researchers. Remember, the first rule of Big Data Club is, “Try not to get big data!”