Protons have an increased relative biological effectiveness (RBE) compared with photons. And for clinical treatments, the proton therapy community has adopted a constant RBE value of 1.1. RBE, however, is dependent upon many factors, including the deposited dose, the type of tissue being irradiated and the linear energy transfer (LET) of the beam. As such, use of this constant RBE value may lead to inaccurate predictions of clinical outcome.
To account for the effects of variable RBE, researchers have developed numerous RBE models, most of which are based on the linear-quadratic (LQ) model and use data from in vitro cell irradiation. Researchers from the University of Bergen and Haukeland University Hospital have analysed a range of these variable RBE models to explore their differences and similarities (Phys. Med. Biol. 63 185013).
“The number of published dose planning studies including variable RBE for protons is steadily increasing,” explains lead author Eivind Rørvik. “These studies provide important insight into RBE effects; however, most studies include only one or a couple of different RBE models, and these vary from one study to another. We saw the need for a general comparison of RBE predictions from the various models, and an analysis of why their predictions differ.”
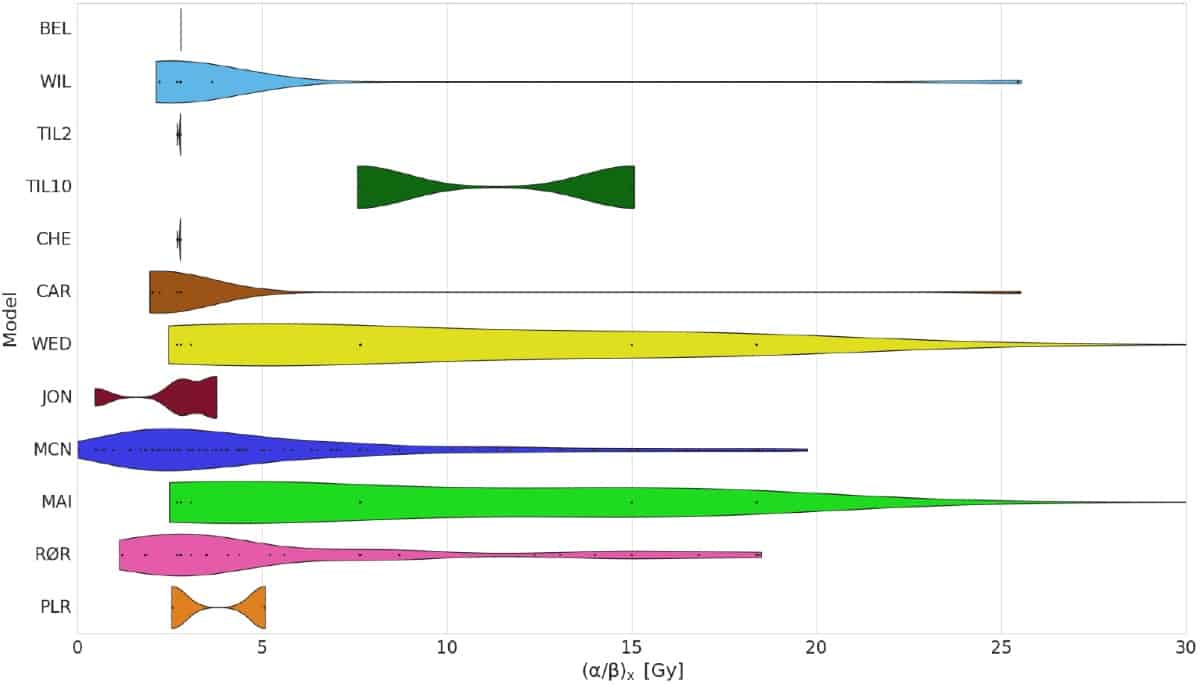
A literature search revealed 11 different phenomenological RBE models based on the LQ model and proton-irradiated cells. For comparison, the researchers also examined two plan-based models, which assume a linear dependence of RBE on dose-averaged LET (LETd). In particular, the team explored the different experimental data that the models were based upon, including cell-specific parameters such as reference radiosensitivity (α/β)x and physical quantities such as LETd.
The in vitro databases used to create the various RBE models differed greatly. Several experiments used V-79 (Chinese hamster lung) cells, which generally led to an (α/β)x value of 2–3 Gy. Other models, based on five to 33 cell lines, had a greater range of (α/β)x values. The range of LETd values used to derive the models also varied considerably.

To investigate the impact of these differences, Rørvik and colleagues simulated a spread-out Bragg peak (SOBP) in a water phantom using FLUKA Monte Carlo code. The plan was optimized to give a physical dose of 2 Gy across the SOBP. They then varied the physical dose and (α/β)x and evaluated the mean RBE calculated by the different models.
All models estimated a monotonous rise in RBE across the SOBP and an RBE of above 1.1 at the distal dose falloff region. One model gave a significantly higher dose than the others, while all but one of the cell-based models consistently estimated a higher RBE-weighted dose than the two plan-based models. In the entrance region, differences between the models were small, with the vast majority predicting RBE values below 1.1 until the proximal part of the SOBP.
Clinical cases
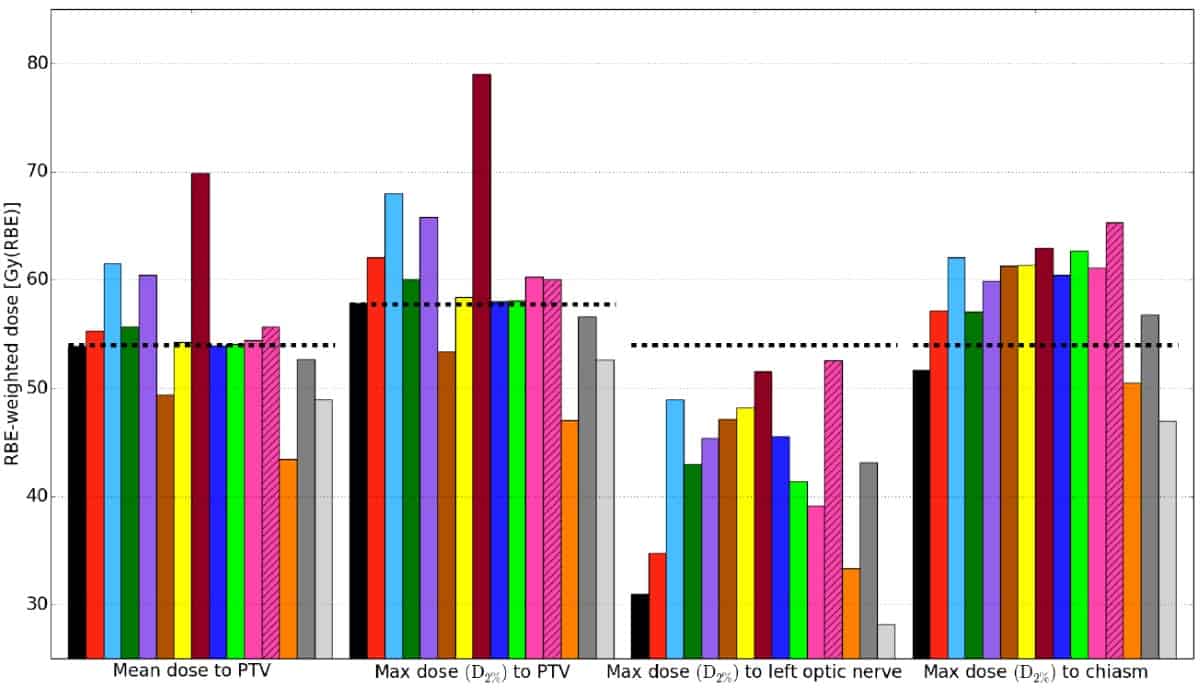
The researchers also analysed three patient cases: a prostate adenocarcinoma, a thoracic sarcoma and a pituitary adenoma. For each, they optimized proton therapy plans according to hospital protocols using an RBE of 1.1. They then recalculated the plans with the FLUKA Monte Carlo code using RBE values from the different models. Finally, they created and compared dose–volume histograms for planning target volumes (PTVs) and organs-at-risk.

Again, they observed large variations between estimates of RBE and RBE-weighted doses from the different RBE models — attributed to the considerable differences in experimental input data and model assumptions for the various models. The largest deviations between models appeared in organs exposed to low physical doses, with high LETd and low (α/β)x values. The greatest variation was seen for the pituitary adenoma case, where maximum dose to the left optic nerve ranged from 28–54 Gy(RBE), corresponding to RBE values of 1.0–1.9.
For all patient cases, the estimated mean RBE to the PTV was in the range 1.09–1.29. RBE-weighted doses estimated by the models met recommended dose constraints, except for the chiasm (which is located partly within the PTV) and right optic nerve in the pituitary case.
Looking ahead
The authors note that it is not possible to determine a superior model from this analysis, but suggest that a model could be selected for a specific clinical case based on the experimental database used to generate it.
“To choose one of the existing models for clinical treatment is perhaps a bit premature; but one of the simpler LET-weighting strategies could be a starting point to use alongside the conventional RBE of 1.1,” suggests Rørvik. “In such cases, one can directly identify and avoid hot spots resulting from specific combinations of LET values, without addressing the uncertainties associated with different tissues.”
The researchers are currently focusing on improving RBE models, including further analysis of previous in vitro experiments. “In our opinion, there is still room to reduce the uncertainties in the RBE modelling, both based on deeper analysis of existing in vitro data, but also by designing and performing new experiments specific for creating RBE models,” says Kristian Ytre-Hauge, leader of the University of Bergen group.
“We are also exploring different strategies to include RBE-based optimization in proton therapy planning,” Ytre-Hauge tells Physics World. “In addition, our group is currently implementing the proton beam line at UFHPTI in our FLUKA software, to correlate studies of variable RBE with follow-up data in patients treated with passive proton therapy.”


