This week’s Red Folder begins in Japan, where the 2011 disaster at the Fukushima nuclear power plant continues to cause misery for the 100,000 or so local people who still cannot return to their homes. But who is to blame? Writing in World Nuclear News, Malcolm Grimston of Imperial College London argues that radiation levels in much of the current exclusion zone are no higher than natural levels in other parts of Japan – and much lower than natural levels in some other populated regions worldwide. Grimston concludes that “an overzealous infatuation with reducing radiation dose, far from minimizing human harm, is at the heart of the whole problem”. His article is called “What was deadly at Fukushima?”.
A lack of trust in science and scientists is likely to be at the heart of the paradox that Grimston bemoans. I’m guessing that Japanese radiation experts are not keen on arguing for a return to safe parts of the Fukushima exclusion zone because no-one will listen to them. That is the sad message of an article in the Guardian, “Crisis, renewal and the prospects for science advice in Japan”. Written by two Japanese academics, the piece argues that “public trust in both science and policymaking was severely damaged” by the confusing and often conflicting statements from scientists and government officials in the wake of the 2011 earthquake and tsunami.
Perhaps many of the Fukushima evacuees would be back in their homes if officials had a better grasp of statistics. Promoting a better understanding of how to interpret data is one goal of a delightful website called Spurious Correlations, which takes a do-it-yourself approach to lampooning that age-old fallacy of assuming correlation is causation. Readers can select two sets of seemingly unrelated data, which are plotted together and the correlation is calculated. I chose “online revenue on Thanksgiving” and “the number of lawyers in West Virginia” and you can see the remarkable correlation of 0.99 here.
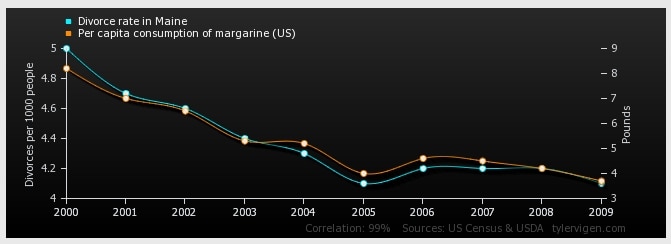
The site was created by US law student Tyler Vigen, who hopes it “fosters interest in statistics and numerical research”. My favourite correlation links the divorce rate in Maine to the per capita consumption of margarine in the US (see image above), which is also at 0.99.