A re-analysis of conflicting ocean-temperature records covering the past 15 years shows that the seas are getting warmer, according to an international team of scientists. The group compared a number of different published records and found that the discrepancies arise mostly from how different scientists corrected for the variable performance of early temperature probes.
Armed with this knowledge, the researchers were able to combine the data to obtain a more definitive record. Although the calculated warming of 0.64 ± 0.11 W/m2 is in line with other climate observations and global-warming predictions, the study does not explain why the records suggest that ocean warming has stalled since 2004.
Scientists have long known that the Earth’s oceans can absorb and release tremendous amounts of heat and therefore have a large effect on climate. However we know little about how ocean temperatures change on a decadal basis, which makes it hard to understand how oceans respond to climate change.
Expendable bathythermographs
Until about five years ago, most ocean temperature measurements were collected by expendable bathythermographs (XBTs) – devices that have been dropped from ships since the 1960s. XBTs are designed to sink at a known rate while measuring and transmitting the water temperature back to the ship via two wires.
However, there are two problems with XBT data. First, the probes were normally launched from ships on routine passages – and therefore missed out on much of the Southern Ocean and other less-travelled waters. Second, the design of the XBT has changed over the years, and researchers have discovered that some probes do not actually fall as expected. This means that temperature versus depth data could be flawed.
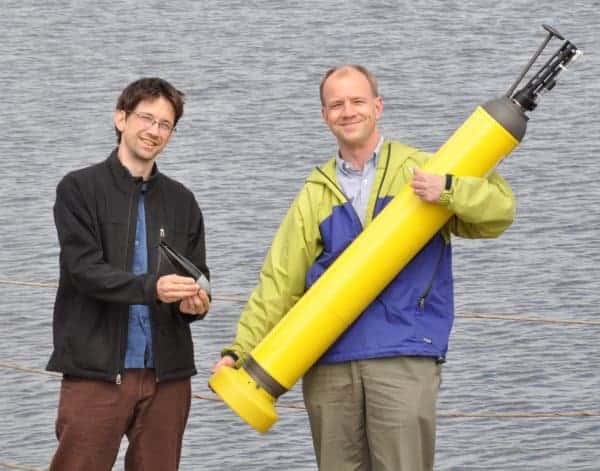
The situation improved in the early 2000s, when researchers began to deploy about 3000 “Argo floats”, which constantly gather temperature data at depths of up to 2000 m. Scattered throughout the oceans, the network of sensors was fully installed by 2007 thanks to a massive international effort.
Networked findings
An important challenge facing scientists is how to put all these data together to get a better picture of how the heat content of the entire ocean changes on decadal time scales. A number of different research groups have used different methods to create “upper-ocean heat content anomaly” (OHCA) curves, but these are not consistent with each other. For example, the curves do not seem to display the same year-to-year patterns. Indeed, during the 1997-98 el Niño climate oscillation in the Pacific Ocean, some curves show cooling, some warming and others no change.
Now, however, a team led by John Lyman of the National Oceanic and Atmospheric Administration (NOAA) in Seattle has taken a close look at these curves and has gained a better understating of why they differ from one another.
The team examined five different methods used to correct the XBT data, one of which is supposed to take into account slight changes in the shape of XBTs that could affect the OHCA curve. However, this correction is particularly difficult to make because the XBT type and manufacturer were not always recorded by users. Other studies tried to correct XBT data by comparing it with more reliable measurements such as Argo floats and conductivity, temperature and depth (CTD) probes.
‘Consistent’ with global warming
After gaining an understanding of the sources of uncertainty in each OHCA curve, the team was able to combine the data to obtain a curve that is more representative of global ocean temperature than its constituents. It reveals that the oceans have warmed at a rate of about 0.64 ± 0.11 W/m2 over the past 16 years. According to Kevin Trenberth of the National Center for Atmospheric Research in Colorado, this is “reasonably consistent with expectations from other indications of global warming”.
However, the re-analysis sheds little light on why ocean temperatures appear to have remained steady since about 2004. This is at odds with satellite measurements, which suggest the Earth has continued to heat up over the past six years, leading to questions over where the “missing heat” has gone.
Indeed, Stefan Rahmstorf, a climate scientist at Potsdam University near Berlin, says that the new study does solve this problem. “The accuracy of measurements is still not sufficient to close the energy budget particularly for short-term variations, in other words, over a few years, as associated with El Niño”.
Team member Doug Smith of the Hadley Centre in the UK points out that this stalling seems to occur just when the Argo floats became the primary data source. This could mean that further work is needed on how to interpret Argo results and how to integrate them into temperature records.
Argo data could also help scientists build a better picture of past ocean temperatures by revealing relationships between temperatures in regions where there is good historical data and parts of the oceans where there is not. Smith told physicsworld.com that he plans to exploit such relationships to fill gaps in the data back to 1950 and perhaps even earlier.
The work is reported in Nature 465 334.


