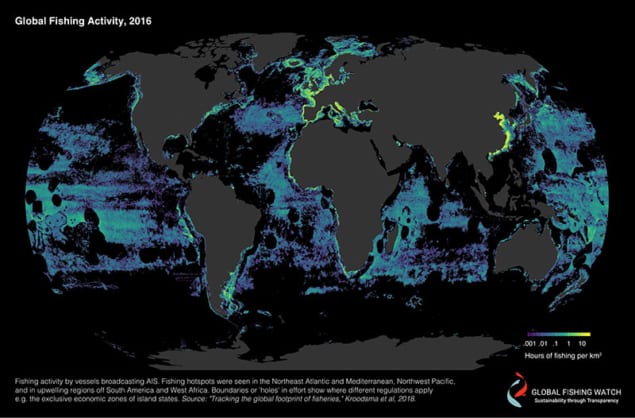
Industrial fishing covers more than 55% of the ocean’s surface – over four times the area covered by agriculture. That’s according to a team who used ship tracking technology, satellite feeds and machine learning to create a high-resolution dataset.
The analysis looked at 70,000 vessels, including more than three-quarters of the world’s industrial fishing ships larger than 36 m. The dataset is freely available.
“By publishing the data and analysis, we aim to increase transparency in the commercial fishing industry and improve opportunities for sustainable management,” said David Kroodsma of Global Fishing Watch, a collaboration between Google, Skytruth and Oceana.
The dataset provides greater detail than previously possible about fishing activity on the high seas, beyond national jurisdictions, according to a press release from Global Fishing Watch. While most nations appear to fish predominantly within their own exclusive economic zones, China, Spain, Taiwan, Japan and South Korea account for 85% of observed fishing on the high seas.
“This dataset provides such high-level resolution on fishing activity that we can even see cultural patterns such as when fishers in different regions take time off,” said Juan Mayorga of the National Geographic Society’s Pristine Seas project and the University of California Santa Barbara, US. “Data of this detail gives governments, management bodies and researchers the insights they need to make transparent and well-informed decisions to regulate fishing activities and reach conservation and sustainability goals.”
The figure of 55% is likely to be an underestimate as some regions have poor satellite coverage and some exclusive economic zones have a low percentage of vessels that use automatic identification systems (AIS).
“This study reveals fishing as an industrial process in which vessels operate more like floating factories that need to operate around the clock to make money,” said Boris Worm of Dalhousie University, Canada. “On the upside, however, this dataset also shows clearly where management boundaries are in place and where they are helping to constrain fishing effort.”
The researchers used machine learning to analyse 22 billion messages broadcast from AIS from 2012–2016. These revealed the vessels’ movement patterns, enabling the team to identify more than 70,000 commercial fishing vessels, the size of their engines, the type of fishing they were conducting, and where and when they fished to the nearest hour and km.
“Only a few years ago, we didn’t have the computing power, enough satellites in orbit, or techniques to run machine learning at scale over massive datasets,” said Brian Sullivan of Google Earth Outreach. “Today we have all three, leading to dramatic advances in our ability to monitor and understand human interaction with our natural environment.”
The team reported their findings in Science.


