Non-invasive image-based methods for quantifying changes in tumour growth have been under investigation for years. Using the latest advances in imaging and computing, Johns Hopkins Medicine researchers have developed a framework that’s able to reveal the structural and functional changes in the blood vessel network required for growth of a tumour.
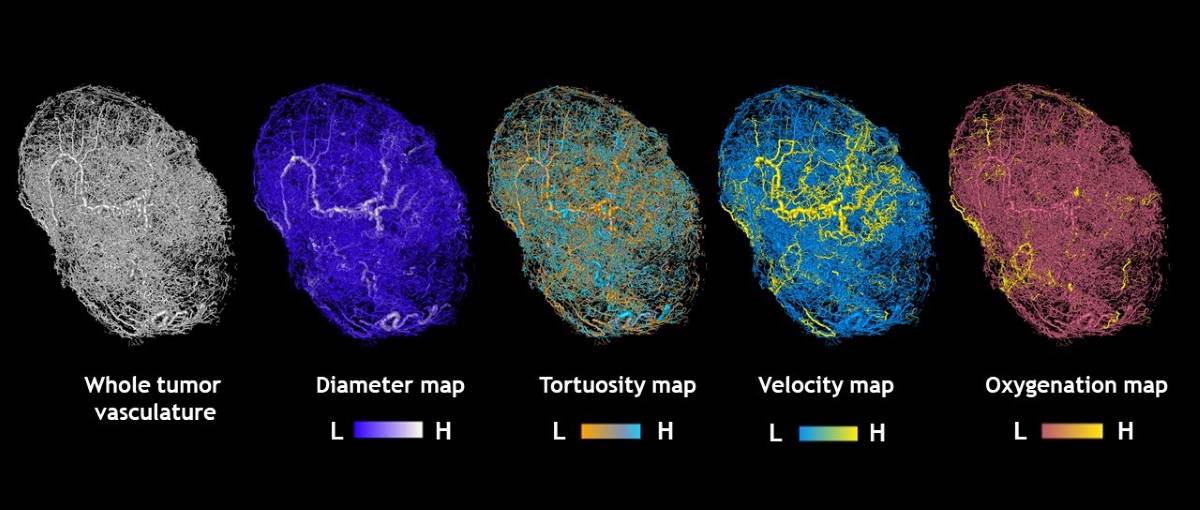
The team used high-resolution 3D imaging of tumour blood vessels paired with sophisticated mathematical formulae to generate a model framework. The model represents the microenvironment of tumour tissue, including the flow of blood and oxygen, the complex blood vessel network and structural changes occurring over time (Nature Sci. Rep. 10.1038/s41598-019-40888-w).
The image-based model
To create a model that reflects the structural and behavioural aspects of tumour growth, Eugene Kim from Arvind Pathak‘s research team implanted human breast cancer cells in mice. Those cancer cells grow into tumours that the researchers imaged using 3D magnetic resonance microscopy and micro-CT to create high-quality 3D images with information about tumour’s volume and the network of its blood vessels.
Once the underlying vascular network had been mapped, the researchers next considered how to quantify the functional characteristics of these tumour vessels. They then searched for previously published data on blood flow/pressure and volume in blood vessels similar to those seen in their tumours. To understand how these structures would behave in a living system, Pathak’s team collaborated with Aleksander Popel‘s Systems Biology group at Johns Hopkins.
Spyros Stamatelos from Popel’s group created a set of graph theory formulae to represent various aspects of the tumours and developed a model to describe blood and oxygen flow by combining their data with information already published in the scientific literature. This work was continued by Akanksha Bhargava who made the final classification and integrated the images with the simulation results.
Google Maps for cancer
The researchers suggest that the visualizations resulting from these simulations can be described as “Google Maps for cancer”, since they work in a similar fashion. Google Maps shows geographical maps superimposed with useful information such as speed limits, average speed, travel time and traffic activity. Likewise, these tumour models generate hundreds of thousands of data points about the predicted blood flow and oxygenation in tumours and superimpose these data on the blood vessel architecture.
The researchers believe that their image-based computer model will add further details to the growing “atlas” of cancer, a collection of information useful for documenting the disease, and from which artificial intelligence can be used for applications ranging from predicting drug delivery to tumour behaviour. Access to the finer details of tumours will help bioengineers and cancer biologists develop and test in silico applications such as drug targets. The model can be also used to understand the complexities of other tissues (for example, heart and brain) and related diseases such as cardiac arrest and stroke.
While this approach is not applicable directly to studying cancer growth in humans, the researchers are hopeful that as high-resolution tumour imaging in patients improves, their tools can be used to detect signs of cancer at earlier stages, predict the behaviour of cancer and customize the therapy to the patient.