Monitoring forests provides important clues to the health of our planet. Comparing sequences of satellite images can reveal change across large geographic areas over time. Field measurements add to this by highlighting forest growth or decline from the ground up. But what’s the most efficient way of linking these data together to complete the picture?
To monitor live forest carbon at broad scales, researchers in the US have developed an empirical approach that mixes field data, statistical modelling, remotely sensed time-series imagery and small-footprint lidar. The technique was prototyped on portions of Oregon and California – a study area that contains some of the most carbon-rich conifer-dominated forests in the world.
The group’s output shows that human activities control biomass removal in most years. It also highlights that fire can shift forest systems strongly into carbon loss.
“Our goal here was to connect the measurements on the ground with the measurements from space in a way that leverages the strengths of both approaches,” said Robert Kennedy of Oregon State University.
Landsat satellites have captured images of our planet from space for decades, providing researchers with views of the forest canopy from above. But these data only tell part of the story, particularly when it comes to quantifying the amount of biomass.
“Forests grow up, and generally the taller the forest, the more carbon is there, especially in the kinds of evergreen needleleaf forests that dominate much of the study area we examined,” said Kennedy.
It’s difficult to monitor this vertical dimension from above, which is why it’s still necessary to go into the forest and measure trees. But performing such a forest inventory and analysis (FIA) is time-consuming and expensive, so it’s only conducted at sample locations rather than across the whole landscape.
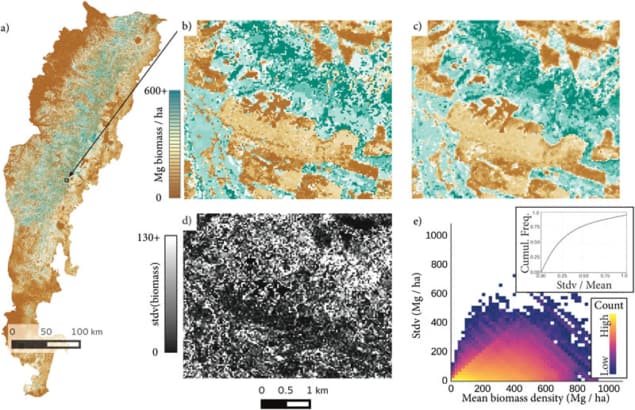
To enrich the data, the team used a gradient nearest neighbour method, which begins by converting satellite imagery into values that represent the environmental conditions of the landscape. “Once we have defined the numbers that describe what the trees experience, we can link those numbers to the FIA plots with rich information that field crews have painstakingly measured on the ground,” said Kennedy.
Put simply, it means that the group can meaningfully apply the field data – a gold standard – across the entire landscape to generate much more detailed biomass estimates. The downside is that each satellite pixel, which represents an area of around 30 m2, could be assigned information from an FIA plot that may be far away in real life. It’s a balance that the researchers are dialing into their analysis.
“Somewhere in between the pixel and the whole study area is a sweet spot of accuracy and usability, and we continue to work on the best ways to find that sweet spot,” added Kennedy. “It’s not perfect, but the statistical methods we used seemed to go a long way toward painting a good picture of what’s happening on the ground.”
Encouraged by the system’s success in tracking higher biomass forests, the researchers are extending their approach. “We’re keen to see how these stories evolve as we expand to the rest of Washington, Oregon, and California,” said Kennedy. “The extension promises to be interesting because we’ll be including many more forests that are dry and affected by fire and insects, so we’re curious to see whether the relative impacts will change.”
A full description of the monitoring framework, including a flow-chart of the analysis pathways, can be found in Environmental Research Letters (ERL).


