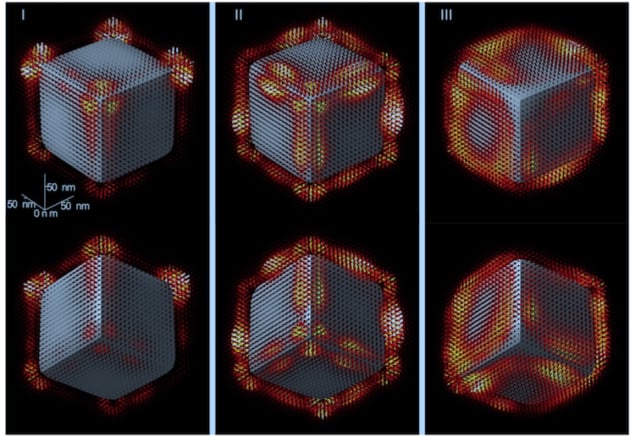
The first three-dimensional map of the electromagnetic field that “clings” to the surface of a cube less than 200 nm across casts a fresh light on how materials dissipate heat at the nanoscale. The images, obtained by researchers in France and Austria, reveal the presence of infrared photon-like excitations known as surface phonon polaritons near the cube’s surface – a phenomenon that might be exploited to convey waste heat away from nanoelectronic components and so cool them down.
Phonons are particle-like collective vibrational excitations (or atomic vibrations) that occur in ionic solids. They give rise to oscillating electric fields, which couple with photons at the surface of the solid to create surface phonon polaritons (SPhPs). These hybrids of vibrational and photonic excitations are found only on an object’s surface and are thus typically of little importance in bulk materials. However, their influence dramatically increases as objects shrink and their surface-to-volume ratio increases.
SPhPs also concentrate electromagnetic energy in the mid-infrared (3 to 8 mm) up to the far-infrared (15 to 1000 mm) wavelength range. This property might make it possible to use them in applications such as enhanced (Raman) spectroscopy of molecules.
Visualizing the near field
All such applications depend on the nanostructured electromagnetic field that exists at the surfaces of metamaterials or nanoparticles. Visualizing this so-called near field has, however, proved difficult. Pioneering techniques like electron energy loss spectroscopy (EELS), which works by measuring the energy electrons lose when they encounter these surface fields, can only produce 2D outlines. Other techniques use sophisticated reconstruction algorithms in combination with EELS to generate 3D images of the field, but these were previously restricted to visible wavelengths.
In the new work, Mathieu Kociak and colleagues from the CNRS/Université Paris-Saclay, together with Gerald Kothleitner of Graz University of Technology, combined computer models with a technique called tomographic EELS spectral-imaging to image the 3D field surrounding a nanocrystal of magnesium oxide (MgO). To do this, they used a new-generation scanning-tunnelling electron microscope (STEM) developed for electron and photon spectromicroscopy that can probe the optical properties of matter with ultrahigh energy and spatial resolution. The instrument (a modified NION Hermes 200 called a “Chromatem”) filters a 60-keV electron beam with a monochromator to produce a beam with an energy resolution of between 7 to 10 meV.
Tilting technique
By scanning this electron beam across their sample, Kociak, Kothleitner and colleagues collected high-angle annular dark field images that revealed the shape of the MgO nanocube. They then tilted the sample at various angles, imaged the cube in different orientations and recorded an EELS spectrum at each scan position. Finally, they used image reconstruction techniques to generate 3D images of the field surrounding the crystal.

Surface phonon polaritons boost heat transfer
The new approach, which they describe in Science, will eventually make it possible to target specific points on the crystal and measure localized heat transfer between them. Since many nano-objects absorb infrared light during heat transfer, the technique should also provide 3D images of such transfers. “This is one avenue of exploration for optimizing heat dissipation in the increasingly small components employed in nanoelectronics,” the researchers say.
The team now plans to apply its technique to study more complicated nanostructures. However, Kociak tells Physics World that “some theoretical aspects still need to be better understood” before this is possible.


