Why certain liquids turn blue when cooled was a mystery that stumped scientists for more than a century. As Oliver Henrich and Davide Marenduzzo explain, solving the secret of the “blue fog” proved to be an intellectual tour de force – and one that could lead to new types of display devices
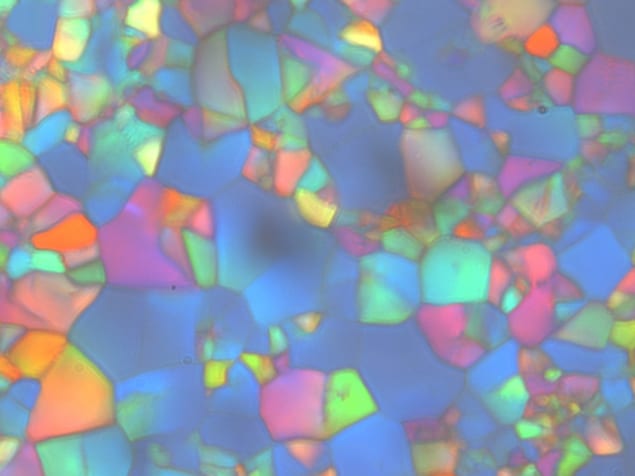
In his Prague lab in the late 1800s, the Austrian botanist Friedrich Reinitzer was studying a substance called cholesteryl benzoate (C34H50O2) when he discovered something odd. The stuff was solid at room temperature and, as Reinitzer applied heat, it melted at 145.5 °C to form a cloudy fluid and then, above 178.5 °C, turned completely clear. As if that wasn’t puzzling enough, when the transparent liquid cooled, rather than reverting to the cloudy liquid as one might expect, it first turned blue and then violet. Confused, Reinitzer wrote to Otto Lehmann, a German physicist in Aachen, to see if he could confirm and explain these mysterious observations.
Lehmann concluded, with the aid of an advanced microscope, that the cloudy liquid Reinitzer had seen was a new kind of matter that could flow, like a liquid, yet contained microscopic crystals, like a solid. Lehmann named the substance a “liquid crystal” – a term that has stuck ever since. We now know there are several types of liquid crystal, the simplest of which consists of rod-like molecules that line up in parallel. These “nematic” liquid crystals are used in countless laptop, computer and smartphone screens, underpinning a multi-billion-dollar display industry.
In the 1920s the French crystallographer Georges Friedel discovered that the cloudy liquid that Reinitzer had seen was a “cholesteric” liquid crystal, in which the rod-like cholesteryl-benzoate molecules are arranged in layers. Although the rods can move freely in 3D, they always point along a common axis, with this axis pointing in a direction that twists by a small angle as you go from one layer to the next. As for the blue liquid, in time it was discovered that there are three blue phases – dubbed I, II and III – each with its own microscopic structure. Reinitzer had seen them all, but being unable to fine-tune the temperature of his primitive lab equipment, he could not stabilize or study the different phases.
The properties of each phase remained a mystery for decades and it was not until the 1980s that researchers eventually identified the intricate molecular structures of two of the blue phases – I and II. Discovering the inner workings of these phases required beautiful analytical and numerical research, notably by groups led by Shmuel Shtrikman at the Weizmann Institute of Science in Israel and James Sethna at Cornell University in the US. But the properties of blue phase III – dubbed the “blue fog” – left scientists stumped.
Making inroads
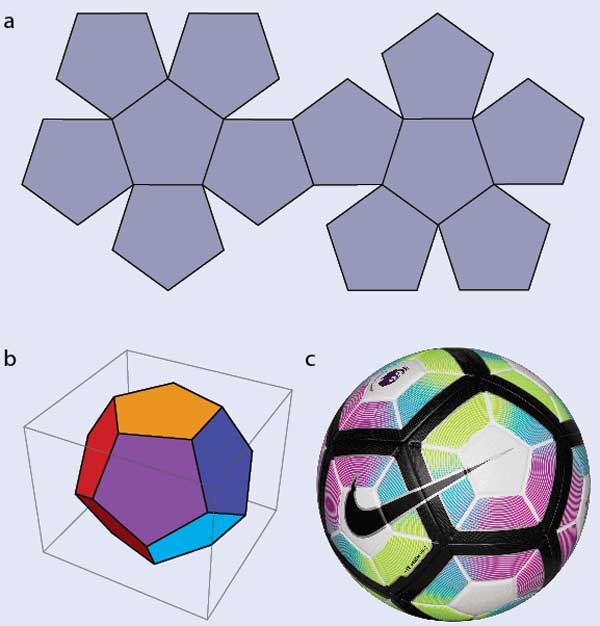
Understanding blue liquid-crystal phases requires first grasping some key concepts. Let’s start with a seemingly unrelated problem: how to tile your bathroom or kitchen floor. Square or rectangular tiles are simple and will do the job nicely, and hexagonal tiles would too. Pentagonal tiles, however, are a complete non-starter: there’s no way to arrange them on a flat surface without leaving gaps (figure 1a). In 3D, it’s a different story: pentagons can form a dodecahedron (figure 1b) and, if you let them curve slightly, a 2017 Premier League football (figure 1c.). If you tried to make a football from hexagons, however, you’d find that you need to add pentagons where the hexagons don’t meet.
Unsuccessfully trying to tessellate shapes, such as pentagons on a flat surface or hexagons on a sphere, is dubbed geometrical or topological “frustration” and it leads to defects where the shapes don’t fit together nicely. The same phenomenon is also found in liquid crystals. While most liquid-crystal molecules are locally aligned within their layers, there are regions where the local direction of the molecules is undefined. At these “topological defects”, the molecules point all over the place. Example defect structures include the hedgehog, the vortex, the central ridge field and the triradius (figures 2a–d). You can see similar patterns in your own fingerprints: the friction ridges on your finger align locally but there are also features, such as deltas and cores, where the ridges point in many directions, meaning that the underlying physics (and patterns) are broadly the same.
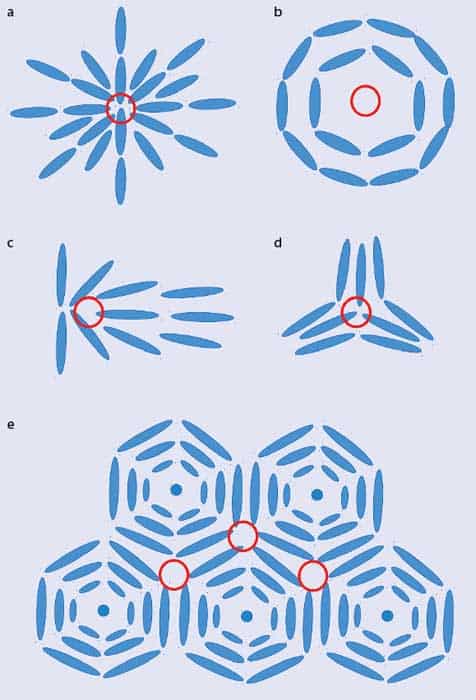
To understand the blue phases, as opposed to regular phases of liquid crystals, requires one more step. Liquid-crystal molecules can form blue phases only if they are “chiral” – in other words, they don’t look the same as their mirror image. It was pure coincidence that cholesteryl benzoate, which Reinitzer was studying, was not only the first liquid crystal to be observed but also cholesteric. But whereas a standard cholesteric liquid crystal has a twist along a single axis, in a blue phase the twist can be along many different directions. Figure 2e, for example, is a schematic 2D representation of “double-twist cylinders”, in which the twist of the molecules is around two different directions.
The key point is that a parallel array of double-twist cylinders doesn’t properly fit together. Instead, like pentagons on a bathroom floor or hexagons on a sphere, the cylinders show frustration and defects appear between them, often as triradii. It’s an energetically unfavourable situation because the material isn’t in its lowest possible energy state. Forming double-twist cylinders is simply a case of making the best out of a bad job.
A structure such as the array of double-twist cylinders in figure 2e, which has a uniform 2D cross section, is useful to explain the origin of blue phases but in practice it forms only if there’s a strong enough electric or magnetic field. Under normal conditions, blue phases I and II have the cylinders arranged in 3D. In blue phase I, the resulting symmetry is that of a simple cubic lattice, and in blue phase II that of a face-centred cubic lattice. The materials are so vividly coloured because the lattices’ unit cells are each roughly the same size as the wavelength of visible light, giving rise to interference and diffraction patterns.
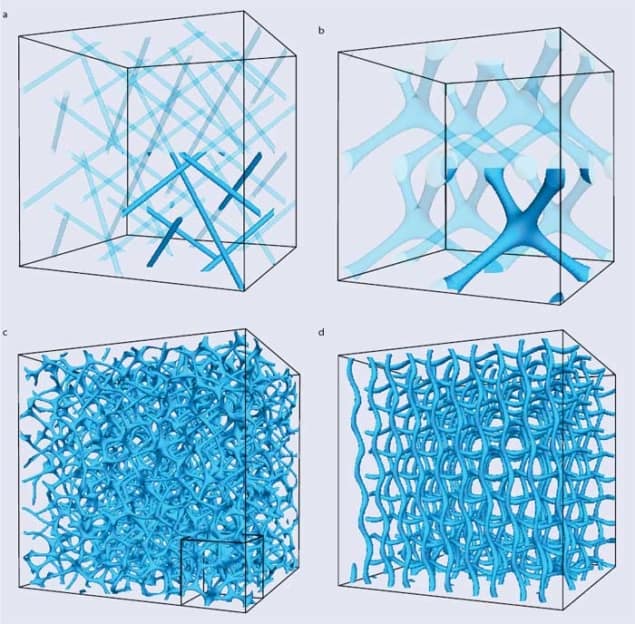
As drawing the orientation pattern of all molecules in 3D would be messy, we visualize blue phases by showing either the pattern of double-twist cylinder packing, or the defects only. The latter choice leads to visually striking patterns: the defects join up in lines to form “disclinations”. In blue phase I (figure 3a) these disclinations avoid each other, whereas in blue phase II they merge to form four-fold junctions (figure 3b). Such junctions are complex defects, and theory suggests that they are the weakest point of the blue phase II network, being first to rupture if the sample is subject to an external flow or an electric field.
Lifting the fog
By the late 1980s blue phases I and II were well understood, but the properties of blue phase III (the blue fog) still remained elusive. There were clues to its structure but no proof, and by the late 1990s research into this phase of matter was losing steam. To the rescue came supercomputers. Researchers had started developing powerful algorithms that could reveal how liquid-crystal molecules arrange in space, helped in part by the growth of parallel computing, which allows complex calculations to be more easily carried out. Various groups specializing in simulations of soft condensed-matter systems started returning to the old blue phases, including those led by Julia Yeomans at the University of Oxford in the UK, Slobodan Zumer at the University of Ljubljana in Slovenia, and ours in Edinburgh.
They realized that computers are ideal tools for studying blue phases, which have such intricate 3D structures that old-fashioned paper-and-pencil calculations are too cumbersome to yield answers. Indeed, the disclination networks in figures 3a–b come from large-scale simulations of blue phases I and II. Interest in the blue phases was also rekindled by potential technological applications as well as the fact that they could now be stabilized over a wide range of temperatures.
Over the last decade, computer simulations have revealed a potential candidate structure for blue phase III. As we reported in a paper published in 2011 with our Edinburgh colleagues Kevin Stratford and Mike Cates (now at Cambridge), once seeds for double-twisted cylinders were planted in an isotropic background, they grew to form amorphous networks such as that in figure 3c (Phys. Rev. Lett. 106 107801). The structure was deemed a candidate for the blue fog because it arises spontaneously from a physically plausible initial condition, and appears in the right part of the phase diagram where experiments typically observe blue phase III.
The amorphous network had additional features that further reinforced the possible link to the blue fog. First, our simulations showed it was very stable, rearranging very little even over several milliseconds. Second, its free energy was lower than that of other cubic blue phases, or indeed any other regular structures to have been proposed. The stability and low free energy of the structure we found was surprising because window glass – the archetypical amorphous material – is metastable, with the true equilibrium state being a regular crystal. Blue phase III, instead, may be a very rare example of a thermodynamically stable glassy material. A final intriguing feature of the proposed amorphous network was that it becomes ordered in the presence of an electric field, just as blue phase III does in reality, transforming into the more regular network seen in figure 3d.
Confirmation and memory
It was all well and good to have simulations suggesting that the blue fog is an amorphous network of defects, but what researchers really needed was experimental verification. However, observing the disclinations directly seemed an impossible goal given that these defects are about 10 nm thick and optical microscopes can resolve distances down only to about 200 nm. Fortunately, experimentalists had a trick up their sleeve. By mixing long-chain polymer molecules equally throughout the blue phase, they realized they could cover up the network of disclinations. As the defects are the most energetically costly parts of a liquid crystal, eliminating them stabilizes the material by lowering the overall energy of the system. That, in turn, allows all three blue phases to be studied over a much wider range of temperatures – as much as 60 °C rather than 1 °C.
Researchers in Liang-Chy Chien’s group at Kent State University in the US then realized that if they could wash away the liquid crystals in a polymer-stabilized blue phase III, they’d end up with a polymer scaffold that retains a “memory” of the original disclination. They could then use, say, a scanning electron microscope to view this network and see the defects. In practice, Chien and his group didn’t add polymers directly but instead added small molecules that they then fused together with light to create long chains. The resulting images were qualitatively consistent with the simulated network and confirmed that the blue fog is an amorphous network of disclinations.
As a bonus, the experimental technique for creating the scaffold is technologically useful. If it’s refilled with a non-chiral liquid crystal, the resulting sample becomes like the blue fog. The scaffold causes the liquid-crystal molecules to recreate the orientation pattern of the original blue phase. This imprinting is useful as it can occur outside the temperature range for which the blue fog was initially stable.
Liquid crystals are used mainly in technology for display applications, where the ability to switch between two different phases is used to let light through, or not. Applying an electric field to the refilled scaffold with the blue fog state creates a field-induced state, in which the molecules all lie along the field direction and let light through. In principle, switching between the two states can be done in barely a few milliseconds – faster than for common liquid-crystal devices based on the simpler nematic phase.
Korean hi-tech giant Samsung Electronics once showcased a blue-phase liquid-crystal-display (LCD) panel at the Society for Information Display’s 2008 international symposium, seminar and exhibition in Los Angeles. Although that first prototype did not move into production, some novel designs have recently been proposed. Blue phase III-based displays offer great promise for future devices, possibly sooner than we might think. So is the mystery of the blue fog over? Yes, at least partly, with Chien and collaborators’ work strongly pointing to it having an amorphous disclination network structure. But questions remain. Can we use polymer scaffolding to view the structure that the blue fog morphs into under a field to see how it compares to predictions from simulations? More fundamentally, can experiments reveal more about the mechanism that creates the amorphous fog network? The story of the blue fog may not, after all, be quite over yet.
