The good old days
By Hamish Johnston
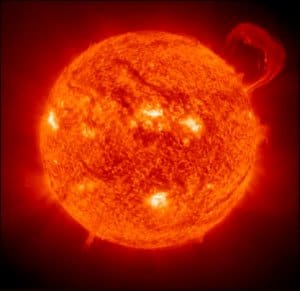
The Sun normally follows an 11-year cycle — waxing and waning in terms of its power output and the number of solar flares and sunspots at its surface.
But our star seems to be stuck in a slump — it should have hit a minimum in 2007-8 and should now be climbing rapidly to its next maximum in about 2013.
Despite a few false starts towards increased activity, the Sun is “bumping along the bottom”, according to solar physicist Mike Lockwood of Southampton University who was on BBC Radio 4 this morning.
You can listen to the interview here.
Lockwood pointed out that the power output of the sun is at a “record low”, but added that we shouldn’t expect a new ice age because solar power fluctuations are measured in hundredths of a percent.
Although solar output is expected to have some effect on Earth’s climate, Lockwood said that exactly how and why is currently a topic of debate.
Beyond the effects of fluctuating power output, some researchers have proposed more complex mechanisms of how solar cycles could affect climate. Perhaps the most controversial links the solar cycle to cloud production on Earth via cosmic rays. You can read critical discussions of this theory in this news story and this book review.
This current slump is nothing compared to the “Maunder minimum” — a 70-year stretch beginning in 1645 during which very few sunspots were seen. Lockwood says that there is some evidence that this slump had some effects on regional weather.
It’s interesting to note that the Maunder minimum seems to coincide with “The Little Ice Age” — a noticeable cooling that affected Europe, North America and perhaps other parts of the world.
Looking further back, it seems that such long-term minima occur about once every few hundred years. It would be tempting to think we are moving towards such a minima — but excepting the past few years, we seem to be in the middle of a long-term maxima.
The Solar Influences Data Analysis Center at the Royal Observatory of Belgium has a nice presentation of solar activity data here. Although the latest cycle does seem to be a bit longer and dip lower that the previous few, it doesn’t seem that out of line.
The site also has a ticker-tape style solar forecast — which is “quiet” on all fronts.


