Meeting of minds: Sir John Enderby (right) was Felix James’ perfect physics tour guide. (Courtesy: Felix James)
By Felix James, a student on a work-experience placement with IOP Publishing
If you live in the UK, you are probably aware that at this time of year many school students are asked to do some kind of work experience. Teenagers like me find a placement we are interested in and then go there for a week – rather than school – to get a taste for what work is really like. For me this meant a week at IOP Publishing, which publishes Physics World, but it included an excellent tour of the physics department at the nearby University of Bristol.
The silent flight of owls could help suppress aircraft and turbine noise. A team from Chiba University in Japan has studied the unique features of owl wings that allow them to fly noiselessly.
The wings of these nocturnal creatures feature serrations on the leading edge, fringes on the trailing edge and velvet-like surfaces. Focusing on the serrations, Hao Liu and colleagues analysed owl-inspired feather wing models with and without the comb-like features to understand the role they play in noise suppression. “We wanted to understand how these features affect aerodynamic force production and noise reduction, and whether they could be applied elsewhere,” says Liu.
Wind-tunnel experiments
To study how air flows around an owl’s wing, the researchers used computational simulations, particle-image velocimetry (PIV) and wind-tunnel experiments. They found that the leading-edge serrations passively control the transition between streamline and turbulent air flows over the wings. At shallow wing angles, however, Liu and team also discovered there is a trade-off between force production and sound suppression, as the serrated edge reduces aerodynamic performance.
The team hope the work, published in Bioinspiration and Biomimetrics, may have industrial applications. “These owl-inspired leading-edge serrations, if applied to wind-turbine blades, aircraft wings or drone rotors, could provide a useful biomimetic design for flow control and noise reduction,” explains Liu, “At a time when issues of noise are one of the main barriers to the building of wind turbines, for example, a method for reducing the noise they generate is most welcome.”
A new nanostructured flat surface that appears like a 3D object – complete with realistic light shading and shadows – has been developed by Alexander Minovich, Anatoly Zayats and colleagues at Kings College London and the Rheinische Friedrich-Wilhelms-Universität Bonn. The optical illusion relies on a computer-graphics technique called “normal mapping”, which creates 3D objects with realistic lighting effects on a 2D display.
The surface comprises a gold film 180 nm thick that is covered with a 105 nm layer of magnesium fluoride. Squat rectangular pillars of gold 30 nm tall are arranged in an array on the surface of the magnesium fluoride, which acts as a transparent spacer between the gold film and the pillars.
Shadow and contrast
Normal mapping was then used to compute the orientation of each pillar so that light reflecting from the surface appears as a cube (see figure). What is more, when the surface is illuminated or viewed from different angles, the cube appears to have the appropriate shadow and contrast.
Potential applications of the surface include optical security features on banknotes and other objects prone to counterfeiting. “The normal mapping demonstrated with our metasurface is a completely new concept, but it could have very important implications for a wide range of optical industries, both in introducing new functionality and making products smaller and lighter,” says Minovich.
Helium ions have been used to image viruses attacking bacteria. These bacteriophages viruses represent a possible alternative to antibiotics for treating bacterial infections.
Typically, microbial interactions are imaged using electron-based methods, such as scanning electron microscopy – where an electron beam is rapidly scanned across a sample and the scattered secondary electrons are measured to form an image of the surface. However, these techniques have had limited success when it comes to imaging the interaction between bacteriophages and bacteria. The methods are restricted by resolution limits and require the samples to be covered in a conductive coating, which can lead to loss of both resolution and detail of the smallest sample structures.
A team from the University of Jyväskylä in Finland has therefore turned to helium-ion microscopy. The technique resembles scanning electron microscopy in that the beam is scanned and secondary electrons form an image – but rather than firing electrons at the sample, it uses helium ions.
Ilari Maasilta and colleagues found the technique offered higher resolution and depth of field because of the much heavier mass of helium ions compared to electrons. The method also worked for irregular sample substrates and did not require the samples to be coated.
The team was able to produce high-resolution images of bacteriophages–bacteria interactions at different stages of infection, and also demonstrated the feasibility of using neon and helium milling techniques to reveal subsurface structures.
The first detection of a baryon containing two charm quarks has been made by physicists working on the LHCb experiment at the Large Hadron Collider (LHC) at CERN. Weighing in at 3621 MeV, the Ξ++cc particle has about the same mass as a helium-3 nucleus. Although the particle – which also contains an up quark – is predicted by the Standard Model of particle physics, its discovery and subsequent study should give important information about how to calculate the properties of particles made up of quarks.
Baryons are particles with three quarks and include the familiar proton and neutron (comprising up and down quarks) as well as more exotic particles that can contain charm, strange and bottom quarks. Quarks interact via the strong force and this is described by the theory of quantum chromodynamics (QCD). However, the nature of the strong force makes it extremely difficult to calculate the properties of baryons using QCD.
Finding a doubly heavy-quark baryon is of great interest as it will provide a unique tool to further probe QCD Giovanni Passaleva, LHCb
Binary star
The internal structure of Ξ++cc can be imagined as a planet (the relatively low-mass up quark) orbiting a binary star (the two much heavier charm quarks). According to LHCb’s newly appointed spokesperson Giovanni Passaleva, this configuration makes it relatively straightforward to use the various QCD calculation schemes to work out the mass and other properties of Ξ++cc. Comparing these calculations to measurements made at the LHCb should allow physicists to improve how QCD calculations are done.
“Finding a doubly heavy-quark baryon is of great interest as it will provide a unique tool to further probe QCD,” says Passaleva. “Such particles will thus help us improve the predictive power of our theories.”
The Ξ++cc was created in proton collisions in both the 7 TeV and 13 TeV runs of the LHC. It was identified in the LHCb via its decay into a Λ+c baryon and three lighter mesons: the K–, π+ and π+. The statistical significance of the measurement is far in excess of 5σ, which is the “gold standard” for a discovery in particle physics.
Lifetime and decay
Passaleva says that the LHCb team now wants to take a closer look at how the Ξ++cc is produced in the LHC, as well as examine the particle’s lifetime and decay mechanisms. He points out that LHCb is eminently suited for this task because it is designed to make very precise measurements of the particle decays of interest.
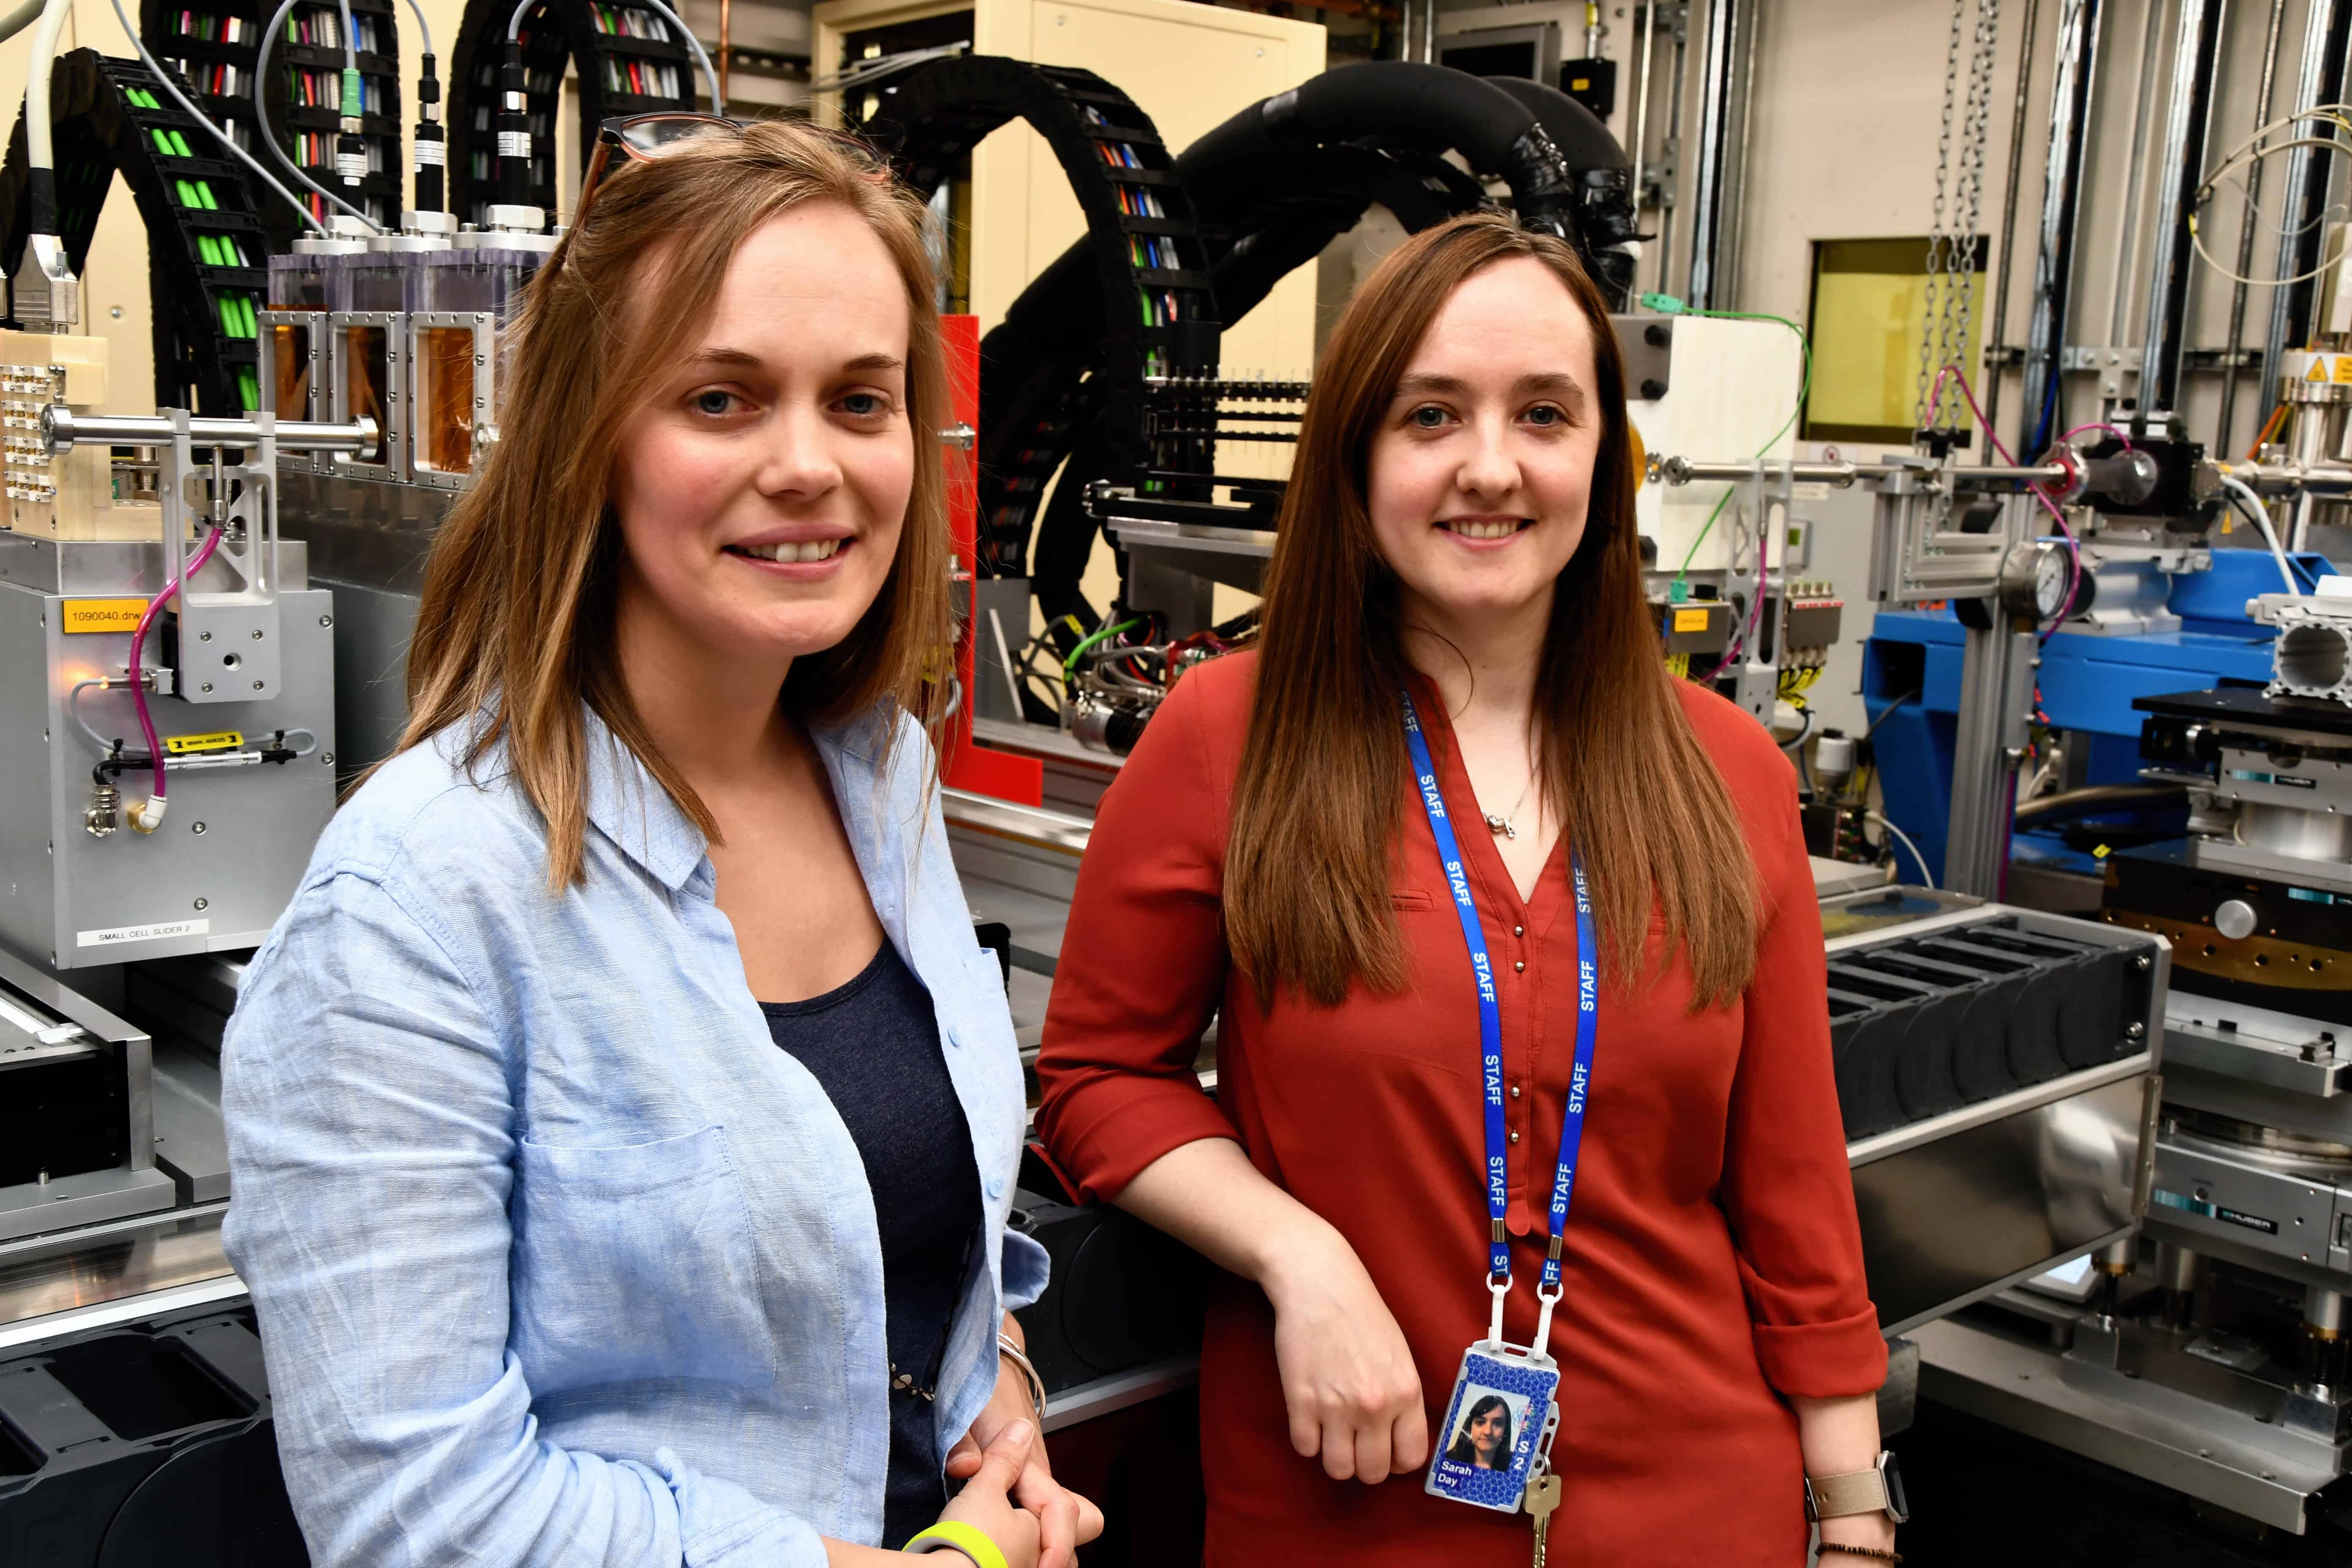
Super team: academic researcher Claire Corkhill and beamline scientist Sarah Day. (Courtesy: Sean Dillow)
By Sarah Tesh
When I was teenager, we often drove past a massive metal “doughnut” that was taking shape in the Oxfordshire countryside – a doughnut more commonly known as Diamond Light Source. After years of passing by but never visiting, last Thursday I finally got to go inside the silver building housing the UK’s synchrotron.
I was there to find out about the longest ever experiment to take place at a synchrotron, which hit the 1000-day milestone on 2 July. The experiment was the first to be set up on the world’s only long duration synchrotron beamline and investigates the hydration of cements used in nuclear waste storage and disposal. My guides for the day were beamline scientist Sarah Day, experiment leader Claire Corkhill from the University of Sheffield and Diamond press officer Steve Pritchard.
Robert Kremens fights fire with fire. No, really – that’s his job. Kremens sets fires in a host of locations across the US. In April he drove 18 hours from his home in Rochester, New York, to Tall Timbers, a research station in Tallahassee, Florida, to set three or four fires. In mid-May he travelled to Wisconsin with the US Fire Service, again setting blazes, keeping his distance and watching how they burned. This summer, he’s back in New York, setting more fires closer to home. Most of us break up the year by months, seasons or semesters; for Kremens, it’s divided by his burning schedule.
Kremens, a physicist and a trained firefighter, also seeks out fires he didn’t set. On 31 July 2015 lightning struck a tree a few miles north of Hume Lake in central California’s rugged Sierra National Forest, igniting a devastating forest fire that raged for weeks, ultimately consuming more than 600 km2. The blaze, named the Rough Fire, began in a steep and hard-to-reach area and climbed uphill, boosted by the warm, windy, dry conditions. Most people at the time avoided the location. But a week after it broke out, Kremens caught a plane from New York to California to join a fire-monitoring team with the goal of measuring and analysing the wildfire in real time. They weren’t there to fight the fire; they were there to understand it.
For three days, they cleared branches and converted nearly 20 small, unspoiled forest plots into impromptu laboratories. They installed cameras and other sensors that could take measurements of the blaze. With any luck – and this is a strange sort of luck – these small clearings would lie in the fire’s path and collect data as it burned through. After the fire was gone, the researchers returned to their investigation sites and found that 12 had been burned and two others lay in unburned islands, still within the area of the fire. Those data would be used by the Missoula Fire Sciences Laboratory in Montana – one of the world’s leading wildfire research centres – to learn more about fire properties such as heat transfer and how different materials ignite.
Fires are unpredictable, and fire research is riddled with open questions. Much of the physics of how a fire spreads is still a mystery, and researchers struggle to predict how long a given material will burn, or how much energy it will release. Also, researchers don’t know exactly how heat and mass move within or in front of a fire to ignite new material and spread the blaze. Dead sticks and grass burn easily, which can be explained by their lack of moisture. But scientists don’t know why the small green needles on living conifers also burn easily – and fuel the biggest, most destructive wildfires, which tear through the crowns, or tops, of living trees. Because forest fires devour a mix of living and dead vegetation, understanding how things burn is critical to figuring out how to protect people and property.
Chasing these questions, scientists have found a way to search for answers, which is – paradoxically – to set more fires.
Prescribed burns
Kremens’ work with fire began in 2000, after a destructive fire season prompted the Rochester Institute of Technology, where he is based, to establish a fire research programme. Since then, he’s led an effort to investigate combustion in wildfire. He’s also trained as a structural firefighter in Rochester, which means he responds to house fires and other alarms around the city. His goal in fire research is to develop portable, inexpensive and fireproof instruments that can be laid in a fire’s path to measure its convective and radiative power. Kremens also participates in intentional “prescribed burns”, offering advice on when, where and how long to burn for. But despite his decades of experience, extensive knowledge of fire and encounters with hundreds of blazes, he still gets a little nervous. “Every time there’s a fire on the ground, I’m a little panicked,” he admits. “It’s natural to be scared shitless when there’s a fire going on.”
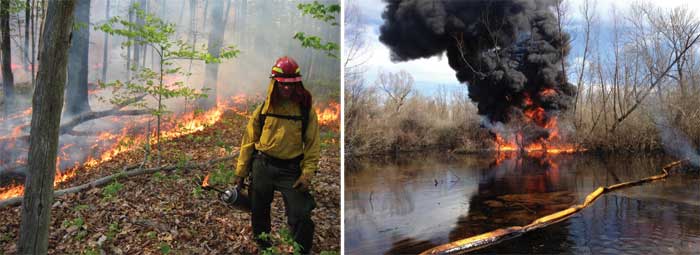
Firestarter Physicist Robert Kremens (left) helps set and monitor controlled burns to remove flammable material that could lead to a larger uncontrolled fire. Sometimes the US Coast Guard uses fire to remove small oil spills (right). (Left: Robert Kremens; right: US Coast Guard)
Wildfires are inevitable, but the last few years have witnessed waves of destructive, with widespread wildfires that have caused billions in damage around the world. A 2013 study suggests large forest fires are becoming more frequent and are posing a greater threat to people and property, in part because people are moving into fire-prone areas and building structures there. Firefighters and researchers have made progress in understanding the fires that bring down buildings and other structures, says Michael Gollner, who leads a research group in the University of Maryland’s Department of Fire Protection Engineering, in College Park. The increased use of sprinklers and less-flammable building materials have helped reduce structural risks.
But fires that burn outside are a different story. They’re more complicated, and the result of myriad environmental factors, not all of which are easy to study. “Usually there’s a natural cycle to burning,” says Gollner. “If you miss that cycle – let’s say because humans continually put out those fires – then the problem doesn’t go away. It gets worse.” That’s the unsettling paradox at the heart of wildfire management – without small fires to clear debris from the forest floor, he says, dead sticks and leaves lie in wait, ready to burst into flame under the right conditions. Once the fire gets large enough, it can spread to the trees’ crowns and form walls of flame 30 m tall. To avoid wild, out-of-control fires, Gollner says researchers need to think about ways to reduce stores of fuel. Small, intentional burns can lower fire intensity.
Kremens agrees. For nearly a century, he says, “we’ve been suppressing fires, and it’s caused a tremendous abundance of fuel on the ground. How do you reduce those fuels without endangering the population and wrecking everything?” In New Jersey’s Pine Barrens, for example, he works with the Forest Service to find optimal times of year and weather conditions for burning away debris. Otherwise, “we risk starting a fire that we can’t control, and then we burn New Jersey down”, he says. “Some people wouldn’t mind that, but it is an incredibly beautiful state.”
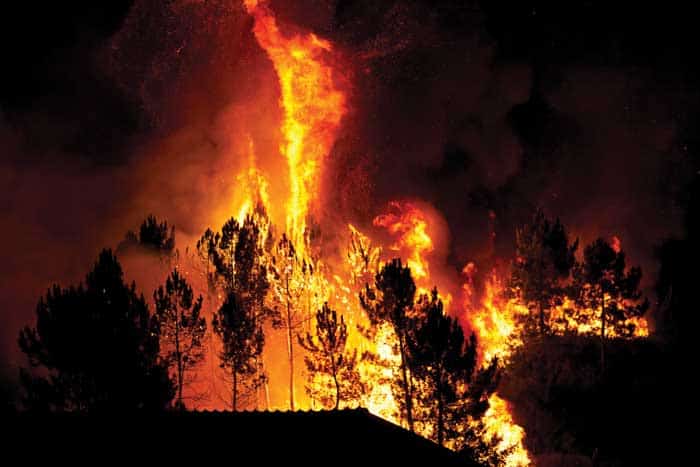
Flame thrower In large fires, powerful flame bursts can emerge that are tens of metres high. Physicists now believe this is the result of vortices, which are themselves the result of convection. Further experiments are needed to find the key to predicting these deadly outbursts. (Courtesy: Shutterstock/Bruno Ismael Silva Alves)
These prescribed burns serve another important role: as experimental testing grounds to probe the inner physical structures of fires. In addition to conducting outdoor prescribed burns, researchers at the Missoula Laboratory study how fires start and spread using indoor experiments in wind tunnels and a burn chamber. They control the types and arrangements of materials, and analyse how those materials burn. Recent experiments have begun to identify surprising avenues for energy transfer, as well as structures within the fire itself. The complexity of those structures, however, is daunting.
Experimental burning has provided the data behind many national fire warning systems, including those used in Australia and Canada, and some countries in Europe, according to Mark Finney, a researcher at Missoula. At the same time, it’s shown that fire research, despite decades of work, is still in its infancy. “We’re just at the stage of recognizing the problems,” he says. “We haven’t really realized what our basic informational needs are.”
Primary ingredients
Finney ticks off three primary ingredients for a fire. First is combustion, which is the chemical reaction of a fuel with oxygen that results in glowing, flaming, and heat release. Then there’s a transfer of energy, as by radiation (the release of heat) or convection (the movement of hot gases or fluids). The third ingredient is the ignition of new fuels that are encountered by the released energy. “Those each have open questions associated with them that are basic in nature,” says Finney.
Recent studies at Missoula have started to crack open some of fire’s physics mysteries. One of the biggest, in recent years, is the role of convection. Since fire research began in earnest more than 70 years ago, scientists have largely assumed that radiation was the most important factor in spreading a fire. The idea was that combustion produced radiant energy, which heated and ignited new fuel. “Nobody had ever studied flame structure before,” says Finney. And why would they have? If radiation – a clean and simple phenomenon – suffices as an explanation, then why bother with convection?
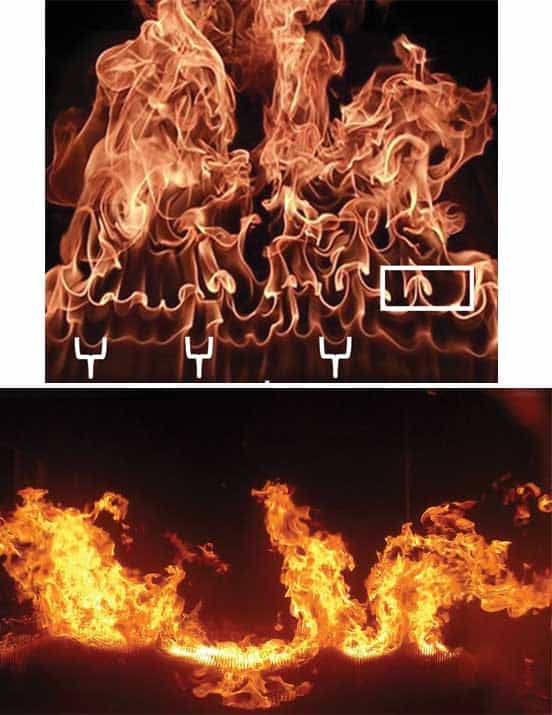
1 Flame zone (a) Image of fire in an ethylene gas burner showing distinct mushroom-shaped vortices caused by convection (white box). (b) Movie still from the leading edge of a wind-tunnel experimental fire spreading in cardboard fuel showing similar vortex shapes on a larger scale. (Supplied by Mark Finney. PNAS112 9833. Copyright 2015 National Academy of Sciences. Used with permission)
But the assumption that radiation would suffice hit a snag when Finney and other researchers began reporting on experiments showing that radiation is not sufficient. Small particles of fuel failed to ignite when exposed to radiation at levels equivalent to those from a forest fire, which in turn led researchers to look at whether convection played a significant role (2015 PNAS112 9833). Detailed experiments using high-speed cameras revealed structures lurking within the fire. Imaging revealed vortex pairs rotating in opposite directions, forcing flames into patterns of upward-pointing peaks and lower troughs. These vortices looked familiar – in fluid dynamics, they’re known as “Taylor–Görtler vortex pairs” and they arise when a turbulent fluid encounters a concave boundary. The vortices help explain the bright streaks that are often observed in fires (figure 1).
Finney and his team also found that the vortices could explain a phenomenon that’s been observed since the 1960s, in which powerful bursts of flame sometimes surge out of a leading edge of a fire and engulf the surrounding environment. In small fires, that surge may be only a few inches; in large crown fires, it may produce flame bursts many tens of metres long. Such bursts can be deadly, especially to the brave firefighters trying to control a wild blaze. Their study suggests that convection, rather than radiation, is the secret ingredient (or just one of them) to pushing a fire forward, but they’ll need to run more experiments at larger scales to see if that conclusion holds.
Back to basics
Studies like the ones of convection, says Kremens, show how fire science is returning to the basic principles of combustion to try to understand how a fuel bed ignites. “The field is opening up as people go back to basic physics principles,” he says. Wildfires are inevitable, adds Finney. The ultimate goal of fire research is to live better with those fires, and do a better job of mitigating their effects. But first, they have to figure out the science. If researchers knew the physics of how fires spread, they could establish a foundational theory for the field. But as they don’t have that theory, every country has had to attack the problem of fire in its own way, and the result is a chaotic mess of theories that don’t agree.
“Since the physics is so poorly understood, there are many different interpretations of what’s going on. It’s more mystifying than elucidating,” says Finney. Fire researchers rarely collaborate internationally because they’re working from a different set of assumptions and ideas. Wildfire research doesn’t have canonical experiments – or even common procedures – that can be repeated and verified in any lab. However, Finney does say he’s optimistic that once fire scientists recognize what they don’t know, they can start to understand how the pieces of a fire fit together in one, tangled, convective puzzle. “Once we state those fundamental questions,” he says, “we’ll find people eager to solve them.”
Physicists in the US have developed a new technique to improve the stabilization of a laser’s frequency inside an optical cavity. Known as “magnetically induced optical transparency” (MIT), the technique employs a magnetic field to reduce the linewidth of the stabilized frequency below that of the cavity and to render it largely immune from cavity vibrations. The work might lead to more robust portable laser systems, such as transportable atomic clocks, say the researchers.
The frequency of a laser is usually stabilized by bouncing the beam multiple times between two mirrors in an optical cavity. The distance between the mirrors is set equal to an integer number of half wavelengths of the laser light to achieve resonance. The problem is that the length of the cavity can vary over time, due, for example, to temperature fluctuations or seismic vibrations, so reducing the frequency stability. Even in very advanced cavities, fluctuations occur due to the Brownian motion of atoms in the mirror coatings.
Rather than relying on a constant cavity length, MIT uses the inherently stable frequency of a particular atomic transition. Developed by James Thompson and colleagues at the National Institute of Standards and Technology and the University of Colorado in Boulder, the scheme uses a static magnetic field to induce the Zeeman effect in a group of very cold atoms. The field splits the excited state of an atomic transition whose energy equals the frequency of the laser, such that the two sub-states are in energy terms equally distant from the original state – one being very slightly above it and the other very slightly below.
Impaired absorption
When the atoms are placed in a cavity without a magnetic field, the laser light that is fired into the cavity is absorbed by the atoms (since the frequency of the light and transition match), with the relaxing atoms then scattering light in all directions. But when the field is applied, absorption is impaired. Although the laser can still excite some atoms into the two sub-states, the slight mismatch between laser and transition frequencies limits the excitation and allows the beam to bounce back and forth between the mirrors. The idea is that by tuning the laser frequency up and down, a peak in the cavity output will occur at the frequency of the atomic transition.
Thompson’s team demonstrated MIT by loading around one million strontium-88 atoms into a cavity monitored by a photon counter. The researchers found, as expected, that when they applied a magnetic field across the cavity and then tuned the laser to the appropriate strontium transition, the power transmitted to the photon counter peaked.
They increased the field strength to widen the energy gap between the two sub-states, and therefore open the “window” of permitted frequencies. The result was an increase in output power but also a broadening of the laser’s linewidth. Conversely, by decreasing the field and narrowing the window they were able to make the line much sharper. At very low fields they could approach the inherent width of the atomic transition line, generating a line that was some 20 times narrower than would be possible using a standard atom-free cavity.
Linewidth versus power
The scheme offers a trade-off between linewidth and power – reducing the width as far as possible without boosting absorption to the extent that scattering overheats the chilled atoms. But as the researchers point out, the window could be closed further – allowing more stable frequency measurements – by using a different kind of atom with a longer-lived excited state, since inherent linewidth is inversely proportional to the lifetime. Although the strontium transition is already quite long-lived, both calcium and magnesium have more durable excitations, they say.
MIT is a variant of electromagnetically induced transparency, a technique first demonstrated more than 20 years ago in which a “pump” laser opens up a frequency window in a medium for a “probe” laser to enter. A virtue of this scheme, explains Thompson’s colleague Matthew Norcia, is that the window can be almost closed even if the inherent linewidth of the transition is not that narrow. The problem, he says, is that any noise in the pump is transferred to the window, and hence to the probe. Since the probe can’t be made more stable than the pump, the approach cannot provide an absolute fix of a laser’s frequency.
That is not true of MIT, which exploits an unvarying – and hence un-noisy – magnetic field. Norcia says the best optical cavities today are already very precise and, because they are highly engineered, probably couldn’t incorporate clouds of atoms. Therefore the new technique is unlikely to improve on state-of-the-art frequency stabilization. But it could be useful for improving the stabilization of mobile laser systems, where vibrations can play havoc with the stability of optical cavities.
Simpler optical clocks
One such system, suggests Norcia, is the portable optical clock, which can be used to compare atomic timekeeping around the world and bring us closer to an optical- rather than microwave-based definition of the second. Optical clocks use cavities to stabilize timekeeping between periodic comparisons of their laser frequencies and the frequency of a suitable atomic transition. By putting atoms inside the cavities, he says, the clocks could be made simpler and more robust.
Scientists have uncovered how ribbon halfbeak fish “fly” despite having no hind wing fins. Yoshinobu Inada from Tokai University in Japan and colleagues have mimicked the fish’s flight, hoping to find the optimal design of tandem wing planes.
To evade predators, “flying fish” have evolved to propel themselves out of water and soar above the surface. Normally, the fish can achieve this short flight because they have two sets of “wings” – large pelvic fins act as horizontal tail wings similar to those toward the rear of planes, and large pectoral fins are used as the standard large wings.
A unique twist
The ribbon halfbeak fish, however, lacks the large pelvic fins. To investigate, Inada and colleagues 3D printed a model resembling the fish. They analysed the effect of wing positions on flight performance using a wind tunnel. “Amazingly, they solve the problem by rotating their rear body by 90°, and use their wide dorsal and anal fins as a horizontal tail wing,” explains Inada. “This is a really unique behaviour.”
In conjunction with their twisting bodies, ribbon halfbeak fish also reduce the effect of downwash on the tail wings by lifting the rear of their body above the pectoral wings. “This has a positive effect on improving the lift and flight performance of the fish,” says Inada.
The researchers believe the fish developed this unusual method of flight because of different evolutionary pressures compared to other flying fish. The work is being presented at the Society for Experimental Biology Annual Main Meeting 2017 taking place in Gothenburg, Sweden.
Signatures of the extra dimensions required by string theory could be seen by future gravitational-wave detectors. That is the conclusion of David Andriot and Gustavo Lucena Gómez at the Max Planck Institute for Gravitational Physics in Germany, who have identified two ways in which gravitational waves could be affected by the consequences of string theory – a theoretical framework that invokes speculative concepts such as extra dimensions to try to fill important gaps in our understanding of physics, including the nature of quantum gravity.
Gravitational waves are ripples in space–time that are created when massive objects are accelerated under certain conditions. Andriot and Lucena Gómez calculate that adding N extra dimensions to 4D space–time results in a “breathing-mode” oscillation that would be present in a gravitational wave. The second distinct feature of extra dimensions, say the researchers, is a discrete set of higher-frequency signals accompanying a gravitational wave.
Third detector
The first gravitational-wave detection was made in 2015, when the LIGO observatory spotted a signal from a coalescing binary black hole. Andriot and Lucena Gómez say that LIGO’s current configuration of two detectors will not be able to detect the breathing mode. However, it is possible that a breathing mode could be detected once a third detector in Italy (called Virgo) reaches its full sensitivity in 2018.
As for the higher-frequency signals, Andriot and Lucena Gómez point out in the Journal of Cosmology and Astroparticle Physics that the trend in future detectors is towards lower frequencies, and therefore a special observatory would be needed to see that effect.