The first observation of gravitational microlensing by a star other than the Sun has been reported by astronomers using the Hubble Space Telescope. Predicted by Albert Einstein as a consequence of his general theory of relativity, gravitational microlensing involves the gravitational field of a star bending light coming from a more distant star. It was first observed during a total eclipse in 1919 by looking for deflections in the positions of stars in parts of the sky next to the Sun. Now, Kailash Sahu of the Space Telescope Science Institute in the US and an international team have measured the gravitational lensing of a background star by a white dwarf star called Stein 2051 B. Because the background star is not lined-up perfectly with Earth and Stein 2051 B, a combination of gravitational lensing and Earth’s motion around the Sun causes the background star to appear to trace out a loop around Stein 2051 B. Sahu and colleagues mapped its position at five different times in 2013-14 and used this information to calculate the mass of Stein 2051 B. It turns out that astronomers have puzzled over the mass of the white dwarf for over 100 years. It is part of a binary system and the motion of its distant companion suggests that Stein 2051 B has a smaller mass than most white dwarfs, implying that it might have an exotic composition. This recent work, however, suggests that the star has a mass expected for a white dwarf of its radius. The observations will be described in and upcoming paper in Science.
Amorphous topological insulators are possible, calculations reveal
Some amorphous materials such as glasses could be topological insulators – a property that is normally associated with materials with atoms locked into regular crystal structures. That is the claim of Adhip Agarwala and Vijay Shenoy of the Indian Institute of Science in Bangalore, who have done calculations describing electron-like particles “hopping” between sites that are distributed randomly within a material. Agarwala and Shenoy found that some 2D and 3D materials could have conducting “edge states”, even though the materials are insulators in the bulk. This is a hallmark of topological insulators and normally arises because of certain properties of the electronic band structure that occurs in crystalline materials. In a paper in Physical Review Letters, the physicists say emergence of these states is associated with the presence of “spin-orbit motifs” in the materials. In real materials these motifs could be atoms, molecules or nanoclusters that support the interaction between the spin and orbital angular momentum of electron-like particles. They also say that it could be possible to engineer amorphous topological insulators by introducing impurities with the appropriate properties into an amorphous material.
Origin of the Tibetan Plateau comes under scrutiny
Lifted high: the Tibetan Plateau’s elevation is described by a new tectonic model. The vast Tibetan Plateau formed much more quickly than previously thought (Courtesy: NASA)
The Tibetan Plateau rose within 10 million years rather than 45 million years as previously thought, according to a comprehensive seismic study by geophysicists. The vast plateau in Asia covers an area of 2.5 million km2 and stands on average 4.5 km above sea level. It has long been thought that the so-called “Roof of the World” has been continuously rising since the Indian and Eurasian tectonic plates began colliding 45 million years ago. This leading theory says that the northward motion of the Indian plate forces the plateau to simultaneously shorten and rise. Now, however, geophysicists led by Min Chen of Rice University in the US propose a different scenario based on three years of seismic data and supercomputer modelling. Chen and colleagues looked at readings from thousands of stations in East Asia, where seismometers measure the amplitude and timings of seismic waves caused by tectonic movements. The researchers then used a technique called full waveform inversion, which involves using supercomputers to work backwards from the seismic data so as to calculate what rocks the waves had passed through. “The technique really allows us to use all the wiggles on a large number of seismographs to build up a more realistic 3-D model of Earth’s interior,” says Chen. The team now believes that the plateau rose dramatically during the first 10 million years of the India-Eurasia collision. Both plates were rigid and buoyant, and rather than one pushing under the other, the two came together to form a thick slab of lithosphere. The Eurasia plate, however, was more deformable, creating a denser portion of lithosphere that eventually sank and today extends at least 660 km below the plateau. “Our seismic image suggests that the Tibetan lithosphere thickened and formed a denser root that broke away and sank deeper into the mantle,” Chen explains, “We conclude that most of the uplift across Southern Tibet likely occurred when this lithospheric root broke away.” The new model is presented in Nature Communications.
Surface slipperiness is a critical property within material development in the medical and technology fields. While materials with specific surface properties have been developed, few have demonstrated tunable slipperiness. Yuanjin Zhao and his group at Southeast University in Nanjing, China, hope to change this by developing a smart sponge with controllable wettability.
Wettability (the ability of a liquid to maintain contact with a surface) is a well-understood property that has been studied for more than 200 years. Stain-repelling clothing and anti-fogging windshield wiper fluids are both examples of materials with specifically designed non-wettable properties.
Zhao’s novel material goes beyond specific wettable-surface design by combining smart polymer trans-1,4-polyisoprene (TPI) with the well-known nanomaterial graphene. Smart polymers have mechanical properties that are sensitive to outside triggers. In this case, TPI changes shape when a voltage is applied. By covering a graphene sponge with TPI, Zhao and his group were able to control the shape of the graphene sponge using an outside voltage.
The sponge shape control was linked to wettability by covering the TPI–graphene sponge with a lubricant. Such a structure was partially inspired by the Nepenthes pitcher plant. When the sponge expands, the applied lubricant flows inside the sponge pores, causing the surface to become rough and irregular. But when the sponge contracts, the lubricant is forced out to create a slippery, sleek surface.
Zhao directly demonstrated the usefulness of the new material by using the sponge to pipette different solutions into a microplate. Microplates are frequently used in biological and medical labs but require a large number of pipetting steps. To make this process less labour intensive, one could load the different samples into specific wells located within the sponge. Samples could then be unloaded into the correct microplate well on demand.
Such a novel sponge can also be reused for different microplates and samples, as no liquid residues remain on the sponge well surface after the solutions are transferred. This is a huge advantage over traditional pipette tips, which must be disposed of to prevent sample contamination when working with different microplate wells. This property is directly related to the sponge’s change in surface wettability.
Zhao and his colleagues imagine such a unique sponge could also be used in microfluidics and biomedical instruments. Other applications include fuel storage and enclosure of micro-scale chemical reactions. Full details are reported in Science Advances.
I am currently in the market for a smartwatch that doubles as a fitness tracker. As I perused the seemingly endless options online, I came across a device that claimed to offer an additional feature: an optical sensor that could give me real-time information about my blood glucose levels. This is an enticing possibility. A continuous, non-invasive measure of blood sugar would help athletes optimize their intake during gruelling workouts. The wellness crowd could use it to improve nutrition. Most importantly, though, it would mean that millions of people with diabetes would no longer have to prick their fingers several times a day to extract a blood droplet for testing.
Unfortunately, the “glucose sensor” in this fitness tracker was useless. In fact, I only found out about the tracker by reading an article lambasting it. But although the article was good at dismissing the manufacturer’s claims, it failed to convey why the device didn’t work – or indeed why the hundreds of millions of dollars poured into optical glucose sensing by government-funded academic labs and deep-pocketed companies have not produced a functional product. Why isn’t this technology available yet? Like flying cars, jetpacks and tricorders, why are we being denied this boon of modern science?
Challenges ahead
The general idea behind non-invasive glucose sensing is to shine light onto skin and collect and analyse the reflected light for information relating to glucose content. This information could be a direct measure of glucose’s optical response (spectrum), or an indirect measure based on the effect glucose has on the tissue’s optical properties. Many researchers have treated this as strictly an engineering challenge: surely, all they need to do is devise a better instrument or apply better algorithms to the data. The lure of helping all those diabetes patients (and turning a massive profit) is strong and it is easy to believe that some promising new technique will bring it within reach. However, in reality, optical glucose sensing is fundamentally a physics challenge, not an engineering challenge, and this is why the vast majority of efforts have failed.
Techniques that directly measure glucose’s spectral signature are widely considered the best at producing reliable and robust measures of glucose content. Spectral signatures that arise from molecular rotational-vibrational motions can be recorded via absorption or Raman spectroscopy. However, glucose is far from the only molecule present in tissue, so measured spectra also include contributions from collagen, lipids, water and other constituents. In such cases, indistinct spectral features or large and varying background levels mean that measurements at multiple wavelengths are required to tease out the relative contributions of each substance.
This type of multiple-equation, multiple-unknown analysis is familiar to most scientists, so you might surmise that we need to know all of the component spectra before we can solve the system of equations for the concentration of the analyte of interest. Unfortunately, we don’t have this information. Certainly, we can make assumptions as to what the largest contributors will be, but a model derived from incomplete component spectra produces errors that are too high for the results to be clinically useful.
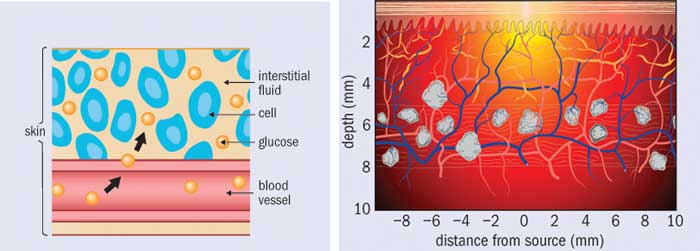
Shining a light (left) The concentration of glucose in blood is different from the concentration in interstitial fluid and other tissues, and all of these concentrations change over time. (right) The beam of light passes through different types of tissue, and the optical sampling volume depends on their absorption and scattering properties.
To solve this problem, we turn to a class of analysis called multivariate calibration. The fundamental goal of multivariate calibration is to derive a vector b of the same length as a measured multivariate dataset (in this case a spectrum) s, such that the inner product gives the quantity of glucose c. Written in linear algebra form, the expression is: c = sTb.
Here, lower-case boldface type denotes a column vector and the superscript T denotes a transpose. The vector b is often called the “regression vector” or just “b-vector”. Finding b is where the calibration step comes in. What we need is a set of tissue spectra, Scal, that are associated with known “reference” concentrations of glucose, cref. The linear-algebra expression looks nearly identical to the previous one, except cref is a column vector and the calibration spectra Scal is a matrix: cref = ScalTb.
In theory, this expression can be inverted to find b. In practice, a direct inversion is difficult because the system is underdetermined: there are more variables (wavelengths) than equations (calibration spectra). Researchers have tried myriad ways of addressing these challenges and solving for b, including acquiring more calibration spectra and applying novel advanced mathematical techniques. However, these tactics alone will not suffice, because developing an accurate regression vector b requires highly accurate values of cref and Scal. Small variations in either can lead to large errors in b and therefore unacceptably high errors in predictions of glucose concentration. Thus, the challenge of optical glucose sensing boils down to two seemingly simple prerequisites: an accurate knowledge of glucose reference concentrations and an associated set of high-quality calibration spectra.
Accurate reference concentrations
Finding the concentration of glucose in each spectrum of a calibration set might seem like an easy enough task. After all, finger-prick glucose tests are readily available. However, veins and capillaries contain different levels of blood glucose, and the act of squeezing out a small droplet changes the measured glucose concentration. In addition, many over-the-counter blood glucose meters are not accurate enough to act as references; indeed, even clinical laboratory instruments are only just good enough. To complicate things further, the concentration of glucose in blood is only part of the true cref, because the beam of light passes through interstitial fluid and tissue as well as veins and capillaries. Glucose is present in these spaces as well, and in differing concentrations. And when glucose concentration rapidly changes, as it does after someone eats, these differences in glucose concentrations are time dependent.
Out of all these problems, time dependence is perhaps the most challenging. The lag time between interstitial-fluid glucose levels and blood glucose levels is one of the major issues facing non-invasive sensing. Indeed, minimally invasive techniques (such as implantable sensors) struggle with it too, as they must wait for glucose to diffuse into the interstitial space and then to diffuse across the sensor membrane. Some researchers have attempted to characterize these lag times or develop mass transfer models. Others have focused on measuring both interstitial-fluid glucose and blood glucose simultaneously during a calibration study and weighting the contribution of each. However, the relative fraction of blood plasma, interstitial fluid and intracellular fluid is affected by a multitude of factors ranging from diet and water intake to medications and activity levels. How one is supposed to ascertain the actual glucose concentration within the optical volume in a particular patient, at a particular time, is an open question.
Even if the concentrations of glucose were equivalent in all tissue spaces, there is yet another challenge that most researchers have ignored: the measured spectral intensity is proportional to the number of sampled glucose molecules, not to the glucose concentration. For a fixed optical sampling volume, this distinction would be irrelevant. But in fact the optical sampling volume varies with a tissue’s absorption and scattering properties, which depend on a large number of factors. These include exposure to sunlight, temperature and contact pressure at the sampling site, plus properties of the patient such as the amount of melanin in their skin, hydration level, activity level and so on. What this means is that from person to person, from site to site, and even from time to time, the number of sampled glucose molecules can vary even if the glucose concentration were constant.
One could, of course, acquire spectra from more and varied subjects, but that is not going to be enough to account for the error in glucose values used to develop the model. It is possible to correct for sampling volume variations, but to make such a correction one need to know the optical properties of the tissue at the same time as every measurement.
All in the calibration
Let us turn now to our other prerequisite: high-quality calibration spectra. The ideal dataset for spectral calibration would have several properties. Unfortunately, only one subset of them – low noise and minimal drift – can be addressed directly through instrument engineering. The others – a high ratio of glucose signal to background; high spectral “distinctness” (orthogonality); and spectral constituents that do not co-vary with glucose levels – all require a more fundamental approach.
Maximizing glucose signal-to-background and spectral orthogonality is useful because it minimizes contributions to b from other (non-glucose) constituents. This makes the model robust against the influence of other analytes, so it should reduce the error in predicting glucose concentration. To accomplish this, we need to select our spectroscopic technique carefully, and choose an appropriate wavelength region and spectral resolution. However, regardless of the spectroscopic technique employed, other tissue constituents will still contribute strongly to the spectrum. It is therefore of utmost importance for calibration spectra to sample varying levels of all possible tissue constituents, and for these levels not to co-vary with glucose. This means that the way we obtain calibration spectra is crucial if we want a model that is applicable to future measurements, rather than just the set of data it was developed on.
As an example, consider a test in which the subject is asked to fast for 12 hours and is then set up with an instrument to begin collecting spectral data on their arm or finger. After a baseline period, the subject quickly drinks a beverage containing 75 g of glucose (for comparison, a sweet soft drink contains 40 g of sugar). The subject’s blood glucose concentration rises relatively rapidly and then falls over time as their pancreas releases insulin and glucose is removed from the bloodstream. Spectral data are collected at pre-determined time points along with blood samples to obtain reference glucose concentrations.
The procedure described above is a commonly employed test of glucose tolerance. Unfortunately, this study design is rife with challenges, including non-equilibrium glucose concentrations in different types of tissue; time-dependent physiological responses to glucose that cause the spectra of many tissue constituents to co-vary with glucose concentrations; and even time-dependent changes in how the instrument responds. Indeed, glucose tolerance tests are notorious for generating spurious correlations.
The optimal study design is a randomized, multi-level glucose clamp. In this type of test, both glucose and insulin are injected via a syringe pump such that the concentration of glucose within the subject’s bloodstream is maintained at a constant level for long enough that glucose levels reach equilibrium across various tissues. Next, the concentrations of glucose and insulin are changed in order to reach a new equilibration level, either higher or lower than the previous level. To avoid confounding effects, changes in the equilibrium level should not be time-dependent (so, for example, a protocol that repeatedly stepped up the equilibrium level would not be suitable). In this type of study, calibration spectra are acquired during the period of equilibrated glucose values. This minimizes any effects due to spectral properties co-varying with glucose concentrations. It is, however, a very expensive study, and it poses safety concerns that far exceed anything associated with gulping down a very sweet beverage. Hence, animal models should be used until confidence in performance is high enough to warrant testing in humans.
Why so much hype?
The hype around “imminent” optical glucose sensing has often been fed not by patient groups or breathless media reports, but by the researchers themselves. Many seem genuinely unaware of the common traps so many others have fallen into. The most frequent mistake is touting performance based on a “cross-validated” glucose tolerance test, where the term cross-validated means that the model was both generated by and applied to data acquired within the same study session, giving false confidence in the results. Such models will give far worse glucose-prediction results when they are applied to data taken at different times where the physiological and environmental conditions vary. Yet such tantalizing results are often enough to spur investment by people willing to believe. If you enjoy your informative materials with a heavy dose of snark, I recommend The Pursuit of Noninvasive Glucose: Hunting the Deceitful Turkey, in which glucose-sensing researcher John L Smith offers his personal take on why many companies have failed. While his manuscript does not focus on the underlying physics, it contains many of the same insights that appear in this article.
There are, undoubtedly, many instrumentation challenges in developing non-invasive glucose monitors in addition to the physics ones I have outlined here. Among other things, a practical device must be small enough to be convenient for patients and inexpensive enough to be marketable. Because improvements in these areas are easily apparent to investors, companies are often driven to show progress in engineering at the expense of science. Alas, without scientific progress, in which the problem is considered as a whole rather than in part, a smartwatch that can tell me my blood sugar – and diabetics’ hopes of ditching finger-prick tests for good – will remain out of reach.
Particle physics is a tricky business. Giant accelerators smash subatomic particles together, while fantastically complicated experiments study the debris for clues about the make-up of the universe. Since the middle of the 20th century, accelerators have become bigger and experiments more sensitive. Almost every jump forward produced a new discovery – the most recent being the Higgs boson at CERN’s Large Hadron Collider (LHC). While the story of the science behind these discoveries has been told several times, there is also a lesser-known, but very human, story to tell. These experiments bring together hundreds or even thousands of people from all over the globe, and navigating the inevitable clashes of style, method and personality is a core skill of the modern particle physicist.
Still, in working towards a common scientific goal, all of these little problems must be solved in a calm, rational way, right? Not a chance. Particle physicist Tommaso Dorigo’s book Anomaly!: Collider Physics and the Quest for New Phenomena at Fermilab takes us back to the 1990s, and covers the first 10 years of the US Collider Detector at Fermilab (CDF) experiment, one of two detectors on the Tevatron particle accelerator – the predecessor to the LHC. This was perhaps the beginnings of “modern” particle physics, from new technologies and computing techniques now considered standard, through to the dynamics of new large international collaborations. But unlike many books about particle physics, Dorigo offers a glimpse into the working life of some of the 600-strong team on CDF, and the handful of characters trying to steer the ship – often in different directions.
In the first half of the book, Dorigo shares some classic tales from the construction of CDF, and the early fight for recognition on the international stage. It’s clear that there is more than science at stake here, and Dorigo sets up a moment of real tension as CDF scientists race to publish a result that beats the competition and makes their name. Then, attention turns to the hunt for the top quark, the heaviest particle we know. Discoveries like this may come along only once or twice in a lifetime, so being one of the lead scientists can make a career. The book details how factions formed within CDF, with large groups and larger egos fighting for the glory. Competition with D0, the other experiment at the Tevatron accelerator (and my home for several years), adds to the pressure, and the cracks begin to show. Dorigo is not here to airbrush history – instead, he delights in dishing the dirt on the internal fights that border on industrial espionage: computer scripts that hog resources so other groups cannot work; new ideas being buried under a mountain of questions and requests for cross-checks. This peek behind the curtain at the (mal)functioning of a particle-physics experiment will be surprising to anyone not familiar with the field.
There are some real gems of particle-physics folklore in here. But, like many good ideas in the hunt for the top quark, they are buried under a mountain of unnecessary technical detail, and herein lies the problem I found with this book. The warning signs come early in the “introductory” chapters: the third paragraph in the book is already discussing the vectorial analysis of angular momentum and its quantum analogue. Given that the human stories here provide such great material – and are what make this book unique – I wish Dorigo had focused more on those. Instead, I found myself skipping pages on the interminable meetings, points of procedure, unnecessary technical lingo, and the minutiae of muon triggers and Monte Carlo scale factors. Yes, these details do take up a large part of the daily life of a particle physicist, but if you don’t already know what these things are and how important they can be, I’m not sure this book will give you an appreciation for them.
This is particularly true in the second half, which promises the real controversy (i.e. the really interesting stuff) as it moves from the discovery of the top quark on to the other, more speculative claims that followed. One character, Paolo Giromini, emerges as an agent provocateur in this play, reigniting old fights while refusing to play by the rules. We get a portrait of him dominating the corridors of the CDF offices, ridiculing colleagues, challenging the accepted views while remaining secretive and obstinate in his methods. Is he producing good science or not? It isn’t clear, but with the best theorists in the world putting pressure on the Tevatron experiments to hunt for new particles, Giromini makes claim after claim that he has already found them. The problem is that hardly anyone else at CDF believes him.
At this point, Dorigo himself becomes one of the main actors in the story, and it is clear we are hearing his side of what must have been extremely difficult decisions in how to deal with Giromini’s claims. There is plenty of food for thought here, and given that these events happened 20 years ago, more reflection would have been welcome. Do people like Giromini play a useful role in large collaborations to keep everyone on their toes, or are they just a distraction? When the media catch on to the rumours of a potential discovery, does the prospect of a quick headline interfere with the scientific process?
Given that none of Giromini’s claims have stood the test of time, were his fellow CDF scientists right to be cautious? These are fascinating topics that remain relevant to particle physics and many other areas of science today. But as Dorigo’s narrative remains fixed in the moment, many episodes in the book remain unresolved and the implications unexplored. In the end, this felt like a missed opportunity to tell a fascinating tale of life on the cutting edge of science.
2016 World Scientific Publishing Company 304pp £40pb
On 22 April I and a few hundred other people spent two hours slowly snaking along the three-mile perimeter road that circles Stony Brook University’s main campus. The event, which took place in intermittent rain, was one of the smallest of more than 600 “science marches” that day. It was nothing like the event on the mall in Washington, DC, which attracted some 50,000 people and eminent speakers, or the tens of thousands who took to the streets in New York City.
I chose the local event because I was ambivalent about the very idea of a “science march” and liked the fact that Stony Brook’s was informal, had no speakers, was not overwhelming and I could bring my dog. Dashiell, it turns out, got along well with the diverse pack of other canines there, many sporting clever signs such as “Dogs fur science” and “Save national labs!”.
Taking sides
My ambivalence reminded me of the reluctance that the German–American philosopher Hannah Arendt had about championing democracy. Arendt (1906–1975) was a Jew who fled Nazi Germany for France in 1933, wound up in a French internment camp, until finally making her way to the US in 1941. In the 1950s she became a writer known for books and essays on the origins of totalitarianism.
In one essay, “The eggs speak up” (1950), Arendt attacked the idea behind the self-justifying Stalinist slogan that the only way to “make an omelette” (get anything done) is to “break some eggs” (commit lesser injustices). But Arendt also wrote critically of ex-communists who championed democracy with the same fervour they’d previously had for communist ideology. “Democratic society as a living reality,” she warned, “is threatened at the very moment that democracy becomes a ‘cause’.”
Causes are things about which one can legitimately “take sides”. As she saw it, there was no alternative to democracy. Democracy, she thought, is what creates the free and open environment needed for genuine political actions – for individuals to act in concert to give birth to new kinds of social forces and institutions. Like the Higgs field that spawns mass, democracy is the environment in which causes can form and be advocated.
Arendt feared that turning democracy itself into a cause might spoil it, fostering an atmosphere of self-righteousness and even zealotry. You begin to evaluate every action not for whether it is good, but for whether it will promote democracy. If a good action might harm that cause, you may entertain the value of “lesser evils”, such as abridging basic freedoms.
Arendt’s remarks captured my own hesitation about the wisdom of marching for science. Science has no alternatives; alternative theories in science are not alternative theories to science. Science is inquiry; an open and imaginative way of exploring the structure and dynamics of the world. The atmosphere in which inquiry thrives is very different from authoritative leaders delivering inspirational speeches to crowds who march from one place to another to show their strength in numbers.
As it happens, on the very day that the science marchers gathered on the mall in Washington, DC, the National Math Festival was being held nearby in the city’s Convention Center. A day-long gala that promoted mathematics and its role in the world, the festival included 80 events with puzzles, music, art, origami, games and geometric sculpture assemblies. A festival that spreads information around in a community-enhancing and entertaining way is, I felt, a better way to promote the open and inquisitive spirit of inquiry than a march.
Yet at one point in “Eggs”, Arendt also observed that making a cause of democracy may be necessary in exceptional times involving “clear and present danger”. That was the other side of my ambivalence. The current US administration’s forthright refusal, I thought, to incorporate scientific findings into critical policy decisions affecting health, environment and energy issues surely counts. The administration is clearly trying to destroy the conditions that underlie inquiry itself, replacing it with certitudes provided by ideology and religion for the benefit of the wealthy and privileged. The rest of us are becoming the broken eggs.
Science, in short, was now cause-like. That’s what made me decide to march.
The critical point
Stony Brook’s event was not the only campus activity that day – there were sports, classes and a concert too. Many signs were bland and generic, some variant of “Support science!” Others were clever – “Remember polio? I don’t. Thanks, science!” – or esoteric, such as the one quoting the French public intellectual Pierre Bourdieu on the value of sociology. Still other signs were about vaccinations, bird-watching and gun violence. I had many unexpected conversations about science and politics, and overheard local gossip, snippets of news and reflections on why we were all doing this.
Nobody was watching our march. That made it feel intensely social, like a theatre performance in which everyone was an actor, spectator and critic all at once. We were consolidating and reinforcing our communal common sense in a way we never could have in a lab, at home or via e-mail. Most demonstrations are designed to get on television, to sway the opinions of nonparticipants. But we were simply celebrating what we did, and it made us feel a part of something larger than ourselves. Here and in hundreds of locations over the globe, the eggs were indeed speaking up.
I’ll have a kidney and chips please. (Courtesy: James Dacey)
By James Dacey reporting from Boston, Massachusetts
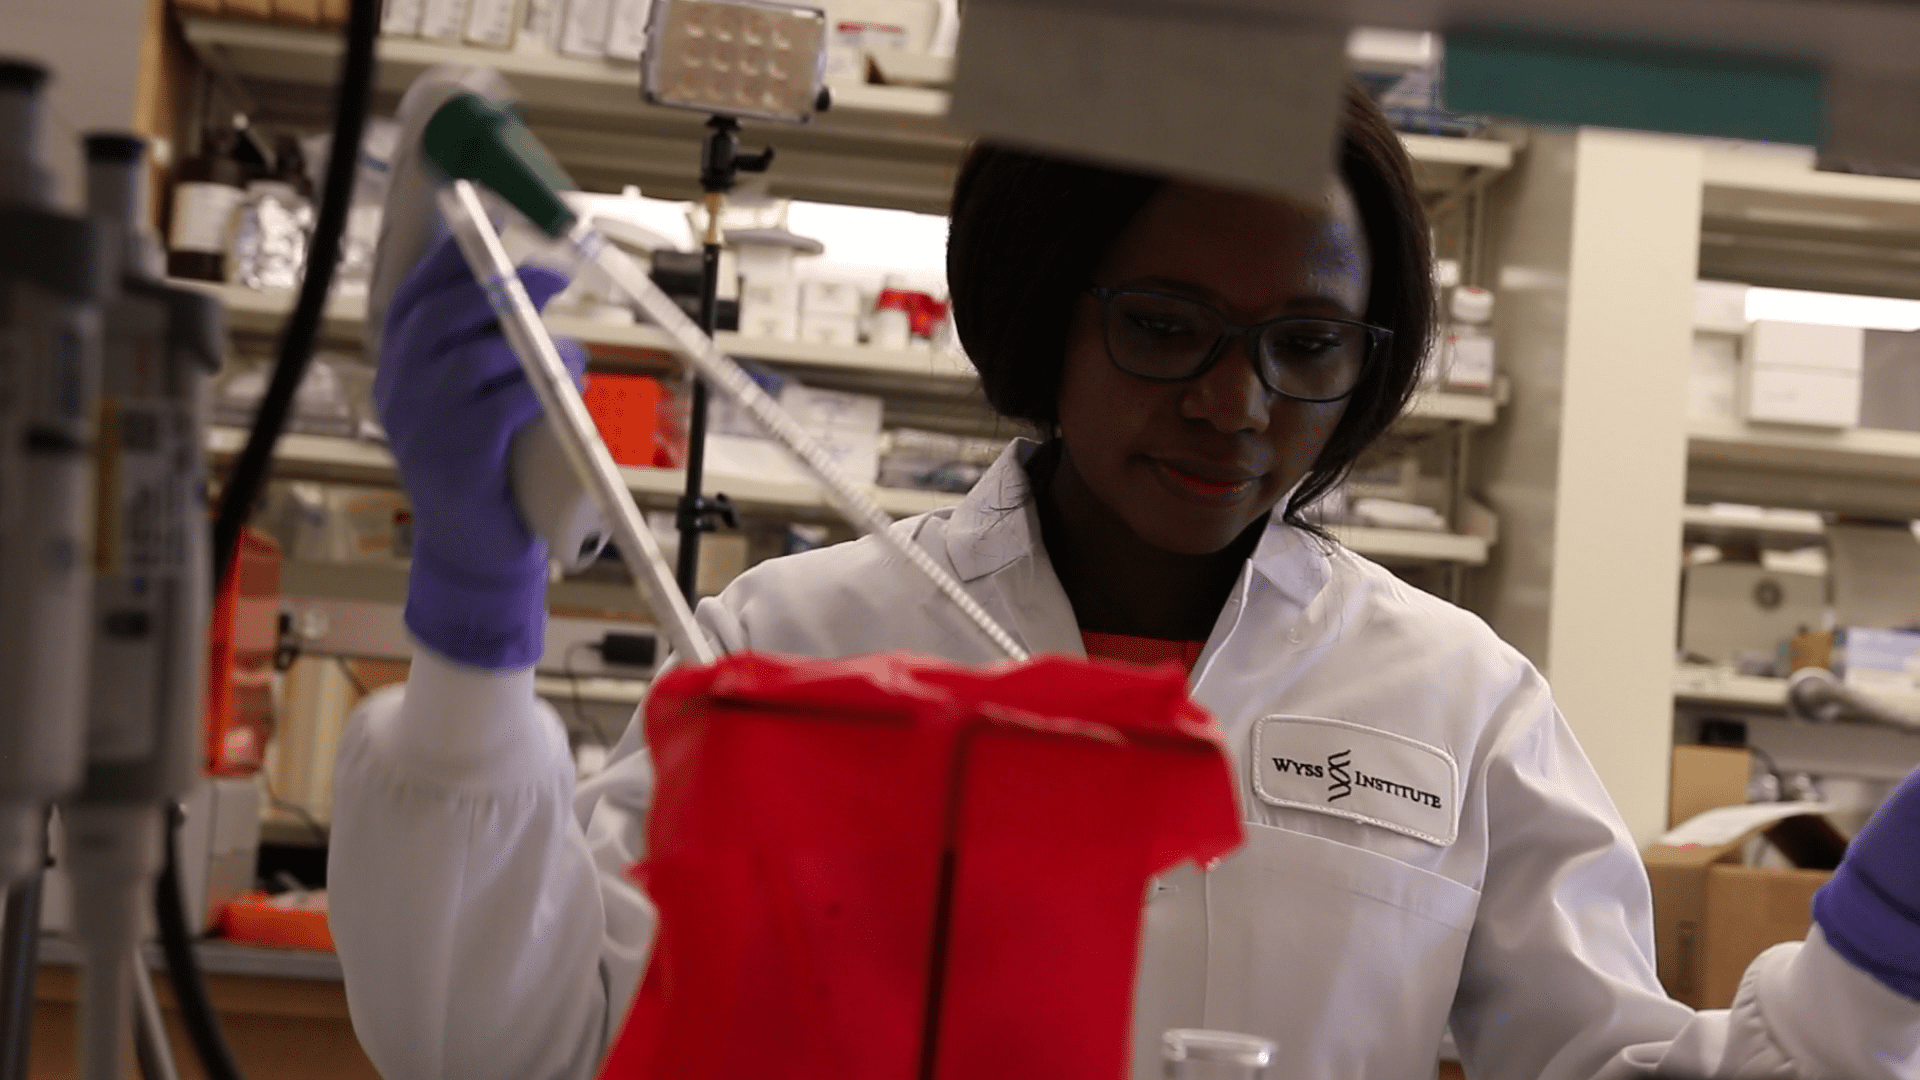
Having left a rain-soaked Bristol on Monday, I was greeted by an even more rain-soaked Boston on Tuesday. Fortunately, I spent my first day in the US under a roof at the Wyss Institute for Biologically Inspired Engineering. I was there to learn about an intriguing technology that reproduces the functionality of human organs on polymer chips about the size of a little finger.
Atomic clocks in France, Germany and the UK have been used to perform the best-ever confirmation of time dilation as set out in Einstein’s special theory of relativity. The clocks have been connected recently by optical-fibre links, which let the devices be compared to each other to an extremely high degree of statistical resolution. The work was done by an international team of physicists that says the test could still be improved further by several orders of magnitude.
The study uses the “Robertson–Mansouri–Sexl” (RMS) framework for violating special relativity. RMS assumes that there is a preferred reference frame in which the average speed of light measured on a return journey (there and back again) between two points is constant in all directions. RMS contradicts special relativity in all other reference frames by assuming that the average speed of light of a return journey varies according to a formula involving the velocities of those frames relative to the preferred frame.
Different directions
As the Earth rotates, different points on its surface have different velocities relative to the centre of the Earth. Points at different longitudes, for example, move in different directions, while points at different latitudes move at different speeds. As a result, sending signals between atomic clocks at two different points on Earth could reveal RMS violation.
The measurement involved optical lattice clocks at LNE-SYRTE in Paris, the PTB standards-lab in Braunschweig and the National Physical Laboratory (NPL) near London. The clocks are connected by two different fibre links – one running from NPL to LNE-SYRTE and the other from PTB to LNE-SYRTE.
The protocol for comparing the frequencies of optical clocks at two different locations can be described as sending a frequency signal from one clock to the other, where it is received and then sent back. In the RMS framework, the shift in frequency of the returned signal will contain a term that involves the difference between the velocities of the atomic clock locations. Because the Earth rotates once a day, the velocities of the two locations – and therefore the RMS frequency shift – will oscillate with a period of 24 h.
Time dilation
In one test, the team compared clocks located at LNE-SYRTE and NPL for 60 h. The researchers also compared clocks at PTB and LNE-SYRTE for 150 h. These comparisons let the team place an upper limit on the RMS violation of special relativity at about one part in 100 million. Specifically, this puts limits on the violation of the special-relativity concept of time dilation, which spells out how the elapsed time between two events can be different when measured by observers in two different situations.
This latest result is a factor of two better than the previous limits on time-dilation violation, which was made using fast moving ions as clocks. Writing in Physical Review Letters the team states: “As clocks improve, and as fibre links are routinely operated, we expect that the tests initiated in this Letter will improve by orders of magnitude in the near future.”
Stateside ceremony: Susan Curtis from IOP Publishing (right) picks up the award on behalf of Louise Mayor for her article “Where people and particles collide” from SIPA president Cynthia Carter in Washington DC.
The article examined long-standing attempts by members of the LGBT CERN group at the CERN particle-physics lab near Geneva to become an official “CERN Club” – a request that was denied. It also reported how the group had received some negative reception at CERN, as evidenced by a poster-defacement campaign, photos of which were published in the article.
Cryptic quantum communications for moving aircraft
The potential of using satellites for secure quantum communication has been demonstrated in a proof-of-concept study by researchers in Canada. Thomas Jennewein from the University of Waterloo and colleagues successfully sent quantum key distribution (QKD) transmissions from the ground to a moving aircraft for the first time. QKD uses the laws of quantum mechanics to guarantee complete security when two people exchange a cryptographic key using photons. If the key is read by a third party, this act of measurement will fundamentally change the nature of the key – thereby alerting the two correspondents to the presence of the eavesdropper. On the ground, QKD transmissions can be sent via optical fibres but their range is limited to a few hundred kilometres because of absorption losses. While free space links have been shown to work over ground in both stationary and moving tests, they are also limited to a few hundred kilometres – instead being held back by atmospheric absorption and turbulence, and the need for a clear line of sight. However, these drawbacks could be avoided by using satellites outside the Earth’s atmosphere. Jennewein and team therefore developed a system suitable for a satellite. Restricted to testing the system on Earth, the researchers set up a transmitter on the ground and used a Twin Otter aircraft to fly the receiver over it at angular rates similar to those of low-orbit satellites. They successfully achieved a quantum link for seven of their 14 passes and were able to extract the secret key for six of them. “This is an extremely important step, which took almost eight years of preparation,” explains Jennewein. “We have proved the concept, and our results provide a blueprint for future satellite missions to build upon.” The study can be found in Quantum Science and Technology.
Artificial intelligence boosts X-ray probe
Machine learning has been used to improve how X-ray pulses are used to study molecular dynamics. The new technique was developed by an international team of researchers and tested using data from the Linac Coherent Light Source (LCLS-1) free electron laser (FEL) at SLAC in the US. Trains of X-ray pulses lasting just 10–15 fs are produced at LCLS-1 and can be used to study chemical reactions and changes in molecular structure on very short timescales. However, the processes involved in producing the pulses are inherently unstable, and the intensity and timing of the pulses can vary by as much as 100%. This means that large amounts of measurement data from molecular studies are difficult to interpret and have to be discarded. One way around this problem is to determine the properties of the pulses as they are produced. But this can interfere with the experiment and will become increasingly difficult to do with the shorter pulses that will be produced by next-generation X-ray sources. Now, Alvaro Sanchez-Gonzalez and Jon Marangos of Imperial College London and colleagues have developed a new artificial intelligence-based technique that can accurately predict the properties of the X-ray pulses based on real-time measurements of certain properties of the FEL. Crucially, these measurements can be made fast enough to match the rate at which the X-ray pulses are delivered. “For current instruments, which generate about a hundred pulses per second, sometimes up to a half of the data is unusable,” explains Sanchez-Gonzalez. “This problem will only be compounded in next-generation instruments, such as the European XFEL or LCLS-II, designed to generate hundreds of thousands of pulses per second.” He adds, “Our method effectively resolves the problem, and should work on the new instruments as well as the older ones we tested it on. This will allow useful data to be gathered up to a thousand times faster.” The technique is described in Nature Communications.
Coldest object in the universe born in stellar collision
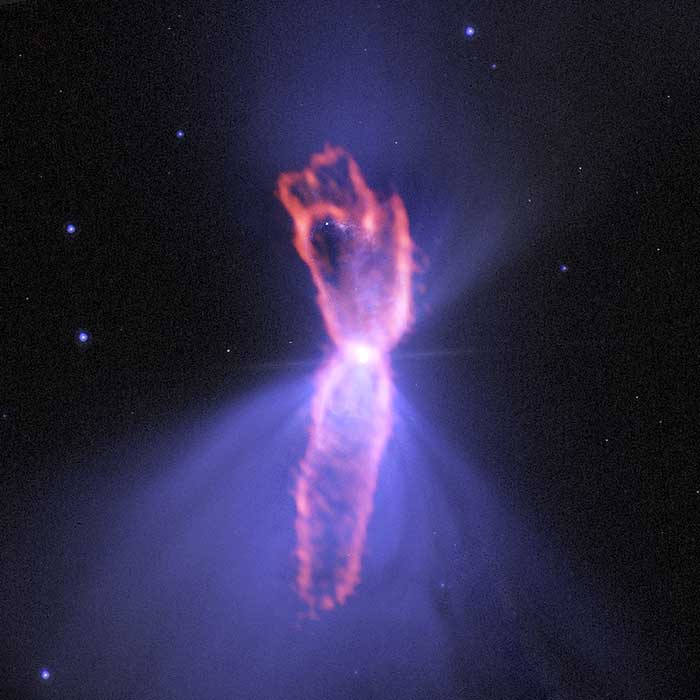
Cold return: composite image of the Boomerang Nebula taken by ALMA and the Hubble Space Telescope (Courtesy: ALMA (ESO/NAOJ/NRAO); NASA/ESA Hubble; NRAO/AUI/NSF)
Astronomers working on the Atacama Large Millimeter/submillimeter Array (ALMA) in Chile have come up with an explanation of how the Boomerang Nebula – described as the coldest object in the universe – formed. Recent observations with ALMA allowed the team to make precise calculations of the nebula’s extent, age, mass, and kinetic energy. The results suggest that the spectacular outflow of gas and dust was created when a small companion star plunged into the heart of a red giant, ejecting most the matter of the larger star. “These new data show us that most of the stellar envelope from the massive red giant star has been blasted out into space at speeds far beyond the capabilities of a single, red giant star,” said Raghvendra Sahai of NASA’s Jet Propulsion Laboratory. “The only way to eject so much mass and at such extreme speeds is from the gravitational energy of two interacting stars, which would explain the puzzling properties of the ultracold outflow.” Wouter Vlemmings of Chalmers University of Technology in Sweden adds “The extreme properties of the Boomerang challenge the conventional ideas about such interactions and provide us with one of the best opportunities to test the physics of binary systems that contain a giant star.” Discovered in 1995, the nebula is an outflowing of gas and dust that is about 10 times faster than could be produced by a single star. The temperature of the outflow is less than half a degree kelvin. This is much colder than deep space, which is about 2.7 K. The study is reported in the Astrophysical Journal.
CERN in Switzerland has hosted 22 high school students from Hungary in a pilot programme designed to show teenagers how science, technology, engineering and mathematics is used at the particle physics lab. The new High-School Students Internship Programme (HSSIP) is being developed by CERN’s Education, Communications & Outreach group and is aimed at students age 16–19. The first group of students was selected by a national committee in Hungary, who chose 22 participants from more than 50 applicants. The students were accompanied by Hungarian mentors and worked on their own projects in particle physics – as well as touring the CERN facilities. “It is wonderful to get out of the classroom where everything is in theory and to see how things are happening in the real world,” says student Balazs Mehes. Another participant, Daniel Nagy, says “I definitely want to come back here one day as an engineer.” Bulgaria and France will be the next countries to participate in HSSIP and will be sending students to CERN in September. France and Norway will also take part in 2017 and the programme will be rolled out to all 22 CERN member states over the next few years.
Is having more female engineers in management always a good thing?
Research by Teresa Cardador suggests that female engineers are stereotyped into management roles (Courtesy: L Brian Stauffer)
While only about 15% of engineers working in the US are women, the number of female engineers in managerial roles is disproportionally larger than their overall representation in the workforce. This might seem like a victory for gender equality, but Teresa Cardador of the University of Illinois at Urbana-Champaign says that this overrepresentation could be creating a segregated workplace in which women tend to perform managerial roles and men technical roles. “There are typically two career paths in engineering organizations – technical or managerial,” explains Cardador. “So you can look at it in two ways: either women are more likely to move into managerial roles in engineering firms, or they’re less likely to stay in technical roles.” Cardador interviewed more than 60 engineers and the results suggest that gender segregation could be caused by engineering firms valuing technical prowess over management skills. “In engineering, technical ability is revered while management is what you do if you have good organizational and communication skills,” she explains. “Women are stereotyped as having less technical competence in engineering, which perhaps explains why men are much more likely to remain on the technical side and women are tracked into the management side,” she said. As well as losing touch with the highly valued technical aspects of their profession, Cardador found that female engineers in management roles also find it more difficult than technical staff to balance work with family responsibilities. “All of these things combined have the potential to increase a woman’s chances of leaving the profession, which may ultimately make the goal of retaining female engineers in engineering firms more tenuous.” The research is described in Organization Science.
Exoplanet “twins” are nearly identical
Prince and pauper: almost identical exoplanets could have different pasts. Gas giant exoplanet WASP-67 b is nearly identical to HAT-P-38 b but has a cloudier atmosphere. (Courtesy: NASA, ESA, Z Levy)
Two almost identical exoplanets have surprised astronomers by having one unexpected difference – one is cloudier than the other. The gas giants – WASP-67 b and HAT-P-38 b – are nearly the same in size and temperature. They are also both in tight orbits (roughly 4.5 Earth days) around very similar yellow dwarf stars and are both tidally locked – the same side always faces the parent star. Therefore, when studying the two “hot Jupiter” exoplanets with the NASA’s Hubble Space Telescope, Giovanni Bruno from the Space Telescope Science Institute in the US and colleagues expected them to have nearly identical atmospheres. Instead, the chemical spectra of the planets indicated that WASP-67 b had more clouds at the altitudes measured by Hubble’s instruments. “We don’t see what we’re expecting,” says Bruno, “and we need to understand why we find this difference.” Hubble’s Wide Field Camera 3 looked at the spectral signature of water as a measure of the amount of clouds in the atmosphere – as WASP-67 b has more clouds, it had a lower water signal. “This tells us that there had to be something in their past that is changing the way these planets look,” Bruno explains. The team suggests that the planets formed differently and under different circumstances, and future observations with Hubble and the soon-to-be-launched James Webb Space Telescope will help astronomers understand what makes a planet cloudy or clear. The findings were presented at the 230th meeting of the American Astronomical Society in Austin, Texas.