The cover story in the September 2016 issue of Physics World magazine – now live in the Physics World app for mobile and desktop – reveals the fascinating new field of “crowd breath research”, which can even shed light on how cinema audiences react during the changing scenes in a movie. You can read the article here on physicsworld.com too.
The September issue also shows how to do crystallography without crystals, explains how first data from the Gaia spacecraft could revolutionize astronomy (see the above video for more on that), and contains one physics teacher’s fascinating story about what she did to change her school’s gender balance.
Don’t miss either reader feedback on the potential impact of Britain leaving the EU on physics or Robert P Crease’s Critical Point column on why science denial is one of the most important issues in the US presidential campaign.
Back in Christmas 2013, the CineStar cinema in Mainz, Germany, became an impromptu, oversized laboratory. Over the course of 108 screenings of 16 films, it hosted an unprecedented experiment on about 9500 moviegoers. Not that most of them noticed, or even knew they were under scrutiny. Science was likely the last thing on their brains as they flocked to the cinema to see the German hit Buddy or blockbusters such as The Hunger Games: Catching Fire and The Hobbit: the Desolation of Smaug.
But Jonathan Williams, an atmospheric chemist at the Max Planck Institute for Chemistry, whose research has taken him around the world, went to his local cinema in search of a story that wasn’t being shown on a screen. He was looking for a story told by the breath of a crowd. He chose the screening room of a cinema because it’s well contained. “It’s really just a box full of people,” he says.
Breath contains valuable information, if one can figure out how to decode it. When excited, we emit more carbon dioxide. After a swig of beer, we exhale ethanol in proportion to the amount in our blood. Our breath reveals if we’ve recently eaten an apple or smoked a cigarette. A human breath contains on average more than 200 easily measured volatile organic compounds (VOCs) – chemicals that exist in a gaseous state at room temperature. Most of those are inhaled initially, but many are generated by living cells and metabolic processes in the body. Not every breath is identical: researchers have identified thousands of individual chemicals that fluctuate depending on where people are, what they’re doing, and how their bodies work. A VOC may be innocuous or harmful; natural or synthesized.
“The breath is basically garbage,” says Joachim Pleil, an analytical chemist with the US Environmental Protection Agency at Research Triangle Park in North Carolina, US, and editor-in-chief of the Journal of Breath Research. “You breathe it out, you ignore it.”
A person’s breath may reveal truths they prefer to keep secret – like how many drinks they’ve consumed. In medicine, researchers are also investigating breath’s chemical signatures as potential biomarkers for diseases or ways to gauge a person’s health. Pleil points out that doctors have been using breath analysis for a long time: about 2400 years ago the Greek physician Hippocrates described foetor hepaticus or “the breath of the dead” – now understood to be a late sign of liver failure.
“Traditionally, breath research has focused on one person, and one breath,” says Pleil. “The hope has been to say something about an individual based on what they’re breathing out.”
Williams’ work is a departure from that model. At the CineStar, Williams wasn’t interested in individual-level data. He sought meaning through the large-scale analyses of the breath of large groups. In a recent Journal of Breath Research editorial he co-authored with Pleil, the scientists call their method “crowd-based breath analysis” (2016 J. Breath. Res.10 032001). The researchers say the method could be useful in many fields, from helping advertisers gauge an audience’s emotional response to a new product, to differentiating between healthy and unhealthy VOC profiles, to identifying people who may pose a threat of some kind. “There is huge potential for discovery within crowd breath research,” they wrote.
Watching the watchers
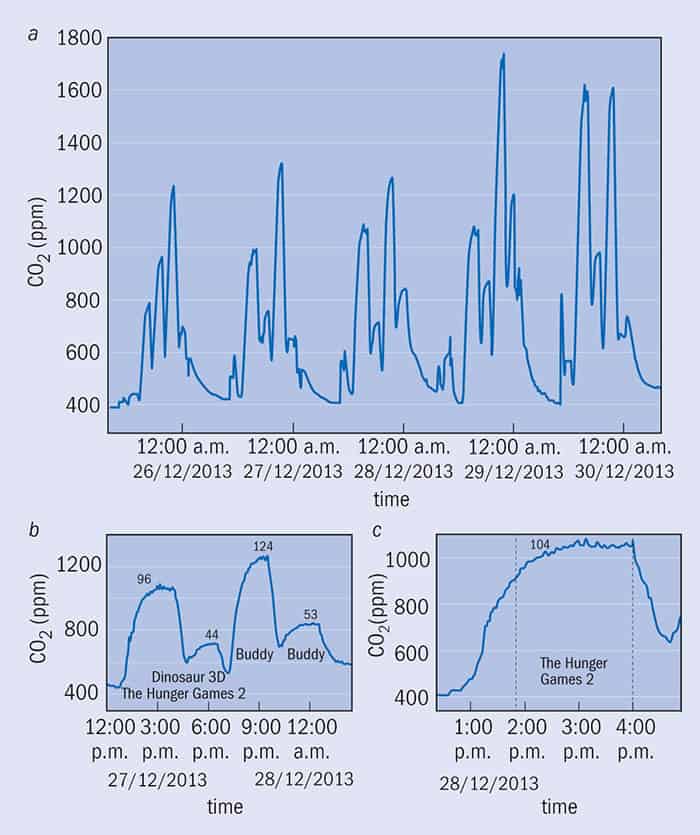
Like other theatres, CineStar in Mainz uses a ventilation system that pumps fresh air in through the floor and out through ceiling vents. Williams and his crew installed two devices in the outgoing ceiling ducts: an infrared gas analyser, which measured the airborne concentration of carbon dioxide (figure 1), and a proton transfer reaction time-of-flight mass spectrometer, which measured the traces of more than 100 other gases (see “The science behind crowd-based breath analysis”, below). The scientists collected real-time measurements of VOC levels every 30 seconds of a film as audiences laughed, gasped and were startled. Afterwards, they aligned individual measurements with a description of the film’s plot, broken down into 30 s chunks (2016 Scientific Reports6 25464 ).
1 Cinematic rhythm Selected sections of the CO2 measurements for (a) 5 days, (b) one day and (c) one film. The numbers above the peaks indicate the number of people in the audience. (Adapted from Scientific Reports6 25464)
Molecules associated with popcorn and fizzy drinks didn’t change throughout the movie. Predictably, the researchers found that carbon-dioxide levels rose and fell as audiences filled and emptied the screening rooms, respectively. So did levels of acetone and isoprene, two common by-products of metabolism. (Acetone is a by-product of fat catabolism, and isoprene is exhaled as the body makes cholesterol.) The scientists also observed that the VOC levels didn’t follow smooth curves; they were punctuated with small peaks.
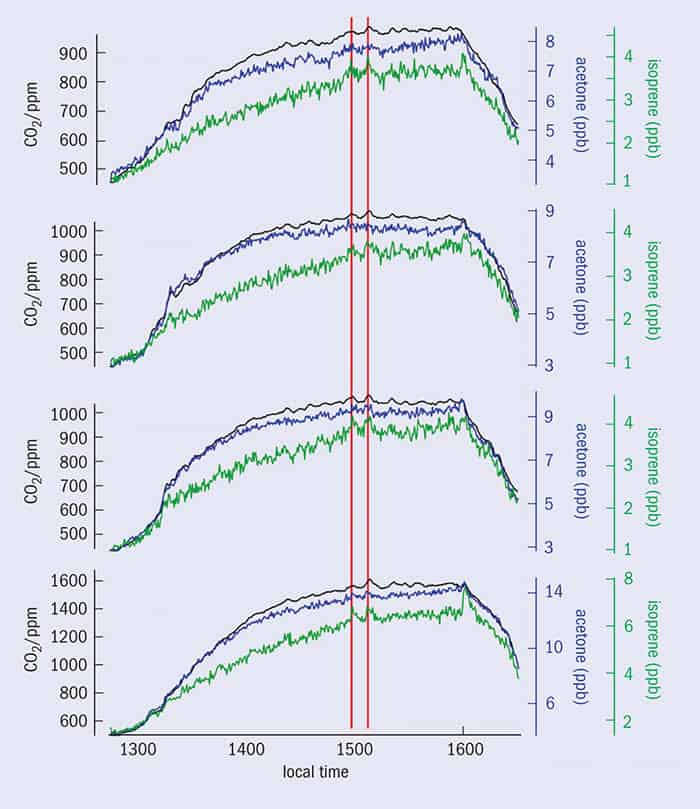
Williams suspected those peaks revealed something about how people reacted to the movie. Following that hunch, he and his team identified scenes connected to these VOC peaks – such as when Katniss’ dress ignites or the final battle begins in The Hunger Games: Catching Fire. The same peaks appeared at every screening, every day, as though during those times all the audiences were breathing in synchrony (figure 2). That repetition of the pattern gave Williams confidence that the connection they were seeing was both substantial and reproducible.
2 Fingerprint of a film Measurements of CO2, isoprene and acetone taken during four separate screenings of The Hunger Games: Catching Fire. The red lines indicate significant scenes. (Adapted from Scientific Reports6 25464)
Williams and his team then set out to see if the relationship between movie scenes and VOC emissions was causal. They annotated each 30 s interval of the films with descriptive labels that identified the genre or action of the scene. (“Comedy” or “chase”, for example.) Then, using the Mogon supercomputer in Mainz, they created a model based on two-thirds of the data that connected scene descriptions to VOC levels. For the remaining third of the data, they fed the VOC levels into their model to see if they would successfully predict scene descriptions and so prove a causal relationship. They found that VOC levels most successfully predicted scenes described as “suspense” or “comedy”. Scenes labelled “chase” and “romance”, on the other hand, weren’t significantly linked to VOCs.
Norman Ratcliffe, who has spent more than two decades analysing volatiles in gas, urine, faeces and blood at the University of the West of England in Bristol, UK, thinks Williams’ crowd-based methods have the potential to help interpret what breath VOCs can tell us. “It sounds like a very good approach,” he says. And it’s efficient, to boot: “You get the responses of hundreds of people in just one measurement.”
Into the real world
The vast majority of VOCs in the atmosphere are produced by vegetation, so Williams’ research typically takes him to verdant locales such as the Amazon rainforest or boreal forest in Finland. He’s studied pollution in Beijing, China, and later this year he’ll begin studying oil industry pollution and emissions in the Persian Gulf. The cinema project, he says, was borne of a natural question: how does human breathing affect the chemical composition of the atmosphere?
As it turns out, it doesn’t. “The amount [of VOCs] we emit as human beings is actually a very small amount,” he says. However, the question had led him to wonder if he could find some way to gauge human contributions. In April 2012 Williams’ team had used a mass spectrometer to measure VOCs during a football match at the Coface Arena in Mainz. Hoping to see a surge in carbon dioxide after a goal, the scientists had been disappointed when their data didn’t deliver. That project led Williams to think about running a similar experiment in a smaller space – like a cinema.
The new findings, as a proof of concept, suggest VOCs may be used to gauge human emotion, though the field is still in its early days. In addition to marketing, that idea may influence other fields. Pleil, who had been working on a series of papers about cellular respiration when he first met Williams, sees possibilities in health and threat assessment. Crowd breath analysis could help scientists describe a baseline VOC profile, in order to be able to use breath to identify individuals exposed to harmful substances. In health care, a person with a toxic VOC exposure might get treatment before symptoms begin. In security, a person queuing at an airport with jet fuel VOCs on their breath might be detained for questioning. (Do they work at an airport, or have they just built a dirty bomb?)
“This could be a valuable resource for trying to deduce what people think without giving them the opportunity to lie about it,” says Pleil.
Although Williams is soon heading to the Middle East, his work with VOCs and films already has a sequel: he’s currently sitting down with data collected during screenings of Star Wars: the Force Awakens. May the breath be with him.
The science behind crowd-based breath analysis
The wisdom of the crowds may be in our breath: recent research at Jonathan Williams’ lab at the Max Planck Institute for Chemistry in Mainz, Germany, shows a new way to study volatile organic compounds, or VOCs, generated by crowds in a cinema.
Joachim Pleil, at the US Environmental Protection Agency, says researchers can use two kinds of analysis for studying gas composition: offline and real-time. With offline analysis techniques, scientists have to collect a sample and take it to a lab. Real-time analysis happens as the sample is being created. “What Jonathan is doing probably would be difficult, if not impossible to do, with offline analysis,” he says. “The value of crowd breath is only apparent and can only be realized if you have online analysis.”
Gone with the wind Ventilation pipes can be used to analyse a crowd’s breath. (Courtesy: iStock/chinaface)
To measure carbon dioxide, the scientists used infrared spectroscopy, which beams infrared light through a sample. The carbon-dioxide molecules absorb this light at frequencies corresponding to their vibrational modes, so the difference between the initial and final infrared light translates to a measurement of the amount of carbon dioxide.
For the VOCs, Williams and his crew needed something more sophisticated to measure hundreds of VOCs every 30 seconds. That meant collecting high-resolution data in real time. There are many different tools for that purpose, but they selected proton transfer reaction time-of-flight mass spectrometry (PTR-MS), a real-time technology that was first developed in the 1990s by physicists at Innsbruck University in Austria. PTR-MS can measure even minuscule traces of a suite of airborne VOCs.
The tool first creates ions by attaching extra protons to molecules of ordinary water. Then it sends the ionized water vapour through a sample of air. When the ions collide with ordinary atmospheric ingredients such as nitrogen or oxygen, nothing happens. But when they collide with VOC molecules, the proton attaches itself to the VOC. That’s because most VOCs have a higher proton affinity than water, and gases such as nitrogen and oxygen have a lower proton affinity than water. With the protons attached, the tagged VOCs can then be measured in real time by a mass analyser, which identifies the individual varieties of VOC. “We use this method widely, and it measures fast,” says Williams.
Aiming high: Zhen Cao explains how to use a mountain to detect tau neutrinos.
By Hamish Johnston in Beijing
This evening I had dinner with Zhen Cao, who is one of China’s leading particle astrophysicists and works at the Institute of High Energy Physics of the Chinese Academy of Sciences here in Beijing.
Cao has found a great way to combine his passion for mountains and neutrinos: the Cosmic Ray Tau Neutrino Telescope (CRTNT), which, if built, will use an entire mountain in western China as a cosmic neutrino detector.
The United States National Labor Relations Board (NLRB) ruled last week that graduate students in private universities and colleges, who work as teaching or research assistants, are statutory employees of their institutions who have the right to join unions. The decision, made in response to a plea by graduate students at Columbia University, overturns a 2004 decision that denied the students union rights. Groups of student assistants have already reacted to the decision by filing for certification of local unions to represent them.
Tremendous victory
“Graduate employees deserve a seat at the table and a voice in higher education. Collective bargaining can provide that,” says Howard Bunsis, who chairs the American Association of University Professors’ Collective Bargaining Congress. “This is a tremendous victory for student workers.” Not surprisingly, representatives of private universities disagree. “We are disappointed that [the decision] has overruled years of precedent finding that graduate students are not employees for unionization purposes,” says Stanford University spokesman Brad Hayward.
The issue before the board focused on the relevance of the work that student teaching assistants carry out to their overall education. Students argued that their teaching duties are independent of, and can actually detract from, their research. “I took a lot of my time preparing lectures,” Mickey McDonald, a Columbia physicist who has just defended his doctoral research on ultracold molecules, told physicsworld.com. “And grading undergraduates’ lab reports can take up to 15 hours per week.” The ability to join unions, students added, will allow them to negotiate liveable stipends and working hours. They also pointed out that teaching assistants at state universities can already unionize, because they are protected by local state laws, and that the private New York University voluntarily unionized in 2013.
Influencing issues
Columbia University authorities countered that teaching assistantships give graduate students the skills and expertise they will need in future careers as researchers and teachers. Participation in collective bargaining, they added, could destroy the traditional mentor–student relationship. Indeed, they raised the possibility that student-assistants’ unions could influence issues beyond students’ economic situations – by trying to negotiate class sizes taught by teaching assistants, for example, or the details of examinations they mark. Prominent research universities such as Harvard, MIT and Princeton supported the Columbia arguments in “friends-of-the-court” briefs.
Graduate employees deserve a seat at the table and a voice in higher education. Collective bargaining can provide that
Howard Bunsis, chair, American Association of University Professors' Collective Bargaining Congress
In its 2004 decision on a case brought by Brown University student assistants, the NLRB largely agreed with those arguments. The board rejected the idea that student assistants could be considered employees of their universities because they “are primarily students and have a primarily educational, not economic, relationship with their university”. Last week’s decision rejected that thinking by a three-to-one majority. The 2004 decision, the board commented, had “deprived an entire category of workers of the protections of the National Labor Relations Act without a convincing justification”.
Pros and cons
Krista Freeman, a graduate student in physics at Carnegie Mellon University, who chairs the American Physical Society’s Forum on Graduate Student Affairs, welcomes the decision. “Many aspects of graduate student life are unsavoury and uncertain, and collective bargaining power could go a long way to correcting these issues,” she says. “This can only lead to healthier, happier and more financially stable students.”
Universities remain unconvinced. In a letter to the Columbia University community following last week’s decision, provost John Coatsworth speaks of the potential benefits and drawbacks of having student assistants’ interests represented by the United Auto Workers (which now focuses on employees beyond the car industry). “I am concerned about the impact of having a non-academic third party involved in the highly individualized and varied contexts in which faculty teach and train students in their departments, classrooms and laboratories,” he writes. Harvard University agrees. “We continue to believe that the relationship between students and the university is primarily about education, and that unionization will disrupt academic programmes and freedoms, mentoring and research at Harvard,” an official statement notes.
Nevertheless, the move to unionize has already started. On Monday, graduate students in 10 Yale University departments, including physics, geology and geophysics, and mathematics, filed a petition to the NLRB requesting certification of a local union to represent them.
Computers based on quantum processes have the potential to be exponentially more powerful than today’s computers. At present, research groups across the world are exploring various different approaches to creating quantum computers – a difficult technological challenge given the delicate nature of quantum systems. In this video, Andrea Morello explains the approach taken by his group at the University of New South Wales in Australia, which is inspired by classical computing. It involves encoding data into the spins of phosphorous atoms embedded within silicon microchips.
This video is part of our 100 Second Science series, in which researchers give concise presentations covering the spectrum of physics.
Blowing up: a powerful extratropical cyclone east of Japan in January 2013. (Courtesy: NASA)
A new type of rare deep-Earth tremor, created by fast-developing ocean storms, has been detected by researchers from Japan. The signals from this kind of faint Earth tremor – known as an “S-wave microseism” – may provide geophysicists with a new tool to study not only oceanic storms but also the Earth’s interior.
First observed in the 1940s, microseisms are faint Earth tremors generated by the sloshing of ocean waves on the sea floor during storm events. The strongest microseisms are generated by the interaction of directly opposing wave systems. These create pressure excitations that travel almost unattenuated to the sea floor because of the nonlinear effects of the fluid – unlike with normal ocean surface waves, which decay with depth.
Seismic signals
Microseisms – which are observed globally – may either travel across the surface of the Earth, or through its interior as body waves. Like the seismic waves generated by earthquakes, these body waves may either be compressional (P-waves) or transverse (S-waves) – although until now, because of their larger amplitude, only the former had been observed – and, unlike surface-wave microseisms, can be tracked back to their point of origin.
In their study, Kiwamu Nishida of the University of Tokyo and Ryota Takagi of Tohoku University looked at a special kind of small, fast-developing extra-tropical cyclone colloquial dubbed a “weather bomb”. Seismic signals from one of these storm events – which developed in the North Atlantic between Iceland and Greenland in the December of 2014 – were recorded on the Japanese High Sensitivity Seismograph Network. The researchers found signals not only of P-wave but also S-wave microseisms, both in vertically (SV) and horizontally (SH) polarized forms. While modelling had only predicted the creation of SV waves, the researchers believe that the SH waves may be generated by the repeated reverberation of shear waves in poorly layered shallow sediments on the ocean floor.
The discovery of S-wave microseisms may offer a new way of understanding the nature of these couplings between the atmosphere and deep Earth. “The energy ratio between P- and S-wave microseisms is crucial for inferring the excitation mechanism,” says Nishida. For example, he explains, “excitation sources on the sea surface excite P-waves dominantly, whereas excitation sources on the seaf loor excite larger S-waves.”
Crustal analyses
At the same time, the shorter wavelengths of S-wave in comparison to P-wave microseisms make them more sensitive to temperature, pressure and resultant composition changes within the Earth – potentially allowing for more detailed analyses of crust and upper-mantle structures.
“The excitation of transverse surface waves – Love waves – had been established before, but because of the small amplitude of body waves compared to surface waves, the observations of Nishida and Takagi are a surprise,” says Roel Snieder, a geophysicist at the Colorado School of Mines, who was not involved in this study. “Since array techniques are in general quite robust, their detection of SH waves is convincing.”
With their initial study complete, the researchers are now looking to develop new methods to use body-wave microseisms to explore the nature of the Earth’s interior beneath oceanic storms. To this end, they are presently compiling a catalogue of storm events, similar to the weather bomb already examined, for use in such studies.
It’s a lovely warm evening here in Beijing. I have just arrived for an action-packed visit in which I will have a chance to meet some of China’s top physicists and science policy makers.
Over the next few days I’m looking forward to meeting people at the Chinese Physical Society (CPS), the China Association for Science and Technology (CAST), the Ministry of Science and Technology of China (MOST), the National Natural Science Foundation of China (NSFC) and more.
A debate that has been raging for 20 years about whether a certain interaction between photons can be used in quantum computing has taken a new twist, thanks to two physicists in Canada. The researchers have shown that it should be possible to use “cross-Kerr nonlinearities” to create a cross-phase (CPHASE) quantum gate. Such a gate has two photons as its input and outputs them in an entangled state. CPHASE gates could play an important role in optical quantum computers of the future.
Photons are very good carriers of quantum bits (qubits) of information because the particles can travel long distances without the information being disrupted by interactions with the environment. But photons are far from ideal qubits when it comes to creating quantum-logic gates because photons so rarely interact with each other.
One way around this problem is to design quantum computers in which the photons do not interact with each other. Known as “linear optical quantum computing” (LOQC), it usually involves preparing photons in a specific quantum state and then sending them through a series of optical components, such as beam splitters. The result of the quantum computation is derived by measuring certain properties of the photons.
Simpler quantum computers
One big downside of LOQC is that you need lots of optical components to perform basic quantum-logic operations – and the number quickly becomes very large to make an integrated quantum computer that can perform useful calculations. In contrast, quantum computers made from logic gates in which photons interact with each other would be much simpler – at least in principle – which is why some physicists are keen on developing them.
This recent work on cross-Kerr nonlinearities has been carried out by Daniel Brod and Joshua Combes at the Perimeter Institute for Theoretical Physics and Institute for Quantum Computing in Waterloo, Ontario. Brod explains that a cross-Kerr nonlinearity is a “superidealized” interaction between two photons that can be used to create a CPHASE quantum-logic gate.
This gate takes zero, one or two photons as input. When the input is zero or one photon, the gate does nothing. But when two photons are present, the gate outputs both with a phase shift between them. One important use of such a gate is to entangle photons, which is vital for quantum computing.
The problem is that there is no known physical system – trapped atoms, for example – that behaves exactly like a cross-Kerr nonlinearity. Physicists have therefore instead looked for systems that are close enough to create a practical CPHASE. Until recently, it looked like no appropriate system would be found. But now Brod and Combes argue that physicists have been too pessimistic about cross-Kerr nonlinearities and have shown that it could be possible to create a CPHASE gate – at least in principle.
From A to B via an atom
Their model is a chain of interaction sites through which the two photons propagate in opposite directions. These sites could be pairs of atoms, in which the atoms themselves interact with each other. The idea is that one photon “A” will interact with one of the atoms in a pair, while the other photon “B” interacts with the other atom. Because the two atoms interact with each other, they will mediate an interaction between photons A and B.
Unlike some previous designs that implemented quantum error correction to protect the integrity of the quantum information, this latest design is “passive” and therefore simpler.
Brod and Combes reckon that a high-quality CPHASE gate could be made using five such atomic pairs. Brod told physicsworld.com that creating such a gate in the lab would be difficult, but if successful it could replace hundreds of components in a LOQC system.
As well as pairs of atoms, Brod says that the gate could be built from other interaction sites such as individual three-level atoms or optical cavities. He and Combes are now hoping that experimentalists will be inspired to test their ideas in the lab. Brod points out that measurements on a system with two interaction sites would be enough to show that their design is valid.
The work is described in Physical Review Letters. Brod and Combes have also teamed-up with Julio Gea-Banacloche of the University of Arkansas to write a related paper that appears in Physical Review A. This second work looks at their design in more detail.
You may not know it, but apparently you have a dedicated region in your brain that is your “physics engine”. At least that is what cognitive researchers from Johns Hopkins University are suggesting after they have pinpointed a specific region of the human brain that intuitively understands physics – at least when it comes to predicting how objects behave in the real world. According to the team, the engine is kick-started when we observe physical events as they happen and is “among the most important aspects of cognition for survival”. Surprisingly, the region is not located in the brain’s vision centre, but is actually the same area we tap into while making plans of any type. In the video above, the team has created a little game for you to test your engine’s horsepower – go ahead and tell us how you did.
What physicist can resist making a back-of-the-envelope calculation to test an outlandish claim, especially if it involves a race between a car and gravity? In his recent Forbes blog, physicist Chad Orzel has sharpened his pencil to try to work out whether the Tesla Model S can accelerate to 100 km/h on the track in less time than it would if it was dropped from a height. The car is electric, which means that it should be much faster off the mark that a conventional vehicle. But, “Can a Tesla Model S really accelerate faster than gravity?”.
What’s the difference between a dazzling display of the aurora borealis and a lawnmower? Not much, it seems, if you use a geomagnetic sensor operated by AuroraWatch at the University of Lancaster in the UK. On Tuesday the organization sent out a “red alert” to its e-mail subscribers telling them to look out for a big show of the northern lights. But alas, the apparent huge spike in geomagnetic activity seen in the AuroraWatch sensors was actually caused by the operation of a nearby lawnmower. Can you imagine what would happen if someone accelerated nearby in a Tesla Model S? You can read all about it here: “Red alert cancelled”.
Particle pioneer: James Cronin at the 2010 Lindau Nobel Laureate Meeting. (CC BY-SA 3.0 Markus)
American nuclear-physicist James Cronin, who shared the 1980 Nobel Prize for Physics with Val Fitch, died on 25 August, at the age of 84. Cronin and Fitch – who died in February last year – were awarded the prize for their 1964 discovery that decaying subatomic particles called K mesons violate a fundamental principle in physics known as “CP symmetry.” The research pointed towards a clear distinction between matter and antimatter, helping to explain the dominance of the former over the latter in our universe today.
Born in Chicago, Illinois, on 29 September 1931, Cronin completed his BSc in 1951 at the Southern Methodist University in Dallas, where his father taught Latin and Greek. Cronin moved to the University of Chicago, where he graduated with a PhD in physics in 1955. While there, Cronin benefited from being taught by stalwarts of the field, including Enrico Fermi, Maria Mayer and Subrahmanyan Chandrasekhar.
After his doctorate, Cronin worked as an assistant physicist at the Brookhaven National Laboratory (BNL) until 1958, when he joined the faculty at Princeton University, where he remained until 1971. He then returned to the University of Chicago to become professor of physics. Cronin met Fitch during his time at BNL and it was Fitch who brought him to Princeton. While there, the duo aimed to verify CP symmetry using BNL’s Alternating Gradient Synchrotron (AGS) by showing that two different particles did not decay into the same products.
Verified violation
They planned on doing this by colliding proton beams into a metal target to produce many millions of short-lived and long-lived K mesons. The former would always decay into two pi mesons, while the latter would not. Instead, to their surprise, they spotted a “suspicious-looking hump” in the data, which showed that, on occasion (in 0.2% of the cases), the long-lived variety also decays into two pi mesons, thereby violating CP symmetry.
In recent years, Cronin was instrumental in the development of the Pierre Auger Project, which he conceptualized in 1992 with fellow physicist Alan Watson. The $50m cosmic-ray observatory is based in Argentina, and is designed to pick up ultra-high-energy cosmic rays as they travel at near-light speeds through the Earth’s atmosphere, producing “air showers” of other particles as they interact with atmospheric nuclei. It is currently the world’s largest cosmic-ray detector, with a 3000 km2 collecting area. Despite the fact, the observatory announced in December last year that it is set for a $14m upgrade, which will allow for more precise measurements of the mass of particles that make up cosmic rays, as well as trying to pinpoint their original source.