The distinctive folds of the human brain are the result of mechanical compression caused by growth during development, according to an international team of scientists. Using a 3D-printed gel model of the brain, the researchers have now shown that forces generated during expansion can create the brain’s wrinkled shape. This mechanical model was first proposed in 1975, but it has been difficult to test.
Highly folded brains are only seen in a small number of species, including some primates, dolphins, elephants and pigs. From an evolutionary perspective, the reason why the brain folds is quite simple – it maximises the number of neurons that can be squeezed into the space, while reducing the distance between them, which improves cognitive function. In humans, the outer layer of brain tissue – the grey matter or the “cerebral cortex” – starts to fold when the foetus is around 23 weeks old. The process where the cerebral cortex forms its folds, known as “gyrification”, continues until adulthood, when our brains stop growing. By this point the brain has increased about 20-fold in volume and 30-fold in surface area.
Grey-matter origami
While the purpose of gyrification is understood, the mechanism behind it is not. A number of biochemical and mechanical theories have been previously proposed, including one which suggests that folding is caused by mechanical tension generated in the neurons, but none have been proven. Tuomas Tallinen from the University of Jyvaskyla, Finland, together with colleagues in France and the US, now say the most likely explanation is the simplest one: the cerebral cortex expands faster than the rest of the brain, while changing little in thickness. Essentially, the cerebral cortex remains the same as its surface area grows. This produces compressive stress, which in turn leads to the mechanical folding of the cortex.
To test its theory, the team created a 3D cast of an unfolded 22 week-old human brain, based on MRI scans. This was used to create a gel model of the core of the brain, which was then coated in a thin layer of absorbent elastomer gel to represent the cerebral cortex. When immersed in solvent, the outer layer of the gel-brain swelled relative to the inner core and as the compressive forces built up it began to crumple. Tallinen told physicsworld.com that they “observed folding patterns that are qualitatively very similar to the folding patterns in foetal brains during the early stages of gyrification”.
After it had finished expanding, the model resembled a 34 week-old foetal brain. “The key parameters setting the size and qualitative appearance of the folds are the stiffness of the grey-matter top layer relative to white-matter substrate, and the thickness of the grey-matter layer relative to brain size,” says Tallinen. “More subtle is how the folds get oriented – the geometry of the foetal brain surface is a determinant for dominant orientations of the folds.”
Model material
Christopher Kroenke from the Oregon Health & Science University in the US, who was not involved in the research, says that similarities between the folds suggest that the “mechanical features of the model bear strong resemblance to those of the human brain” and that the “agreement between finite element calculations and experimental observations strongly supports that mechanical compression is the driving force behind folding in the model”. But he adds that further examination of the similarities and dissimilarities between the model material and foetal brain tissue “will be valuable for determining whether mechanical compression indeed drives folding of the cerebral cortex”.
David Van Essen from Washington University in St Louis, who first proposed the neuron tension-based theory, says that while the research “uses a clever combination of physical modelling and finite-element simulations to show that several features of human cortical folding can be emulated by a ‘buckling’ model”, it has a key limitation. “Their assumption that cortical thickness is fixed during massive tangential expansion is biologically implausible in the absence of a mechanism that could account for this highly anisotropic growth,” he explains. He adds that limited cortical thickness can be explained by mechanical tension along the neurons, as well as various patterns seen in the folds of the brain.
The Earth as seen by Himawari-8 earlier today. (Courtesy: JSA)
By Hamish Johnston
Who hasn’t wanted to float high above the Earth and gaze down on our planet as sunlight and clouds dapple across its surface. Thanks to the “Glittering Blue” animation, such views are not just for a privileged few astronauts. This stunning animation of one day’s observations from the Japanese weather satellite Himawari-8 has been put together by satellite-imagery analyst Charlie Lloyd. He has also included a nice FAQ page that explains some of the amazing phenomena captured by the satellite, including a huge tropical storm and the daily cloud cycles of a rainforest.
A new technique that uses diamonds and quantum logic to detect the tiny magnetic fields of single molecules has been unveiled by researchers in the US and Germany. The team then used the technique to detect nuclear magnetic resonance (NMR) signals from single molecules of a common protein. The researchers are now refining the method still further, and believe that it could reveal the currently unknown structures of some rare proteins.
Developed in the mid 20th century, NMR spectroscopy has become an immensely valuable tool for molecular analysis. “Maybe 50% of all structural information we have from complex molecules – proteins, for example – comes from NMR,” says Jörg Wrachtrup of the University of Stuttgart.
Traditional NMR involves placing the sample in a strong magnetic field, which causes atomic nuclei with dipolar magnetic moments to line up either parallel or antiparallel to the field. Radio waves of a particular frequency are then applied, causing the magnetic moments to oscillate between the two directions as they absorb the waves. The radio frequency depends on the chemical environment of the nucleus, so the absorption spectrum acts as a fingerprint of a molecule’s structure. However, there are downsides to the technique. It requires strong magnets, which are expensive. It is also a relatively insensitive technique, requiring trillions of molecules to produce a signal. As a result, conventional NMR is not useful for analysing rare proteins or looking at the variation between individual proteins in a sample.
Coupling spins
Zero-field NMR has recently been developed to make NMR spectroscopy less difficult and less expensive. Instead of studying the coupling of the nuclei to an external field, the technique records the molecular fingerprint created when neighbouring magnetic moments couple to one another. This in itself does not increase the sensitivity of the technique, but in 2013, two independent groups – one led by Wrachtrup – showed that a single nitrogen vacancy (NV) centre in diamond can detect a zero-field NMR signal from a tiny sample containing as few as 10,000 nuclear magnetic moments. A NV centre occurs when two adjacent carbon atoms in a diamond lattice are replaced with a vacancy and a nitrogen atom. NV centres are essentially tiny magnets that are isolated from their surroundings and can be manipulated using laser pulses.
In 2014, Mikhail Lukin and colleagues at Harvard University used NV centres to detect the magnetic moment of a single proton on the surface of a diamond. However, nobody had been able to detect the NMR signal from just one biomolecule.
Now, Lukin’s Harvard group has joined forces with Fedor Jelezko and colleagues at Ulm University in Germany to make two key innovations to the NV technique. First, they improved the sensitivity of the NV sensor by locating it as close as possible to the surface of the diamond. Previous research had suggested that the closer the NV centre is to the surface, the more prone it is to having its quantum coherence degraded by external noise. “But we found that, by controlling the surface very carefully, we could dramatically improve its coherence.”
Non-destructive measurement
Secondly, the researchers devised a new read-out procedure that allowed them to measure the NV centre’s electronic magnetic moment non-destructively by utilizing its quantum entanglement with the nuclear magnetic moment of the nitrogen atom. “Using this approach, the overall efficiency of read-out is dramatically increased,” Lukin says. Together, these two improvements made the technique more than 500 times as sensitive as previous attempts.
A measurement is made by fixing molecules of interest onto the surface of a diamond that has been implanted with NV vacancies. The team studied ubiquitin, which is a protein found in the tissues of all animals. The researchers were able to detect individual molecules of the protein and infer some specific chemical features. In particular, they could obtain NMR spectra of hydrogen-2 (deuterium) and carbon-13 nuclei when the proteins were enriched with those isotopes.
The team is now exploring ways of improving the sensitivity of the technique. For example, the protein molecules are currently placed in random positions on the diamond surface, and the team wants to see if placing them in specific locations relative to NV centres will lead to an improvement.
Beautiful work
“I think it is beautiful work,” says Jörg Wrachtrup. “It’s a real step forward.” However, he cautions that the NMR spectra do not have sufficient resolution to allow the researchers to actually determine the structure of a molecule. He also points out that the researchers’ proposed technique for determining structures would probably work only for very small proteins. “If I see a step that is missing,” he says, “it’s increased spectral resolution. But in principle the potential is enormous.”
It might seem obvious to say that everything in the human body is connected. Without a doubt, your various organs – heart, liver, lungs – work together to keep you alive, and functioning as close to normally as possible. Just think how both your heartbeat and your breathing speed up if you receive a shock – or how, in a starker example, the failure of one organ can lead to a cascade of failures in other organs, sometimes resulting in death.
But just how are our organs connected? Plamen Ivanov – a physicist at Boston University and Harvard Medical School in the US – thinks he may have at least the beginnings of an answer. Having developed and expanded upon the types of analyses found in the statistical physics of complex networks, Ivanov and others believe that the fluctuating outputs of organs, commonly considered “noise” by today’s physiologists, are in fact evidence of an underlying connectivity. Studying these fluctuations, he says, could give us an entirely new window into the workings of the human body – and help us prevent things going wrong.
Ivanov has grand ambitions. He wants to draw on statistical physics to build a human atlas, or “human physiolome” – a comprehensive map of all the interactions between organs in the human body. Like the Human Genome Project, which over 13 years uncovered the genetic blueprint of humans, Ivanov believes a human physiolome will revolutionize the analytic approaches of clinical practice. “It will pose new questions that have not been posed by the natural sciences until now,” he says.
Ivanov’s work on “network physiology”, as the field is now known, first began in the mid-1990s, when he began investigating the fluctuations in heart rates of both healthy human subjects and those suffering from sleep apnoea, when breathing during sleep becomes irregular. Everyone’s heart rate fluctuates, so if you measure someone’s heart rate to be an average of, say, 60 beats per minute, the time between neighbouring pulses could be at a rate of more like 50 or 70 beats per minute.
Mind over body Plamen Ivanov created the field of network physiology. (Courtesy: Mae Davis/Daily Free Press Staff)
Ivanov found that, for people with sleep apnoea, these fluctuations were random, whereas for healthy subjects the distribution of fluctuations could be described by a single function over a wide range of timescales (1996 Nature383 323). In other words, there appeared to be an underlying temporal structure to the heart-rate fluctuations in healthy people, in the sense that the time between any two pulses is in some way related to the time between another two pulses – seconds, minutes or even hours in the past. “It turns out that these fluctuations are not noise,” says Ivanov. “They are very structured.”
Working with colleagues at Boston and other institutions, Ivanov made some further interesting observations about scaling functions and power laws, which also describe temporal structure. He found that unique power laws could describe unique physiological states – not just being awake or being asleep, but different stages of sleep, including light sleep, deep sleep and rapid-eye-movement (REM) sleep. Intriguingly, an “asleep” power law could persist if a person was actually awake at an unusual time, for instance if he or she had travelled to a different time zone. Even more curious was that the researchers found a similarity between the diminished heart-rate fluctuations in the “half awake” physiological states of early morning and diminished fluctuations in those suffering from heart problems. The result, which goes against the popular idea that poorly hearts ought to exhibit more irregularities, could point to an underlying mechanism to explain why most heart attacks happen in the morning (2007 IEEE Eng. Med. Biol. Mag.26 33).
The human physiolome
The application of statistical physics to physiology does not end with heart-rate analysis. Ivanov and colleagues have also found power laws to describe fluctuations in breathing, fluctuations in the movement of a person’s hands and fluctuations in a person’s gait. But the power laws appeared to extend beyond individual limbs and organs. Even in his mid-1990s work on heart-rate fluctuations, Ivanov knew that the cardiovascular and respiratory systems must be in some way “talking” to each other – after all, there was a heart-rate power law for healthy subjects, but not for those with a respiratory disorder, sleep apnoea. Indeed, in 2000 Ivanov and colleagues showed that sleep apnoea could be diagnosed not from respiratory recordings – the traditional method, which requires hospitalization – but from inexpensive, home-monitored heart-rate recordings (2000 Comput. Cardiol.27 753). The group recently uncovered several further, independent couplings between the cardiovascular and respiratory systems, which undergo dramatic transitions from one sleep stage to another (2012 PNAS109 10181).
Could this type of communication be continuously mapped somehow, not just between the cardiovascular and respiratory systems, but among all the body’s organs? Certainly, recent decades have seen a dramatic upsurge in the application of statistical-physics techniques to complex networks. By analysing widely available information such as Internet traffic and mobile-phone data, physicists have found new insights into underlying sociological behaviour. But whereas mobile phones and IP addresses are all similar types of node, each type of human organ is very different. Worse, the links between organs are continuously changing, and operate on a vast hierarchy of timescales.
In 2012 Ivanov and an interdisciplinary team of scientists made some headway by coming up with a concept called time-delay stability. This concept relies on measuring the time between fluctuations in the output signals of one physiological system, such as cardiovascular, and the emergence of corresponding modulations in another, such as the respiratory. According to the researchers, the longer the period during which this delay is constant – for example, the constant period during which a fluctuation in heart rate is followed by a fluctuation in breathing a few seconds later – the stronger the coupling between the two systems.
To test the time-delay stability concept, Ivanov and colleagues analysed existing sleep data taken from 36 healthy volunteers. The data consisted of heart rates, breathing and brain activity, as well as eye, leg and chin movements. The researchers found that all of these physiological systems appeared to be poorly coupled during deep sleep, but more connected when a subject transitioned into REM sleep. The links became stronger in the light-sleep phase, and stronger still when the subjects finally awoke. Based on these promising findings, it was these researchers who proposed the creation of the field of network physiology (2012 Nature Comms3 702).
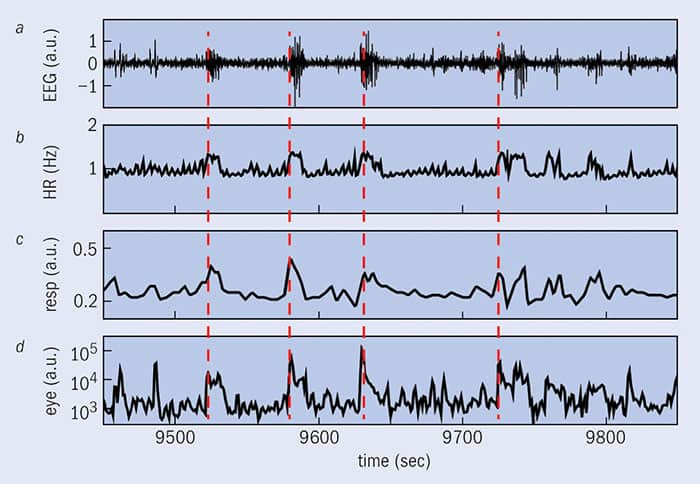
1 Co-ordinated activity from diverse organ systems Segments of synchronously recorded physiological signals including (a) brain EEG signal, (b) heart rate, (c) respiratory rate and (d) eye movement recording. Co-ordinated bursting activities with a certain time delay are consistently observed across the output signals of organ systems. Red dashed lines highlight a train of four significant bursts. These bursts transcend all systems and indicate networked communications among the systems. (Courtesy: CC BY 4.0/PLOS ONE 10.1371/journal.pone.0142143)
In November 2015 Ivanov and colleagues finished a more in-depth analysis of the data, and found that each organ has its own network of interactions with different areas of the brain, and with other organs (PLOS ONE 10.1371/journal.pone.0142143). Interestingly, there appear to be rules governing the reorganization of brain–organ and organ–organ interactions when a subject undergoes a transition to a different sleep stage; despite the uniqueness of the networks for each organ, these reorganization rules appeared to be the same for each of them (figure 1).
“Remarkably, these networked communications are so flexible that they can change and adjust within seconds [during] a transition from one physiological state to another – something we had not expected,” says Ivanov. “This shows an amazing flexibility and responsiveness in the way organ systems optimize and coordinate to generate different physiological functions during different physiological states.”
For Ivanov, this work could mark the beginnings of a human physiolome. And indeed he now has support: in July 2015, he was awarded a $1m (£660,000) grant by the W M Keck Foundation to develop network physiology. But he insists the path ahead will not be easy. “These are only the first steps in this new field,” he says. “Network physiology poses many new questions and challenges for which we do not yet have the necessary analytic [instrumentation] and theoretical framework.”
Even so, he continues, the challenges will be worth it to generate a new type of “big data”. The human physiolome will contain “streams of continuously recorded, high frequency, synchronized physiological signals under different physiological states and clinical conditions, [which] will change the way medicine operates today and will integrate more and more data-driven analytic approaches in clinical practice”, he says. “In the future, this new big data will have a similar impact on science, medical practice and health care as the Human Genome Project has today.”
The magnetic compass that birds use for orientation is affected by polarized light. That is the finding of researchers in Sweden, who studied zebra finches navigating a simple maze and found that the birds were only able to use their magnetic compass when the polarization of the illuminating light was parallel to an applied magnetic field. However, the birds became disoriented when the polarization was perpendicular to the magnetic field.
Although it has been known for more than half a century that birds can perceive direction, altitude or location using the magnetic field of the Earth, the precise mechanism that drives this “avian magnetoreception” is poorly understood. A popular theory is the “radical-pair” model, which says that incoming photons excite magnetically sensitive molecules – known as “cryptochromes” – in the birds’ retinas, causing an electron to transfer between two neighbouring molecules, leaving each molecule with an unpaired electron spin.
Excited pairs
Depending on the orientation of these molecules to some external magnetic field, the molecule spins either point in the same or opposite directions, so long as the molecules remain excited. This results in the formation of triplet and singlet states, respectively, leading to different neuronal responses in the birds. Because molecules lying along the field lines tend to favour the singlet state, a bird could determine the orientation of the geomagnetic field by comparing the effect of the field on molecules arranged at different angles across the retina. It is also known that cryptochromes absorb light anisotropically – that is, only light of a specific direction and polarization excites the molecules. Also, a certain polarization direction activates a specific subgroup of receptor molecules, and only these go on to form radical pairs and therefore are affected by the magnetic field. All of this suggests that the light-dependent magnetic compass itself is intrinsically sensitive to polarization.
To test the interactions of a bird’s magnetic compass and polarized light, Rachel Muheim and colleagues from Lund University in Sweden studied the behaviour of zebra finches trying to find food inside a simple cross-shaped maze with four arms. The maze was placed on a wooden table within a magnetic coil, which allows the researchers to deflect the horizontal component of the magnetic field.
Maze runner
The birds were first trained to find a food reward – a tray with millet seeds at the end of each arm – after they were released at the centre of the maze. During training, the birds only used the magnetic field to navigate the maze. The set-up also included an overhead light source that would illuminate the maze either with unpolarized light or linearly polarized light. Once the birds had learnt to navigate the maze, the researchers tested the bird’s navigational abilities under different alignments of polarized light and the magnetic field.
Munheim’s team found that the finches were only able to use their magnetic compass when the direction of the polarized light was parallel to the magnetic field. Indeed, the researchers found that the finches were led astray not only when the incident light was completely perpendicularly polarized, but also when only 50% of the light was polarized in that alignment. “We were expecting an effect, but not one so large that it would lead to complete disorientation when the direction of the polarization of light was perpendicular to the direction of the magnetic field,” says Muheim.
Disappearing fields and disarray
The team also found that the birds did not use the polarized light as a separate compass or guide, rather it only affected how the birds perceived the magnetic field. While it is still unclear how the different directions of polarized light in relation to the Earth’s magnetic field affect birds in the wild, the researchers say that the birds use it to accentuate the magnetic field during sunrise and sunset. These are times of day when migratory birds are believed to determine their direction and calibrate their compasses before migrating. Muheim told physicsworld.com that “during sunrise and sunset, when the polarized light in the zenith is roughly aligned parallel to North–South, birds should be able to see the magnetic field quite well, whereas at midday it might ‘disappear’.” In the middle of the day, when the polarized light is approximately perpendicular to the magnetic field, “it can be an advantage that the magnetic field is less visible, so that it does not interfere at a time when visibility is important to locate food and to detect predators,” she adds.
Erik Gauger from Heriot-Watt University in the UK, who was not involved in the current work, says that it is interesting and important because it provides further support for the radical-pair model, which is still a speculative rather than a proven mechanism. He says that while he was not surprised that the performance of the magnetic compass depends on the polarization, he was “very intrigued by the extent to which it does, and that even for only 50% polarized light in the ‘wrong direction’ that is perpendicularly polarized, the ability of the birds to orientate seems to be lost completely”.
However Gauger disagrees with Muheim’s group’s statement that “no viable theory exists on how birds, and most other vertebrates, can perceive polarized light,” citing the phenomenon of Haidinger’s brush, where many humans can see a visual pattern arising from polarized light (see video below). “Learning about Haidinger’s brush, we fully expected the compass molecules to also be sensitive to the polarization of light, but we did not take it further than that. However, it is very nice to see this confirmed,” he says.
Muheim hopes that her team’s finding will allow biophysicists to make more accurate models, and by default include polarization of light as a factor in their models. This should lead to more accurate predictions on where the receptor molecules may be located and how they work.
A flexible sensor array that can be integrated into a sweatband and detect molecules like glucose in perspiration has been unveiled by researchers at the University of California at Berkeley and Stanford University in the US. Based on plastic- and silicon-integrated circuits, the new device can be worn on various parts of the body, such as the forehead or arms, and could be used to obtain information about a person’s physiology and health in almost real time.
Most commercially available glucose sensors detect glucose levels in blood, which means that the patient has to go through the painful ordeal of pricking their finger several times a day and dabbing the sensor with blood. The new device was developed by a team led by Berkeley’s Ali Javey and is completely non-invasive. It can detect the levels of sodium, potassium and lactate (which is the same as the lactic acid produced by active muscles) as well as glucose in a person’s sweat. It also measures skin temperature.
Sweat contains hundreds of different molecules – from simple ions like sodium and potassium, to more complex protein molecules, as well as heavy metals such as cadmium and mercury. Today, sweat analysis is mainly carried out in medical laboratories and most clinics are ill equipped to study the tiny volumes of liquid involved.
The team’s sensor can be worn directly on the skin and analyses sweat as it appears on the skin’s surface. The device contains an array of five sensors on a flexible substrate and can identify a single type of ion or molecule among thousands of others in a sample, depending on the electrical signals it produces.
Temperature dependence
“The more glucose or lactate in your sweat, for example, the more electrical current is generated at the sensor surface, and the more sodium and potassium, the larger the voltage,” explain team-members Wei Gao and Sam Emaminejad at Berkeley. “But the current generated from glucose and lactate sensors is affected by temperature. When your skin temperature goes up, the higher temperature increases the signal from the glucose sensor, making it look like you are releasing more glucose in your sweat than you actually are. As a result, it’s important to measure both temperature and molecules at the same time, to calibrate the device.”
The device can wirelessly transmit information via Bluetooth and the researchers say that they have already developed an application to synchronize the data obtained from the sensor to a mobile phone. Indeed, they have fitted the device onto “smart” wristbands and headbands. Because the device is fabricated on a mechanically flexible polyethylene-terephthalate (PET) substrate, it can easily be in contact with skin. There are two versions of the device: a completely flexible and disposable sensor array that binds to the skin like a temporary tattoo, and a flexible printed circuit board that is re-usable. The team tested out its devices on dozens of volunteers as they exercised, with their experiments lasting from a few minutes to more than an hour.
Large-scale clinical studies
The sensor might easily be miniaturized further, say Gao and Emaminejad. “The number of biochemicals we target can also be ramped up so we can measure a lot of things at once. That makes large-scale clinical studies possible, which will help us better understand athletic performance and physiological responses to exercise.”
Team member and exercise physiologist at Berkeley George Brooks says that although the device can be used to measure vital metabolites and electrolyte levels in the sweat of healthy individuals, it could also be adapted to monitor body fluids other than the perspiration of patients suffering from illness or injury. It might even be used to detect the presence of illegal drugs in sweat, which would be useful in anti-doping tests for athletes.
Sanders has just taken over from Eberhard Bodenschatz as editor-in-chief of New Journal of Physics, and it’s a coup to have him in the role, not least because he’s an incredibly busy physicist, making – by his reckoning – at least 150 international flights a year.
A new experiment to search for hypothetical particles known as sterile neutrinos has been given the green light by scientists at the CERN particle-physics laboratory near Geneva. The SFr 200m (£140m) Search for Hidden Particles experiment (SHiP) would be built at CERN and start up a decade from now. The lab’s member states will, however, need to approve the project before construction.
Predicted by certain extensions of the Standard Model, sterile neutrinos – if they exist – would interact extremely weakly, if at all, with ordinary matter. However, sterile neutrinos would transform into and out of standard neutrinos, revealing themselves via a greater- or lesser-than-expected rate of oscillation between the different types, or “flavours”, of neutrinos. Physicists working on the Liquid Scintillator Neutrino Detector (LSND) at the Los Alamos National Laboratory in New Mexico between 1993 and 1998 saw some evidence for such a transformation, but other experiments have failed to see a similar signal.
There are other plans to look for these hypothetical particles, but these experiments would focus on light sterile neutrinos with masses of less than one electronvolt. SHiP, in contrast, would seek more massive sterile neutrinos known as heavy neutral leptons. Weighing a few gigaelectronvolts, such particles would, very occasionally, decay into ordinary matter. According to SHiP spokesman Andrey Golutvin of CERN, their existence, unlike that of their lighter counterparts, could explain the predominance of matter over antimatter in the universe and the nature of dark matter. “Finding a light sterile neutrino would be a Nobel prize discovery, but it wouldn’t solve the problems of the Standard Model,” he claims.
Specific signature
SHiP would involve building a new target and detector to exploit the high-intensity proton beam produced by CERN’s Super Proton Synchrotron (SPS). Incoming protons would strike a tungsten-molybdenum target, generating mesons containing charm quarks that would decay to produce standard neutrinos, which might, in turn, oscillate into heavy sterile neutrinos. After passing through a magnetic shield to deflect muons and other unwanted particles generated in the target, the sterile neutrinos would then enter a 50 m-long vacuum chamber. If they decay, they would leave a specific signature: two oppositely charged tracks emerging from a vertex, plus a well-defined mass for the decaying particle.
The SHiP design was endorsed by CERN’s SPS and PS experiments Committee (SPSC) at a meeting held on 19 and 20 January. The committee said it was “impressed” by the collaboration’s response to earlier requests to modify the experiment’s design and schedule, and recommended that the group now prepare a comprehensive design report. Golutvin says that this report, which will require testing detector prototypes, should be ready in time for the EU’s next strategic review of particle physics in 2019. If the experiment is approved by CERN Council, he says it should start taking data when the Large Hadron Collider (LHC) emerges from its third long shutdown in 2026.
Complementary approach
William Louis, a physicist at Los Alamos who worked on the LSND, says that it is important to have a “wide variety” of sterile-neutrino experiments to “probe different mass scales”. He believes that SHiP would complement experiments in the US and Japan that are also studying heavy sterile neutrinos. Patrick Huber of Virginia Tech in the US points out that scientists have very little idea about the mass of hypothetical sterile neutrinos and, by searching for these and other particles over previously unchartered masses and interaction strengths, he believes SHiP will provide “a very nice complementary approach to the LHC”.
However, Luca Stanco of Italy’s National Institute of Nuclear Physics in Padua argues that SHiP will probe a relatively small region of “parameter space” that does not justify the experiment’s considerable price tag. He says that the idea of a heavy sterile neutrino is “intriguing and appeals to many theoreticians”, but adds wryly that “theoreticians were pretty much sure about supersymmetry too”.
When confronted with something unexplained in the data, scientists face several possibilities. Maybe there’s an error and the result is spurious. Maybe there’s a more mundane explanation they simply overlooked. Or perhaps the unexplained is a sign that a theory needs to be revised or supplanted. That last option is the rarest, at least when the theory in question is a successful one. After all, any new theory must explain all the same phenomena an old theory explained, and predict something new that can’t be handled with the old.
One unexplained result that’s been bugging physicists for more than 15 years is dark energy, which is the name we give to our ignorance. The universe is expanding at an accelerating rate, but we don’t know why. To make matters worse, dark energy comprises roughly three-quarters of the total energy content of the cosmos, so it’s not a minor thing we don’t get. For that reason, a small but dogged group of physicists thinks the existence of dark energy might be a clue that we need to revise one of the most successful theories we have: general relativity.
One way to revise general relativity is to modify the nature of the gravitational force so that it behaves as though it has mass. The alteration doesn’t have much effect on the motion of planets in the solar system. The most important consequence is instead at large distances, where the change would throttle the effects of gravity enough to account for the universe’s accelerating rate of expansion; dark energy would no longer be required.
Holding it together
Gravity is one of the fundamental forces of nature. It literally holds the Earth and all planets together, keeps the solar system cycling predictably over billions of years, and dictates the structure of the universe itself. Isaac Newton and his fellow scientists established the connection between gravity and the motion of planets, providing a deep relationship between astronomy and physics, two fields many ancient thinkers thought were separate. Albert Einstein’s general theory of relativity, the modern theory that describes gravity using the structure of space and time, celebrated its 100th anniversary last year, and is still going strong.
Physicists know general relativity isn’t the last word on gravity. For one thing, nobody has yet found a complete and satisfactory quantum theory of gravity
Yet physicists know general relativity isn’t the last word on gravity. For one thing, nobody has yet found a complete and satisfactory quantum theory of gravity, a necessary step towards describing all the forces of nature within a single theory. Any changes to general relativity from quantum gravity, though, would take place on microscopic scales far smaller than anything we can probe in the foreseeable future. Those interested in explaining dark energy think general relativity might also break down on very large scales, bigger than galaxies. That hypothesis has led to a number of alternative theories of gravity, some of which are more radical reimaginings than others.
The “massive gravity” hypothesis is one such reimagining, and an active area of research with many research articles published over the last few years. “Until the last five or so years, we didn’t even know that it was a possibility [for gravity to have mass],” says Rachel Rosen, a theoretical physicist at Columbia University in the US. But that possibility has now firmly emerged, spurred on by the desire to solve the looming problem of dark energy.
So what does it mean for gravity to have mass?
A tangled mass
In the theory of gravity as laid out by Newton, mass is the reason for gravity. An attractive force exists between any two masses and causes both the motion of planets and the falling of objects near the Earth’s surface. The strength of that force decreases with the square of the distance between the masses, so doubling the distance results in a force four times weaker. This “inverse-square law” is what makes Newton’s theory valid for describing the planets and moons of the solar system, for plotting the trajectories of space probes, or for understanding the structure of galaxies.
In some situations, however, Newton’s theory of gravity is not sufficient. General relativity kicks in when gravity is strong – near black holes, neutron stars and other dense objects – or on large scales where the amount of mass in a volume of space reaches a significant point. That’s why general relativity turned cosmology from a branch of philosophy into a branch of science: it showed how gravity governs the cosmos on the largest scales.
But general relativity isn’t merely a slight modification of Newtonian gravity: it’s a fundamentally re-conceived notion of how gravity works. First, anything with energy can produce gravity or be affected by it, without the need for mass. That’s why paths of light are curved by gravity, producing gravitational lensing and other fun phenomena. (This is related to E = mc2, but not identical to it.) Second, in Newtonian physics, a change in one mass produces an effect instantly through all of space, no matter how far away: if the Sun exploded (not that it will), Newton’s law says we’d feel the gravitational effect immediately, even though light from the Sun takes just over eight minutes to reach us. General relativity predicts that gravity propagates at the same speed as light.
From the quantum perspective, that means gravity behaves like a particle with no mass; this hypothetical particle is called a graviton. Gravitons are to gravity what photons are to light, and the two types of particles have a lot in common. Both are massless, both move at the speed of light and both have two basic types of polarization (though there are also differences that aren’t relevant in the present discussion). The first polarization type is labelled “+”, and it resembles squeezing a circle alternately horizontally and vertically if the wave is moving directly towards you; the second type is “×” polarization, and it’s the same deal, only squeezing the circle at a 45˚ angle. Unlike light, gravity is too weak for us to detect individual gravitons; instead, we see and feel the effects of countless numbers of them working, much as we usually only see huge amounts of photons at once.
But the properties of gravitons are inferred from general relativity, so alternative theories can predict different behaviours. Case Western Reserve University physicists Claudia de Rham and Andrew Tolley, along with colleagues, have worked on various models examining how a graviton with a non-zero mass could solve the dark-energy problem in cosmology. If the graviton has mass, gravity will no longer obey the inverse-square law precisely. Instead, the force will decrease faster with distance, depending on the mass of the graviton. A relatively large graviton mass means a sharp cut-off for gravitational attraction at short distances; this is precisely the case for the strong force binding the nucleus of an atom together. A sufficiently small graviton mass, however, will produce a force nearly identical to the predictions of general relativity.
Not-so-empty space Could gravity break the inverse square law at large astronomical distances? (Courtesy: Take 27 Ltd/Science Photo Library)
“We wouldn’t want the graviton mass to be much larger than 10–32 electron volts or something like that,” says de Rham. For comparison, the electron mass is about 500,000 electron volts, so gravitons would have “the smallest mass you can ever imagine”, she says. That tiny mass is what could produce deviations from general relativity on cosmological distances and time scales.
Constant solution
Ironically, de Rham, Tolley and their collaborators actually use the graviton to explain why cosmic acceleration is so small. According to particle physics, empty space is actually a stew of “virtual particles”, which may be better thought of as potential particles: a froth that could produce real particles under the right circumstances. Add up all the contributions from all these virtual particles, and you find that empty space contributes something called a cosmological constant. The cosmological constant looks like dark energy, but if calculations are correct, the universe should have a factor of 10100 more dark energy than we see. Since the universe isn’t accelerating that much, this is known as the cosmological constant problem.
“The cosmological constant problem is perhaps one of the most compelling current problems in theoretical physics,” says Rosen. “[To solve it,] we’re looking at every possible approach, but it basically comes down to: either our understanding of quantum theory needs to be modified, or our understanding of gravity needs to be modified.” A popular possibility for the first option is string theory, a modification of quantum theory that allows for a huge number of different cosmological constants.
The second option includes the massive graviton hypothesis. If gravity has a cut-off, it would dampen that acceleration down from the amount expected from the cosmological constant to the relatively small amount we observe today. “The cosmological constant could actually be large, as large as particle physics would like it to be, but we observe just a fraction of it,” de Rham says.
There is a catch, however, which lies in how the graviton’s behaviour comes about. In the massive gravity theory that de Rham and Tolley propound, the observable universe is like the surface of a bigger reality, with two or three extra dimensions lying “beneath” what we see. This concept is known as a “braneworld”, where “brane” is short for “membrane”. The mass of the graviton comes from the particular way gravity acts when it is trapped on the surface of the brane that is our universe. In physics terms, we say gravitons “acquire” mass, in somewhat the same way that electrons and quarks acquire mass through interaction with the Higgs field.
General relativity is well known for being difficult to work with, but the massive gravity theory is far more so
As the extra dimensions are the reason for the graviton mass, they are also only indirectly knowable through the effect they have on the force of gravity in our observable universe: there’s no way to independently confirm their existence. But the extra dimensions also bring a cost in terms of complication. General relativity is well known for being difficult to work with, but the massive gravity theory is far more so. The mathematical description of the structure of the universe requires a long chain of reasoning in the massive graviton theory, whereas the general relativity version – one of the huge early successes of the theory – is remarkably straightforward.
However, the real test of any theory isn’t its mathematical simplicity, but how well it matches real-world data. Tolley and de Rham point out that a massive graviton would have an effect on the same gravitational-wave spectrum that the BICEP2 telescope at the South Pole and other experiments strive to measure. The next generation of experiments, then, could conceivably provide a good test if they can overcome BICEP2’s particular difficulties of observing an unwanted foreground of cosmic dust that obscures a possible gravitational-wave signature. The modified gravitational force law would also affect the number and distribution in space of the earliest galaxies, so various astronomers are looking at whether large galaxy surveys are consistent with the massive graviton hypothesis.
However, adding mass to the graviton changes more than just the force law. “The usual massless graviton only has two degrees of freedom, similar to the two polarizations of a photon,” says Rosen. A massive graviton, by contrast, has several more polarizations, and those lead to a number of subtle – but possibly detectable – effects. In addition to the “+” and “×” modes, the circular cross-section of a wave coming towards you could rock back and forth, or shrink and expand. “Adding a small mass to the graviton is not just a large-distance modification. You can see effects at shorter distances potentially as well.”
Gravitational-wave detectors such as the upgraded Laser Interferometer Gravitational-wave Observatory (LIGO) may be able to see some of the differences in these ripples of space–time from these extra polarizations. Surprisingly, though, other experiments within the solar system could provide the fastest answers, even though the effect of massive gravity is very small. Measurements of the Moon’s position using the reflectors placed by the Apollo astronauts would be almost precise enough to see the tiny difference in the Moon’s orbit produced by massive gravity’s different behaviour.
The proliferation of theories shows both how little we understand dark energy and cosmic acceleration, but also how creative minds are working to resolve it
Of course, the massive graviton is one hypothesis among many for explaining dark energy; even the version de Rham and Tolley describe isn’t the only version of massive gravity out there. The proliferation of theories shows both how little we understand dark energy and cosmic acceleration, but also how creative minds are working to resolve it. “Should we believe that massive gravity is the true theory of nature?” Rosen asks rhetorically. “The big deal is that [a massive graviton] is suddenly a possibility, where before we weren’t sure it was a possibility or not. The truth is we don’t know.”
When the data are signposts pointing us into the unknown, it’s hard to know exactly what guide is best to choose. One possibility may be to change – again – the way we think about gravity.
As I explain in the video above, this month we have a package of articles looking at some of the issues surrounding peer review, including a news-analysis piece by Physics World news editor Michael Banks, who talks to a range of figures in physics and publishing with views on this subject.
Our cover feature this month is on the new interdisciplinary science of “network physiology”. Elsewhere in the issue, John Campbell from the University of Canterbury in New Zealand looks at Rutherford’s secret work in the First World War using sonar to spot submarines, while science writer Matthew Francis looks at efforts to rewrite the rules of gravity.