How to directly image single molecules in 3D with MRI

A little over 30 years ago, the invention of the scanning tunnelling microscope (STM) revolutionized surface science and helped jumpstart the field of nanoscience. The STM and related tools such as the atomic force microscope allow researchers to quickly visualize individual atoms and molecules. However, they have one key weakness: they can only probe the top surface of an object. Is it possible to overcome this limitation with a microscope that looks below surfaces and directly images molecular structures in 3D at the atomic scale? This question underpins the emerging field of nanoscale magnetic resonance imaging, or nanoMRI – a technique that could represent a major breakthrough in microscopy and have a profound impact on some of the most pressing questions in structural biology.

The current gold standard for solving molecular structures is X-ray crystallography, in which an intense beam of X-rays is diffracted by atoms in a crystalline array of molecules. The diffraction pattern can be mathematically inverted to give the atomic structure of the molecules, unlocking the workings of fundamental biological units such as the ribosome and allowing pharmaceutical companies to develop more targeted drugs. However, X-ray crystallography can be applied only to those molecules that can be purified and crystallized, which represents a small fraction of biologically important structures. Nuclear magnetic resonance (NMR) spectroscopy is an alternative way to solve molecular structures, but it encounters difficulties for molecules above a certain size. Cryo-electron microscopy is also making strides in the pursuit of single-molecule imaging, but as with all forms of electron microscopy, radiation damage is a major issue.

Magnetic resonance imaging (MRI), a well-known technique in the medical arena, suggests an alternative approach. MRI is non-destructive, elementally selective and able to image below a surface in 3D. Like NMR spectroscopy, MRI relies on the detection of the weak magnetism associated with atomic nuclei, typically hydrogen nuclei (protons) in water and organic molecules. In the presence of a magnetic field, these nuclear spins precess at a certain frequency determined by the magnetic moment of the nucleus and the strength of the magnetic field. By imposing a gradient in the magnetic field, the precession frequency becomes spatially dependent, allowing images to be formed by analysing the frequencies of signals detected via an inductive receiver coil.

At first glance, the idea of extending MRI to the nanoscale seems preposterous. After all, nuclear magnetism is a notoriously weak effect because of the tiny value of the nuclear magnetic moment and the disorganized (paramagnetic) nature of the magnetism. For example, a single volume element in a medical MRI image typically requires at least 1018 nuclei to produce a detectable signal, resulting in a resolution in the millimetre to sub-millimetre range. In order to image molecular structure we require a resolution of 1 nm or better, necessitating a sensitivity improvement of at least 1016! Clearly great improvements in detection are required.

Feeling the force

The first serious proposal to extend MRI to the nanoscale came in 1991 from medical physicist John Sidles at the University of Washington. In a series of theoretical papers, Sidles outlined a method – now known as magnetic resonance force microscopy (MRFM) – for dramatically improving detection sensitivity based on the measurement of ultra-small magnetic forces. The technique exploits an effect every child learns at school: that two magnets either attract or repel one another depending on their orientation. In MRFM, the two magnets are a nanoscale ferromagnetic tip and the nuclear spins in the sample. By periodically flipping the orientation of nuclear spins in the sample using radio-frequency magnetic fields, the force between the tip and the sample nuclei is made to oscillate. The oscillating force is very weak, typically in the attonewton (10–18 N) range, and is detected by the slight vibration of a nanomechanical cantilever.

At the time of Sidles’ proposal, my group at IBM was working on new techniques in force microscopy and we agreed to test the MRFM idea. Since electron spins have a larger magnetic moment than nuclear spins, and thus provide a larger force signal, we decided to focus first on an electron spin-resonance experiment. After modifying one of our existing force-detection set-ups, I placed a microscopic crystal onto a small silicon-nitride cantilever and positioned it close to a small permanent magnet. To my delight, when I then turned on the radio-frequency magnetic field to periodically flip the spins in the sample, I was able to detect tiny oscillations of the cantilever caused by the flipping of the electron spins. Additional demonstration experiments at the micrometre scale followed quickly, including nuclear spin detection. As we continued to miniaturize the experiment, the field gradient from the permanent magnet increased, which allowed us to demonstrate 3D imaging of both electron-spin and nuclear-spin samples.

While micrometre-scale detection was fairly straightforward, extending the technique to the nanometre scale required a more serious effort. The key issue is the extremely small magnitude of the magnetic force generated by nanometre volumes of unpolarized spins, which requires a very small and sensitive cantilever with a low internal friction operating at low temperatures. In work carried out with John Mamin at IBM and students of Tom Kenny at Stanford University, we fabricated 100 nm thick, single-crystal silicon cantilevers that enabled us to achieve attonewton force sensitivity when operated at liquid-helium temperatures.

The advent of attonewton force sensing led to several key demonstrations of MRFM, with our group detecting a single electron spin in 2004. A few years later, we achieved an even more significant demonstration: 3D nanoscale MRI of a virus particle with a resolution better than 10 nm. Notable progress has also been made at several other institutions. Raffi Budakian and colleagues at the University of Illinois have pioneered the use of semiconductor nanowires for force detection, for instance, while Martino Poggio at the University of Basel has imaged multiple nuclear species within nanowires. At the Ohio State University, Chris Hammel and his students have done extensive work using MRFM to study ferromagnetic resonance in nanoscale magnetic objects, while John Marohn’s group at Cornell University has demonstrated ultrasensitive cantilevers with integrated magnetic tips that produce large field gradients.

Diamond alternative

A second detection technique for nanoMRI has recently emerged, based not on cantilevers but on a well-known atomic defect in diamond called a nitrogen vacancy (NV) centre. Here, substituting a nitrogen atom for a carbon atom next to a vacancy in the diamond lattice produces a fortuitous combination of magnetic and optical properties. In particular, individual NV centres can be identified by focusing green laser light onto a diamond crystal and observing a bright, localized red fluorescence.
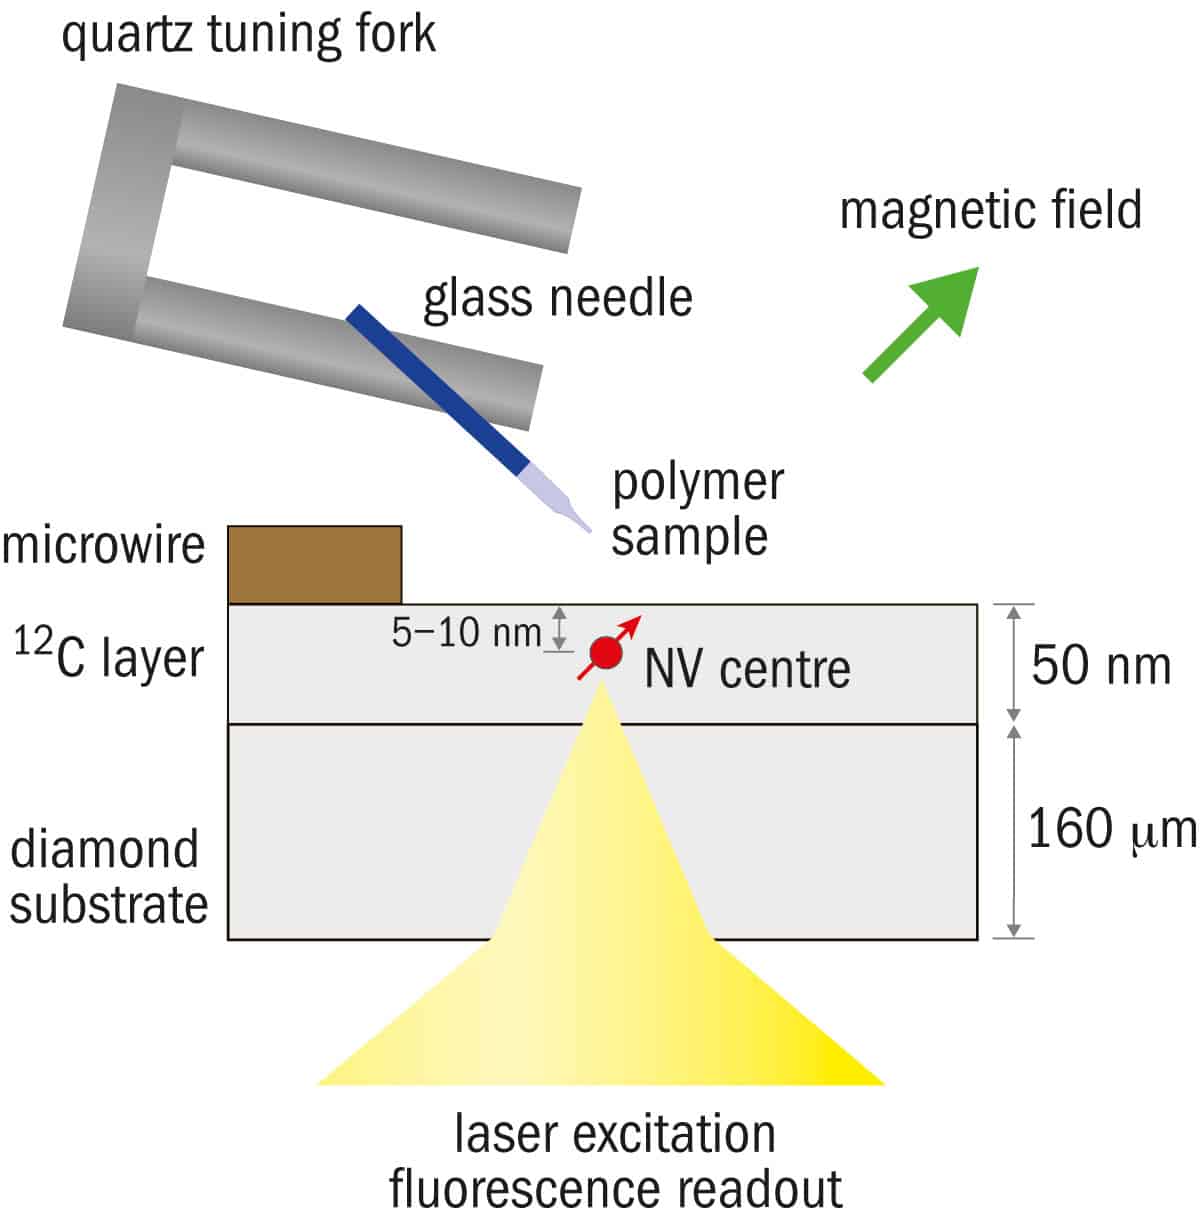
A diagram of nanoscale MRI

Crucially for nanoMRI, the brightness of the NV fluorescence depends on its magnetic spin state, and the precession frequency of the NV spin state can also be measured with great precision. As a result, the NV centre essentially acts as an atomic-size magnetometer with nanotesla sensitivity. The study of individual NV centres was pioneered by Jörg Wrachtrup’s group at the University of Stuttgart in the mid-1990s, and the use of NV centres for nanoMRI detection was proposed in 2008 by Christian Degen, who is now at ETH Zurich.

For nanoMRI applications, where the goal is to detect NMR signals from samples external to the diamond, the NV centre must be located as close to the diamond surface as possible. Near-surface NVs can be formed by ion implantation of nitrogen or by a “delta doping” process during chemical vapour deposition growth of the diamond layer.

One challenge in using near-surface NV centres is the reduction of the spin coherence – the regularity of the NV electron spin precession – because of poorly understood noise sources on the diamond surface. Recent advances in diamond surface preparation now allow NV centres with reasonably good characteristics – namely long coherence times and adequate photostability – to be formed just a few nanometres below the diamond surface.

The first demonstrations of NV-detected NMR from an external sample were achieved in 2012 by the Stuttgart group and, independently, by my group at IBM working in collaboration with David Awschalom, then at the University of California, Santa Barbara. In the Stuttgart work, a sequence of microwave pulses applied to the NV centre enabled the measurement of the oscillating magnetic field that naturally emanates from precessing hydrogen nuclei in an organic sample that was applied to the diamond surface.

In contrast, the IBM approach used a more active manipulation technique whereby the sample’s nuclear spins were flipped using radio-frequency magnetic fields. In both cases, the effect on the NV spin precession is detected via changes in the optical fluorescence of the NV centre. Although no imaging was involved in these initial demonstrations, it was clear from model calculations that the detected signals indeed originated from the hydrogen nuclei within a nanoscale sample volume.

Triple success

Recently these two groups and a third team at Harvard University independently succeeded in extending NV-based NMR detection into the realm of nanoMRI (Nature Nanotechnology 10 110, 125 and 129). Our group at IBM used a mechanical scanning approach to obtain a 2D hydrogen image of a polymer test sample that was scanned past a single NV centre, demonstrating a resolution of the order of 12 nm. The Stuttgart team used a similar approach whereby a patterned fluorocarbon sample was scanned over the NV centre and signals from both hydrogen and flourine-19 nuclei were detected. The third paper, from Ron Walsworth and colleagues at Harvard, used a dense layer of NV centres implanted just below the surface of a diamond substrate and employed a CCD camera to take a wide-field microscope image of NV fluorescence, achieving submicron MRI resolution without the need for mechanical scanning.

These initial demonstrations of NV-detected MRI are just a starting point, and we can expect great improvements in capability as researchers continue to improve the performance of NV-centre signal detection. The signal-to-noise ratio is currently limited by inefficiencies in the detection of the NV fluorescence, for example, but this could be overcome by incorporating recent innovations in diamond optical-waveguide techniques.

Another innovative idea, recently demonstrated by Mikhail Lukin’s group at Harvard, is to use “reporter” electron spins embedded in the sample molecule itself to act as an intermediary between the nuclear spins in the sample and the NV centre. By adding large field gradients to the NV detection system, we should be able to extend the technique to full 3D imaging, although ultimately it might require cryogenic temperatures to achieve the necessary scanning stability and NV coherence time required for a true molecular-structure microscope.

Both MRFM and NV-centre techniques have taken the resolution of MRI well beyond what anyone could have expected just a few years ago. It is clear that nanoMRI is no longer just a dream of a few far-out thinkers. Hopefully, the recent demonstrations will spur even more innovations to push the field forward.

Electron pairing without superconductivity seen at long last

Schematic diagram of the single-electron transistor

Electron pairing without superconductivity has been seen for the first time by a team of physicists in the US. Confirming a prediction made in 1969, the electron pairs were spotted in strontium titanate using a single-electron transistor. The observation could provide useful insights into the nature of superconductivity, and perhaps even help in the design of new high-temperature superconductors.

In a conventional superconductor, electrons with opposite spin come together to form Cooper pairs that pass through the atomic lattice without scattering. This interaction occurs because the presence of one electron pulls in positive ions from the lattice, and this in turn attracts the next electron. These pairs then interact with each other to form a condensate from which individual electrons cannot be easily scattered. For this to work, however, the electrons have to be relatively close together. This is not the case in strontium titanate, which has a very low electron density yet is a superconductor at temperatures below a critical temperature (TC) of about 300 mK.

Unexplained mechanism

In 1969 David Eagles of the NASA Electronics Research Center in Massachusetts calculated the properties of a hypothetical material that had an unspecified physical mechanism that caused electrons to pair up but not form a condensate. He found that if such a material was cooled below a critical temperature, these pairs could form a condensate and the material would become a superconductor. This had remained unobserved ever since, but the mechanism has been suggested as a possible explanation for certain unexplained properties of high-temperature cuprate superconductors.

Now, Jeremy Levy of the University of Pittsburgh and Pittsburgh Quantum Institute, both in Pennsylvania, and colleagues have seen the first evidence for electron pairing at temperatures well above TC. To do this, the team fabricated single-electron transistors at the interface between strontium titanate and a layer of lanthanum aluminate. This was done using an atomic force microscope to create nanometre-scale source, drain and gate electrodes separated by a quantum dot.

By altering the voltage on the gate, the researchers could add and remove electrons one by one, to and from the quantum dot. They measured how the conductance between the source and drain varied with the voltage applied to the gate. When the electron density in the dot was high enough and the electric field was very low, the system effectively behaved as a superconductor. However, when the density was lowered, the team observed a series of repeated peaks and dips in conductivity as electrons were added and removed, as is expected with a single-electron transistor.

Crucial evidence

The crucial evidence came when the researchers applied a magnetic field. At fields above about 3 T, each peak in the conductance of the transistor split into two closely spaced peaks. This showed that electrons were not entering and leaving the transistor one by one, but two by two. This is proof that, even when the system was not superconducting, the electrons were still paired.

The researchers now want to investigate the physical mechanism that makes the electrons pair up. Gaining a good understanding of this relatively simply system could further our comprehension of superconductivity in some more complicated materials. Levy believes that this knowledge could help physicists in their search for materials that are superconductors all the way up to room temperature – which is about 160° warmer that the highest known TC today.

More clear-cut

David Eagles is pleased to see the research. He points out that a group he was part of at CSIRO Division of Applied Physics in Australia found evidence for similar pairing in bulk strontium titanate doped with zirconium in the 1980s, although he says that “this case may be more clear-cut than mine”.

Christopher Bell of the University of Bristol commends Levy and colleagues on their experimental prowess: “This system is extremely complicated. Jeremy’s lithography technique is tough and they’ve had to work very hard to get this to work.” Kamran Behnia of EPSCI in Paris is also impressed by the results, but adds a note of caution about their interpretation. “This experiment shows electrons moving in pairs,” he explains. “Are these Cooper pairs? I think this has yet to be proved.”

The research is published in Nature.

Living in a world without light

This film looks at the essential role light plays in regulating our internal body clocks and why your daily dose of sunlight is so important.

In recent years the medical community has discovered that people who are blind or visually impaired can still use their eyes to detect the overall amount of light in their environment. This enables them to regulate their internal body clocks in the same way as everybody else.

For people who actually have no physical eyes, however, this ability to maintain a regular sleep–wake cycle can be severely compromised. These findings have brought into question the validity of medical operations to remove people’s eyes, a procedure that is sometimes performed for cosmetic reasons.

In this film we meet Meredith Plumb, who had her eyes removed after she gradually went blind following a chemistry accident.

“I don’t sleep normally and I don’t feel normal. I do feel that I live in a bit of a separate universe from everybody else,” says Plumb, who adds that she sleeps in 90-minute and 3-hour cycles throughout the 24-hour day. Plumb has embraced her situation by becoming a person-centred counsellor who offers advice without prejudice.

One pioneering research group in this field is the Sleep and Circadian Neuroscience Institute (SCNi) at the University of Oxford in the UK, led by Russell Foster. Foster’s group has identified that one in a hundred so-called ganglion cells in the eye are directly sensitive to light. Remarkably, the performance of these cells is unaffected by damage to the rod and cone cells of the visual system.

Foster and his group are developing an understanding of what genes are turned on and off as a result of light hitting the molecular clockwork of the eye. This information could be used to develop pharmacological mimics of light that could help people who have had their eyes removed to establish more regular sleep patterns.

The film is produced by London-based filmmaker Thom Hoffman, who has recorded interviews with Plumb and Foster, and combined them with stunning visual imagery to illustrate the interconnected nature of light and life. It is the second in a series commissioned by Physics World as an official media partner for the International Year of Light (IYL 2015). These short documentaries tell personal stories relating to some of the core themes of IYL 2015, the campaign for dark skies and the study after sunset initiative.

If you want to find out more about how light interacts with the eye, then check out the March 2015 issue of Physics World. This special issue devoted to light includes a special feature about how humans’ secret superpower: the ability to see polarized light.


15 years and counting

I don’t know where the time went, but my first Critical Point was published 15 years ago this month. Inviting me to write the column, Matin Durrani – who is now editor of Physics World – counselled me to be “robust, pithy, with plenty of anecdotes and an eye for detail”, which were traits he said he liked in my other writings. He also advised me to be “humorous, where appropriate”. I tried to follow this advice in the ensuing columns, in which I sought to write something new about a historical, philosophical, social or biographical aspect of physics in just 950 words.

I particularly like writing about exceptional people involved in extraordinary tasks: Frank Sinden, who built a mock-up of a boat that can sail faster than the wind powering it (June 2008); Guangming Qiu, who studies ancient Chinese metrology (July 2011); and Jane Richardson, whose work at the intersection of art and science changed the way we depict proteins (August 2004).

Several columns landed me on the radio and even onstage. “So you think physics is funny?” (September 2003) got me mocked on BBC Radio Five Live, very late one night New York time, by host Dotun Adebayo, and I promptly wrote about that humiliating experience (“The best physics humour ever”, December 2003). “Lost art of the letter” (January 2007) got me invited on a Valentine’s day talk show on the Washington, DC, radio station WAMU alongside the author of a book on love letters. Another column, “Why don’t they listen?” (May 2014), got me an invitation to speak at TEDxCERN. I also blogged about the event for Physics World and wrote a syndicated article.

While having dinner at a London pub one evening, I asked Matin which subjects generate the most feedback from Physics World readers. Two, he said: religion and measurement units. I understood the reasons for the former but not the latter. After a few columns on units (September 2009, February 2010, December 2010), I did, and had the nucleus of material for a book: World in the Balance: the Historical Quest for an Absolute System of Measurement (Norton 2011).

In several “interactive” columns I invited readers to respond to questions on topics including reality (October 2001), physics legends (November 2006), science bloopers (April 2007) and laboratory literature (December 2014). Some of these – on beautiful experiments (May 2002) and great equations (May 2004) – also provided material for books: The Prism and the Pendulum: the Ten Most Beautiful Experiments in Science (Random House 2003), and The Great Equations: Breakthroughs in Science from Pythagoras to Heisenberg (Norton 2009).

A few columns coined words or expressions. A doxoid is an opinion or belief that has not been independently thought out – such as that accelerators are dangerous – but is produced by other beliefs and opinions (May 2005); anosognosia names the disease that afflicts humanities scholars ignorant of how science affects modern life (September 2005). The Farley effect refers to the way scientific ideas emerge in dialogue (November 2003); the Treiman effect to the way that each new result affects our assessment of the path by which we got to it (July 2013). These expressions, however, are not yet in the dictionary.

Despite many interesting and informed comments from readers, there have also been the inevitable hecklers, blowhards and Internet stalkers convinced that science is much simpler than I have presented it. The most menacing was the person who reacted to a column on the ambiguities of the discovery process with the adamant conviction that discovery is solely a matter of publication date. He even threatened to sue me, pointing out that the “British system is much more favourable to the plaintiff in a libel suit than the system in the US”. In the end, he didn’t. Damn! I’d have loved to concoct a legal brief exposing his vacuous, self-interested reasoning. The court scene alone would have made a terrific column.

I had a humbling experience after the terrorist attack that destroyed the World Trade Center on 11 September 2001. I tried to find something appropriate for a column, thought for days, but could not. I was therefore awed to open the pages of Natural History to Neil deGrasse Tyson’s meditation on the Twin Towers, which approached them as if they were a laboratory, their mere structure and appearance able to reveal nature’s secrets. The piece was clear, discerning and written with a sense of (in this case terrible) occasion – a magnificent piece of column-writing that I can only hope to emulate.

As a US author writing for an international magazine published in the UK, there have been occasional confusions over spelling, punctuation and cultural references. I was baffled to find that the name “Rube Goldberg” is not well known in the UK; the British equivalent is Heath Robinson, which gave me material for a column (June 2005). And despite discovering that a Physics World article from 1998 on the “physics of football” is one of the most popular on this magazine’s website, I haven’t yet figured how to make a column out of the difference between what Americans and the rest of the world understand as “football”.

The critical point

Every so often Physics World would inform me there would be no “Critical Point” because of a special issue. Each time I’d get hot under the collar, feeling sure that I – and the Institute of Physics, which publishes this magazine – would be inundated by protest letters. None ever arrived. This taught me the most important critical point: a column is just another article and has no moment of its own. What matters is to write on an interesting topic in a way that connects with readers, and to do so again and again.

Atomic gas puts the brakes on light in optical fibres

Light in an optical fibre has been slowed to a virtual standstill for the first time by a team of physicists in France and Austria. The technique makes use of an effect called electromagnetically induced transparency (EIT), which normally occurs in clouds of atomic gases. The discovering could provide a practical solution to the vexing problem of how to build quantum memories for use in quantum-information networks.

Slow light has been an active area of research since the late 1990s, when researchers discovered that a control laser tuned to a certain frequency will excite a gas of atoms into an energy state in which the atoms can no longer absorb a light signal from another source. When the control laser is off, the atoms can absorb light, making the material opaque to the signal. When the laser is on, no light can be absorbed, and the gas becomes transparent to the signal. This is EIT, but there is more to it than just that. In 2001 researchers discovered that if the control laser was switched off while the light signal is in the gas, the signal could be brought to a standstill for a fraction of a second. Then the signal would resume its motion when the control is switched back on again.

Attractive collective phenomenon

Technically, it is not the light’s photons that are slowed but rather the envelope of their collective wave, which is represented by the photons’ “group velocity”. Nonetheless, slow light immediately became an attractive phenomenon to exploit for quantum networks, which are used to transmit information in such a way that it is fundamentally secure from eavesdroppers. Quantum information is corrupted as soon as it is measured, and therefore quantum memories must store information without actually reading it in any way. Slowing down light – the usual carrier of quantum information – is an ideal solution.

However, in most communication networks – quantum or conventional – light is not sent through clouds of atoms in free space. For that reason, Julien Laurat and colleagues at the Université Pierre et Marie Curie in Paris decided to test whether slow light could also be demonstrated inside the most common propagating medium: optical fibres. Laurat explains that using fibres would make the memories more compatible with existing optical-information technology. He also points out that because the light is contained in fibres, there is no need for mirrors, lenses and other components that can make free-space optical systems unwieldy.

Thinned fibres

Laurat and colleagues began by elongating an optical fibre until its diameter was less than half a micron. They insert this thinned portion inside a vacuum chamber, which is filled with a cloud of approximately 2000 laser-cooled caesium atoms. Another laser switches the caesium atoms between their opaque and transparent states.

The dimensions of the fibre are crucial to the experiment’s success – because it is thinner than the wavelength of the guided light, about 40% of the light’s energy propagates outside the fibre, in a so-called evanescent field. By interacting with this evanescent field, the atoms can slow and stop the guided light for several microseconds, even though none of the atoms are actually inside the fibre.

Mikhail Lukin, a physicist at Harvard University in Massachusetts, US, who studies slow light, is impressed with the research. He told physicsworld.com that “It combines several previously demonstrated phenomena and techniques to take another step towards making quantum-memory techniques robust and practical.”

Fruitful theory

Anil Patnaik, a physicist at the Air Force Research Lab at Wright-Patterson Air Force Base in the US who first proposed the fibre-optic method with others while working at the University of Electro-Communications in Tokyo in 2002, says it is “exciting” to see his old group’s theory bear fruit. “We knew it was challenging, but the rewards were worth taking the challenge…I still remember the excitement when my calculations showed that [about] 50% of the energy could be available as evanescent field to couple to a medium right outside the fibre,” he adds.

Laurat and colleagues’ demonstration comes alongside a similar experiment by Arno Rauschenbeutel and colleagues at the Vienna University of Technology. Instead of employing a magneto-optical trap to contain the atoms inside the vacuum chamber, as Laurat and colleagues did, Rauschenbeutel’s group employed a dipole trap, which requires the use of another laser. In principle, a dipole trap should improve the atoms’ “optical depth”, or their ability to absorb light – a dimensionless parameter that defines how well a quantum memory can read and write information. In practice, both the French and Austrian groups recorded roughly the same optical depth: about two. “Increasing the optical depth is an important direction,” says Laurat.

Ian Walmsley, a physicist at the University of Oxford in the UK, says that the research is a “good step” along the way to a full quantum memory. He adds that the successful “implementation of the new scheme is very promising”, and that the next step “will likely be to test the noise level, and to store true single-photon states: then it will be fully ready for applications”.

Laurat’s research is described in Physical Review Letters and Rauschenbeutel’s work is in Optica.

Swirling light beams carve intricate patterns

Beams of light polarized into spirals have been used by scientists in the UK to create intricate patterns on the surface of metals. This is the first time that these “logarithmic spirals” have been produced in the lab, and the researchers believe that they could provide valuable insights into the angular momentum of light. On a more practical note, they could also be used in imaging and data-storage applications.

The polarization of light describes the relationship between the direction the light is travelling and the direction in which the light’s electric field is oscillating. Linear polarization involves the electric field oscillating in a fixed direction that is at right angles to propagation, whereas circular polarization involves the direction of the electric field rotating around the direction of propagation. The polarization can also be much more complicated. In a radially polarized beam, for example, the electric field at any point in the beam points in a line from the centre to the edge. In an azimuthally polarized beam, the electric field is at right angles to these lines, thereby forming concentric circles.

In the new research, Walter Perrie of the University of Liverpool and colleagues led by Jinglie Ouyang passed a linearly polarized laser beam through a specialized type of nano-structured plate that outputs either a radially polarized vector beam or, if it is rotated by 90°, an azimuthally polarized beam. “People normally set them up to produce one or the other,” explains Perrie. Instead, the team set the plate at an intermediate angle to produce a superposition of the two states. The resulting beam is a logarithmic spiral that was first described by Descartes and is similar to the shape of spiral galaxies. By altering the orientation of the plate, the researchers could control the proportions of radially and azimuthally polarized light in the beam, thereby altering the curvature and handedness of the spiral. These properties were predicted by Franco Gori of Università degli Studi Roma Tre in 2001, but have never been observed before.

Tiny grooves

The researchers then focused their beams of light onto a steel surface. By a process called surface laser plasmon structuring, the electric fields in the beam created tiny grooves in the surface of the metal. The grooves are at right angles to the local fields, and therefore purely radial fields create azimuthal grooves, purely azimuthal fields produce radial grooves, and logarithmic spiral fields create logarithmic spiral grooves. The team believes that this ability to produce grooves with spacing comparable to the wavelength of light could be useful for encoding information.

The team has also used the process to study the physics of light by looking at what happens when orbital angular momentum is added to the beam of light. This involves having the wavefront of the light twist around the axis of propagation like a fusilli spiral. Under normal circumstances, the intensity of a radially or azimuthally polarized beam is zero at its centre, so the centre of the plasmon-structured surface will not be marked. However, the addition of orbital angular momentum resulted in light intensity at the centre of the beam, and the periodic structures were more blurred at the centre of the spiral. A clear rotation of the vector field was also observed. The team says that this suggests the presence of spin angular momentum, which is carried by circularly polarized light. Indeed, the observation suggests that some of the orbital angular momentum of the beam has been converted to spin angular momentum. “We’ve got to think seriously about what that really means,” says Perrie.

The beauty of photons

“I think this is a significant experimental step to elaborate the beauty of photons that follow a series of twisted patterns in space,” says nanoplasmonics expert Nicholas Fang of the Massachusetts Institute of Technology. “I feel this experimental observation might enable novel applications in high-speed optical cross-sectioning, optical tomography and manipulation with better precisions.”

The research is described in Optics Express.

A guided tour inside D-Wave’s iconic black box


Has D-Wave Systems built the world’s first commercial quantum computer? The Canada-based company says it has but some physicists in the quantum-information community beg to differ. Putting aside heady questions like “Does it work?”, I think everyone agrees that the Tardis-sized black boxes that house D-Wave’s processors look great. But what exactly is inside?

I had a chance to look inside when I visited D-Wave in Vancouver in 2012 and what I saw was lots of empty space: the edges of the box are Helmholtz coils that null the Earth’s magnetic field and the bigger the box the better. Now you can have a look courtesy of Jeremy Hilton – D-Wave’s vice-president of processor development – who plays tour guide in the above video.

You can read more about the controversy surrounding D-Wave in this article: “Is D-Wave’s quantum computer actually a quantum computer?”.

When I was in Vancouver I had a chat with D-Wave co-founder Geordie Rose along with several other quantum-computing experts. You can listen to that conversation in the podcast below.

Physics World podcast: Quantum computing's challenges, triumphs and applications

IceCube neutrinos do come in three flavours after all

High-energy neutrinos detected by the IceCube experiment in Antarctica are equally distributed among the three possible neutrino flavours, according to two independent teams of physicists. Their analyses overturn a preliminary study of data, which suggested that the majority of the particles detected were electron neutrinos. The latest result is in line with our current understanding of neutrinos, and appears to dash hopes that early IceCube data point to "exotic physics" beyond the Standard Model.

Located at the Amundsen–Scott South Pole Station, the IceCube Neutrino Observatory is a large array of photodetectors buried in ice. In late 2013 IceCube revealed that it had captured the first signals from neutrinos with extremely high energies, which suggests that the particles came from outside of our galaxy. While neutrinos generated inside the Sun and by cosmic rays colliding with the Earth's atmosphere have been detected for many years, neutrinos from much farther away had remained elusive. As a result, the discovery was named the Physics World Breakthrough of the Year in 2013.

Neutrinos come in three different types or "flavours" – electron, muon and tau – and change or "oscillate" from one type to another as they travel across long distances. For neutrinos that have travelled arbitrarily large distances, we expect to see nearly equal numbers of each flavour when they reach Earth – that is, an electron:muon:tau ratio of about 1:1:1. Depending how the neutrinos were produced, there will be small deviations from this equal-flavour distribution. This deviation should give us information on how and where the neutrinos were produced.

Abundance of electron neutrinos

In 2014 Olga Mena, Sergio Palomares-Ruiz and Aaron Vincent of the University of Valencia in Spain did an independent analysis of IceCube data from 2010 to 2012, and concluded that the best-fit flavour ratio was 1:0:0 – an abundance of electron neutrinos with no muon or tau neutrinos present. If true, this unexpected result would mean that rare neutrino decays were taking place or that the detected particles were mixing with a fourth and very hypothetical "sterile" neutrino. In both cases, the discovery could have pointed to exotic physics beyond our current understanding.

IceCube detects neutrinos of all three flavours when they produce small showers of particles as they interact within the detector. However, muon neutrinos and a small fraction of tau neutrinos also produce a highly energetic muon that is visible as a track as it travels across the entire detector. "So if we observe such a track, we can tell an event was either a muon or tau neutrino, but not which," says Gary Binder, who is a physicist at the University of California, Berkeley, and part of the IceCube collaboration. He explains, "We can't tell for certain what flavour produced a given event, but we can do a statistical analysis on the distribution of showers and tracks to estimate the abundance of each flavour."

Now, however, Binder and IceCube colleagues have analysed a much larger set of IceCube's data, collected across 974 days from May 2010 to May 2013. They have identified 137 neutrinos with energies above 35 TeV and found that the neutrinos are equally distributed among the three flavours. “No matter what parameters we adjust, there's just no way to get all electron neutrinos, so if we did observe that, it would surely indicate new physics affecting cosmic neutrinos as they travel over long distances," says Binder.

A similar analysis was performed by an independent group in Italy, led by Francesco Vissani and Andrea Palladino at Gran Sasso Science Institute in L'Aquila and the Gran Sasso Laboratories in Assergi. This group focused on neutrinos with energies above 60 TeV, and it also found the data to be consistent with conventional astrophysical models.

Unravelling mysteries

Binder told physicsworld.com, "So far, the flavour ratio is consistent with the equal-flavour assumption, and we don't have enough precision to measure the small deviations that could tell us about the astronomical objects producing cosmic neutrinos, but we expect that to change very soon." He adds, that they "anticipate the information we gather from flavour studies will help us to resolve the mystery of how these neutrinos are produced and where they come from".

Binder also points out that there are a number of exotic ideas that predict much larger deviations from the equal-flavour expectation. "Measuring the flavour ratio could give us clues to physics beyond the Standard Model, but so far we haven't seen evidence for anything exotic yet," he says.

Vissani adds that IceCube also measures the energy distribution of the neutrinos and this provides yet another important clue about their sources. He points out that "future IceCube analyses can show beyond any doubt that these neutrinos come from cosmic sources, by observing for the first time a tau neutrino".

The research is published in two papers in Physical Review Lettersone from Palladino et al. and one from IceCube.

After the cosmic dust settles: telescopes searching the skies for signs of inflation

The cosmos hides its origins well. For the first 380,000 years of its existence, the entire universe was an opaque stew of hot plasma, full of light and matter. The opacity of this “primordial soup” prevents us from directly observing many important moments in cosmic history, including the first instants after the Big Bang, when the universe may – or may not – have expanded rapidly, increasing its size many-fold in a hypothetical period known as inflation. Yet all is not lost. Observing the very early universe is akin to watching a shadow theatre: while the true action takes place behind a screen, we can nevertheless infer what’s going on by the images cast.

According to many theories, the CMB should contain signs of the universe’s inflationary infancy

In this metaphor, the images are the light known as the cosmic microwave background (CMB). When the cosmos became a transparent gas of atoms, the light from the primordial soup was freed to travel all the way until it reaches us in the present, providing a very clean view of the first years of cosmic history. Better still, imprinted in the CMB are hints of what came before. Fluctuations in the CMB tell us, for example, the geometry of the universe and how much ordinary and dark matter it contains. And according to many theories, the CMB should also contain signs of the universe’s inflationary infancy.

In 2014 scientists working on the BICEP2 (Background Imaging of Cosmic Extragalactic Polarization) telescope announced they had seen evidence of inflation in the CMB. This claim was met first with enthusiasm, then with scepticism as data from the space-based Planck observatory demonstrated that the signal interpreted as inflation could, in fact, be entirely accounted for by dust molecules in the Milky Way. It’s as though the shadow-theatre screen were dirty, making it hard to tell what’s really going on behind it.

But while it’s wrong to say that BICEP2 discovered evidence for inflation, it’s just as wrong to say that Planck ruled it out. Dust never settles for long on cosmology, and now that researchers have a much better idea of what the observational challenges are, they are hard at work addressing them. “Sometimes people express more pessimism than I think that they should, because there are many experiments going forward,” says Renée Hložek, a cosmologist at Princeton University. The experiments Hložek mentions include an upgrade to the South Pole-based BICEP2 (called, a bit unimaginatively, BICEP3); the Atacama Cosmology Telescope polarization project (ACTPol) in Chile; and a balloon-borne telescope called Spider, which flew high in the Antarctic sky in January.

These experiments are designed to compensate for the weaknesses of the Planck and BICEP2 observations. Between them, we should know within the next few years if there really is any sign of inflation hiding in the CMB data, as observations from all of them are combined and compared to give us our clearest view yet of the shadow-play that is the early cosmos.

Inflation’s ‘smoking gun’

Despite their different characteristics, all of these next-generation experiments are looking for the same thing. According to inflationary theory, the extremely rapid expansion during the first tiny split second after the Big Bang – during which the universe grew perhaps by as much as a factor of 1060 – should have created primordial gravitational waves, which are turbulent churnings of the structure of space–time itself. Those waves stretched and compressed the cosmic plasma, affecting the way it interacted with the light infusing it. The result: a subtle but distinctive curl in the polarization of CMB light. Because the form of the polarization looks like the twisting of a magnetic field, or B-field, the gravitational-wave polarization is known as a “B-mode”.

Generally speaking, though, polarization is just the orientation of the electric field in the electromagnetic wave that is light, and many different things can affect that orientation. And therein lies the rub. Light from the CMB took 13.8 billion years to travel to us, and it encountered a lot of things on its journey: galaxies, clusters of galaxies and finally dust inside our own Milky Way. As researchers with the Planck observatory discovered to the dismay of many, light emitted from spinning molecules in galactic dust can mimic the polarization patterns from primordial gravitational waves. If that wasn’t bad enough, the joint analysis of Planck and BICEP2 data showed that dust could possibly account for the entire reported inflationary signal.

But could is the operative word. “It’s now known how much dust is there, so we know what we have to deal with,” says Arizona State University cosmologist Sean Bryan. That knowledge helps, because galactic dust glows more brightly in some frequencies than others. And whereas BICEP2 operated primarily at a single frequency of microwave light, the next wave of observatories scans the sky at multiple frequencies. By comparing polarization data taken at frequencies where the dust signal is strongest to data taken where it’s least important, researchers can effectively subtract its effects. That leaves – maybe – the telltale sign of primordial gravitational waves.

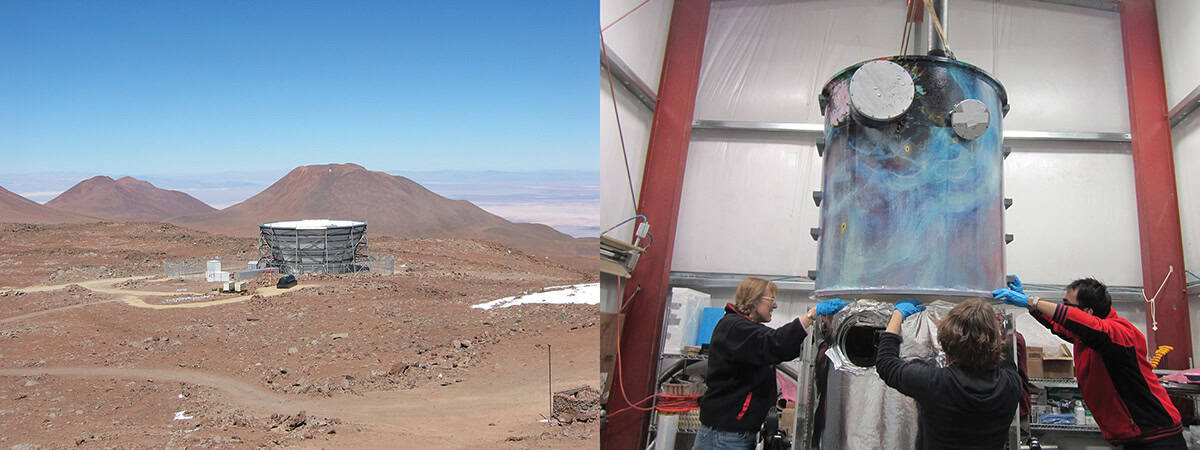
The Atacama Cosmology Telescope and its cryostat

Many eyes in the sky

Bryan has reasons to be excited by that prospect. As a graduate student at Case Western Reserve University, he helped develop the instruments for Spider, the airborne experiment that launched near Antarctica’s McMurdo Station on New Year’s Day this year. (“Spider” was originally an elaborate acronym of the type favoured by cosmologists, but it became the experiment’s official name as the mission evolved.) Suspended beneath its building-sized balloon, Spider travelled through the upper atmosphere for 16 days, scanning the sky with a telescope 30 cm across. After the researchers retrieved the data from the ice, they got to work analysing it, and they hope to announce their findings by this autumn.

Spider uses two sets of detectors that operate under the same principle as many 3D movie glasses: one set is sensitive to vertically polarized light, while the other picks up horizontal polarization. But instead of combining two slightly different images to create the illusion of depth, researchers with Spider use images from each detector to reconstruct the variations in polarization across the sky.

BICEP3, for its part, operates on very similar principles. As Bryan points out, the successor to BICEP2 is nearly the same instrument as Spider: the telescopes are the same, they scan the same frequencies (90, 150 and 220 GHz) and they were built with identical detectors. In both instruments, these detectors are chilled to a fraction of a degree above absolute zero; because the light from the CMB corresponds to a temperature of 2.7 K, the type of detectors in Spider and BICEP have to be colder than that to see anything at all, and the colder they are, the more accurate their results will be.

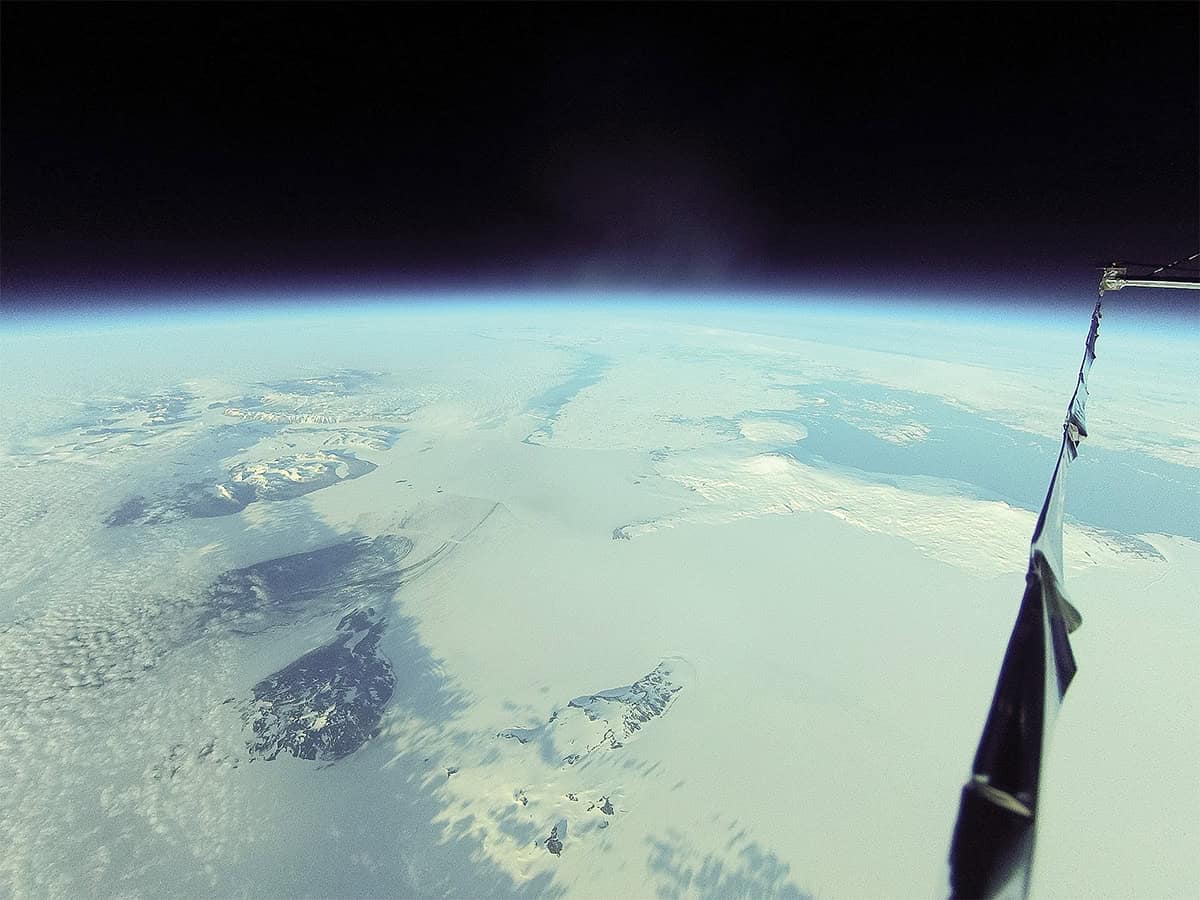
Spider telescope's onboard GoPro camera image of Earth and space

The main difference lies in where they are designed to operate. Spider flew approximately 34 km above the ground, where the air pressure is 0.1% of what it is at sea-level. While it did not travel to space per se, photos from Spider’s onboard GoPro camera show a space-black sky above, even as the ground below is in full Antarctic summer sunlight. BICEP3, meanwhile, is located on the ground at the South Pole. As Bryan points out, ground-based telescopes must account for the small amount of light coming from the atmosphere itself and subtract it (much as visible-light telescopes must do to compensate for stars “twinkling”); Spider flew sufficiently high that it didn’t need to perform that subtraction.

The Atacama Cosmology Telescope, on the other hand, is an entirely different beast. A 6 m-diameter instrument, it operates at five frequencies (30, 40, 90, 150 and 230 GHz, overlapping the BICEP3 and Spider range) and Hložek explains that its mission is quite broad. As well as looking for signs of inflation in the CMB, it will also investigate topics such as what the first stars were like and how the universe shifted from the neutral, opaque primordial soup to the thinner, mostly ionized environment we observe today.

But while the search for primordial gravitational waves makes up only part of the ACT’s mission, it is nevertheless in a prime position to contribute to the hunt. The ACT points at a fixed angle relative to the ground, but it can rotate from side to side, and since different parts of the sky come into its field of vision over the course of a year, it will eventually map a much broader region than either BICEP3 or Spider in microwave light. The ACT’s location in the high, dry Atacama Desert also gives it a different swath of the sky to observe compared with the Antarctica-based Spider and BICEP3, but crucially, it also overlaps, in part, with the relatively small BICEP3 field of view. “It’s actually really important to have multiple experiments looking for slightly overlapping multiple ranges of the sky, because that allows us to independently check stuff,” says Hložek. The cosmic-dust component of BICEP2’s signal, she notes, was first identified by comparing Planck and BICEP measurements of the same patch of sky.

Best and worst cases

This suite of well-designed experiments makes Hložek optimistic that we’ll find the polarization footprint of inflation, if it’s there to be found. University College London cosmologist Hiranya Peiris is among those eagerly awaiting the results. Peiris is deeply involved in both the theoretical and observational sides of the quest to understand the very early cosmos, and she is particularly interested in inflation, which she describes as less a theory than a whole set of mathematical models. While inflation predicts that there will be primordial gravitational waves, she explains, different models of inflation predict different amplitudes. That means it’s important to have specific predictions that can be tested against real data from the observatories, Peiris says – but it also means that the polarization signal from inflation could be too weak for even the next generation of experiments to detect it.

In many ways, that would be the worst-case scenario for inflation researchers, because the lack of a clear signal wouldn’t rule out inflation entirely – it would just keep us in doubt for longer about what happened in the moments after the Big Bang. Even in that case, though, Peiris still sees a benefit. “Just to rule out that class of models that gives you the high-scale inflation is a very significant achievement in itself,” she says. And in the best-case scenario, she adds, studies of cosmic inflation would give us a direct view into the kind of “very very high-energy physics that we can’t probe in the laboratory”. With that prize in mind, Peiris says that if problems such as cosmic dust limit the progress that can be made from the ground, “there is a call here to think about the next-generation space-based experiment”.

When faced with the challenges of observation, Bryan keeps in mind how marvellous it is that we’re studying the early universe at all. “Stepping back, it’s really exciting to make a measurement that even relates to this,” he says. Our ultimate cosmic origins may be hiding now, but the cleverness of cosmologists may yet pull aside the shadow-theatre screen to reveal inflation – or something unexpected.

Clap your eyes on the first ‘images’ of thunder

The first images of thunder, created by visualizing the sound waves created by artificially triggered lightning, have been taken by an international team of researchers. The novel experimental approach provides an entirely new way of investigating lightning, which may help to answer outstanding questions about the physics that underlies this intense natural phenomenon.

Although bolts of lightning strike the Earth more than four million times each day, much of the specific physics behind this process remains a mystery. "While we understand the general mechanics of thunder generation, it's not particularly clear which physical processes of the lightning discharge contribute to the thunder we hear," says group leader Maher Dayeh, of the Southwest Research Institute in the US, who developed the new method together with colleagues in Australia and the US. Dayeh explains that some outstanding questions include how lightning is initiated, what controls its movement through the atmosphere, and how it strikes objects near the ground.

Forked leaders

Lightning strikes begin with the build-up of electrostatic charges in storm clouds – these form channels of negatively charged, ionized air, or "leaders", which fork downwards. When they reach the ground, these leaders create a bridge of low resistance, through which discharge can occur – with positive charge racing up the channel in a series of nearly instantaneous return strokes. "When lightning does strike something, very large currents flow, heating up the channel to about 27,760 °C. The hot channel rapidly expands, making the thunder that we hear and can measure," explains Joseph Dwyer, of the University of New Hampshire, who is part of the team. He adds that because "the thunder is created close to the time that all this is happening, it provides a window into what's going on when lightning strikes".

As lightning's unpredictable nature makes it difficult to study in the field, the researchers conducted their experiments on artificially triggered strikes instead. To generate lightning, the team launched small rockets into storm clouds as they passed overhead. The rockets had long, trailing copper wires attached – these provided a conductive channel through which lightning would predictably strike – onto which the team could focus their instruments.

Lightning rockets

The rockets were launched from the International Center for Lightning Research, which is based in Florida in the US. The centre's location takes advantage of the state's record high frequency of lightning strikes, with the geography of the Florida peninsula promoting the formation of warm, humid updrafts, which generate very active thunderclouds at high altitudes.

To record the acoustic signature of thunder, Dayeh and colleagues designed a large array of 16 microphones, each spaced one metre apart. These were lined up 95 metres from the launch pad where the lightning would hit. Following each strike, post-processing and directional-amplification techniques were used to convert the recordings into a vertical acoustic profile of the lightning bolt. With sound waves from higher up in the atmosphere taking longer to reach the receivers, each return-stroke signal has a characteristically curved appearance. In their study, the researchers imaged strikes with at least nine separate return strokes and found that the loudest part of the thunderclap comes from where the bolt meets the ground.

Craig Rodger – a physicist at the University of Otago in New Zealand who was not involved in this study – commends the work for offering a new way to investigate lightning, which he expects will lead to interesting new knowledge. "Even now, we are learning totally new things about lightning and the processes that take place during a discharge," he says.

With their proof-of-concept study complete, Dayeh's team is now working on refining its technique to better explore the outstanding mysteries around lightning generation. One potential avenue of investigation, for example, would be in triggering lightning with a more natural, zigzag appearance – rather than the straight form created by the wires in the current set-up. From this, they might distinguish between the different components of lightning – current pulses, discharge-channel zigzags and step-leader branches – and analysing their acoustic signals independently.

The research was presented earlier this week at the 2015 Joint Assembly, and is due to be published in Geophysical Research Letters.

Copyright © 2026 by IOP Publishing Ltd and individual contributors