Quantum-inspired art

“Other artists use oil paints or watercolour as media,” said Eric Heller, a professor of chemistry and physics at Harvard University who creates digital art based on his research. “I use quantum phenomena like resonance and branch flow.” He pointed to Random Sphere I – a painting of what looked like a golden globe covered by a dense tangle of darker lines, resembling the turbulent surface of the Sun. “Here my medium is a random wave.”

Heller and I were at the opening in December of “Art and the quantum moment” – a show held in the art gallery at the Simons Center for Geometry and Physics at Stony Brook University in New York. Curated by Lorraine Walsh, it was inspired by a book I co-authored with Alfred Scharff Goldhaber called The Quantum Moment: How Planck, Bohr, Einstein, and Heisenberg Taught Us to Love Uncertainty (Norton 2014). The book describes how and why the imagery and language of quantum mechanics went mainstream and came to influence art and culture.

Although Heller and the other two artists in the show – Frédérique Swist and Jacqueline Thomas – are not mentioned in the book, they each draw inspiration from quantum mechanics in different ways.

Eric Heller

Heller first got interested in photography when he was a graduate student at Harvard (1968–1973). He then started to paint as a professor at the University of California, Los Angeles, before mastering computer graphics while on sabbatical at Los Alamos National Laboratory in 1981. Heller’s artistic activity really took off, however, when he moved to the University of Washington in 1984 and began to graphically reimagine some of the phenomena he was examining (see www.ericjhellergallery.com).

“I was studying branch flow,” he told me, “or what happens when you launch a series of electrons from a single point at slightly different angles and let them flow over the equivalent of a bumpy floor.” Heller recalled that he started to play with the patterns graphically. He pointed to Transport XIII, which shows a dense set of differently coloured electron paths branching out from a point, juxtaposed with a random quantum wave on the surface of a sphere. The eerie result looks like a silver moon rising over a tangle of multicoloured threads.

We walked past Heller’s eight other works in the show. These, too, are graphical reimaginings of quantum phenomena he has studied. “I choose an image that I’ve found while playing around with the media,” he explained, “then finish it in Photoshop without making significant structural transformations to the original images.” However, Heller admits to being quite selective. “I’m very choosy. Some of these images would not work for me at all if the colour changed by 1%.” All his images nevertheless have science behind them. “I’m not a mathematical tourist,” he insists.

When I asked him what that meant, Heller drew a comparison. “It’s the difference,” he said, “between a tourist with a good camera taking a picture of some pretty piece of landscape and hanging it on the wall – and a geologist who is an expert in the landscape who recognizes that a particular formation illustrates a fundamental part of the region’s geology and is also pretty, taking a picture of that, and hanging it on the wall.”

Frédérique Swist

Frédérique Swist, senior designer at IOP Publishing, which publishes Physics World, contributed two works to the exhibit, and also came for the opening. Her work (fredswist.co.uk/gallery.html) often illustrates properties of wave interference, resonance, oscillations, and excitation functions. Swist says she often begins with technical graphs, then – unlike Heller – significantly transposes and reconstructs them.

One of her works on display was Excitable Waves (2010), which reinterprets the distribution of excitation functions in a study of biological cells adhering to physical surfaces. It was inspired by a figure in a paper published in the journal Physical Biology in 2009. “As I worked on it and added different lines and levels of colour,” Swist told me, “it acquired more layering and depth, and grew to become an image in its own right.”

Good Vibrations – Swist’s other piece in the show – was inspired by a project exploring the theme of affirmation and positivity that she was asked to join. In it Swist drew on her visual vocabulary of graphs and diagrams to produce a startling set of optical effects that she called a “visual rhythm”. Although depicted on a flat plane, the forms create a 3D effect of several superimposed planes that seem to vibrate, even expand and contract.

Jacqueline Thomas

A plinth in the gallery displayed two handmade, limited-edition books by British artist-designer Jacqueline Thomas from the Stanley Picker Gallery at Kingston University (www.jacquelinethomasbooks.co.uk). Equations (2005) and Constants (2006) consist of hand-sewn and hand-bound pages on which Thomas has created “digital collages”, fitting graphics with equations and spelled-out constants together in a puzzle-like fashion until the result looked right to her.

“I am fascinated by the knowledge that complex explanations can be simplified into a series of numbers and symbols,” Thomas told me. “As someone who recognizes the significance of the equations and constants, but without any real understanding, I can only respond to their beauty in visual terms. However, they were carefully selected by someone who understands and refers to the ‘beauty of mathematics’ – my astrophysicist daughter.”

The critical point

Classical mechanics has long had an impact on graphic arts, which persists to this day in the form of maps of self-similar systems associated with a relatively recent branch of mechanics, chaos theory. It is not surprising that the weirdness of quantum mechanics is also influencing graphic artists – be it Heller’s reimaginings of quantum phenomena, Swist’s transformations of representations of the incredibly precise and reproducible patterns, or Thomas’s collages based on the imagery of the language in which quantum language is expressed.

Big data offers biomedical insights

By Susan Curtis in Baltimore, US

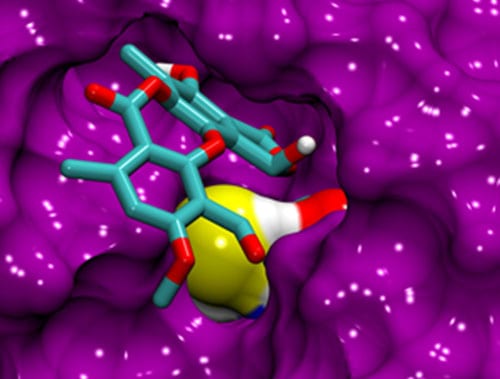
At the 59th annual meeting of the Biophysical Society today, Rommie Amaro of the University of California, San Diego, highlighted the power of computational methods to speed up the discovery of new drugs to treat diseases as diverse as flu and cancer. Amaro focused on a recent project conducted while she was at the University of California, Irvine, to identify compounds that could play a vital role in future anti-cancer drugs by helping to reactive a molecule called p53 that is known to inhibit the formation of cancer cells.

(more…)

Geophysicists blast their way to the bottom of tectonic plates

A thin, low-viscosity layer at the base of a tectonic plate has been imaged at a depth of 100 km beneath North Island, New Zealand, by an international team of researchers. Using underground dynamite explosions, the high-resolution seismic imaging – which has revealed previously unknown information about what happens underneath tectonic plates – may help to explain how tectonic plates are able to slide.

While the movement of tectonic plates across the Earth’s surface has long been studied, some underlying features of the process are not understood, leaving many questions unanswered. Developing an improved understanding of the lithosphere–asthenosphere boundary is essential. Previous approaches to studying these depths have been based on the recording of seismic waves, sourced from distant earthquakes, which have been reflected from the boundary up to the surface. As the waves travel they split into both longitudinal and transverse waves, which travel at different speeds. The relative arrival times reveal the depth of reflective boundaries, while the shape of the converted waveforms offers information on each boundary’s sharpness. With a wavelength of 10–40 km, however, such waves offer only low-resolution imaging.

Slipping plates

Deploying the seismographs that will image the tectonic plate

“The idea that the Earth’s surface consists of a mosaic of moving plates is a well-established scientific paradigm, but it had never been clear about what actually moves the plates around,” says Tim Stern, a geophysicist at Victoria University of Wellington. To obtain a clearer picture, Stern and colleagues used man-made, higher-frequency seismic waves, with a wavelength of around 0.5 km, generated by setting off explosions at the bottom of boreholes 50 m deep. A similar technique is commonly used in the petroleum industry in exploration.

To measure the reflected waves, the team laid out 877 portable seismographs along a 85 km line at the bottom of New Zealand’s North Island, in a region where the 120 million-year-old Pacific Plate and Hikurangi Plateau are subducting under continental New Zealand. This region was chosen because it meets a combination of useful criteria – an oceanic plate, with a shallow-enough dip to be seismically imaged, under a continental landmass on which sizable dynamite explosions can be detonated.

Boundary reflections

Originally, the researchers had only set out to image the boundary between the subducting Pacific plate and the Australian plate that lies over it. Their aim was to learn more about the plate interface, which lies at a depth of 15–30 km, and the potential risk it poses to the nearby Wellington region. “The big surprise was getting the coherent reflections from the lithosphere–asthenosphere boundary in the first place,” says Stern. “We just happened to run long records after each explosion, and were surprised to see these much deeper (~100 km deep) reflections emerge.”

At this depth, the researchers’ analysis revealed not only a boundary (<1 km) between the plate and the underlying mantle – contrasting with previous models of a simple thermal boundary transition – but also a 10 km-thick sheared channel underneath. From the decrease in seismic velocity, the team inferred it to be a low-viscosity layer. This may possibly represent a phase change to rock with a small percentage of melt or water content, pooled by plate motion through a process referred to as “strain localization”.

Push or pull?

With similar layers having also been proposed elsewhere – including a thicker channel beneath a younger section of the Pacific plate and a possible channel at the base of a continental plate off the Norwegian coast – the researchers suggest that such channels could be a universal feature of the lithosphere–asthenosphere boundary. Such a finding would help support the proposed “slab-pull mechanism” of plate tectonic movement – allowing the plates to glide with little resistance over the asthenosphere with subduction driven by their own weight. The layer would also serve to decouple the plates from the underlying mantle, making the convection-driven theory of plate tectonics – wherein the driving force is thought to be large-scale convection currents in the upper mantle that are transmitted through the asthenosphere – less probable.

“The results are striking. Changes in seismic velocity have to occur more rapidly (over distances less than 1 km) than previously suggested in order to generate the reflection,” says Stewart Fishwick, a geophysicist at the University of Leicester in the UK who was not involved in this study. He adds that “further interpretations suggest a very thin (less than 10 km) low-viscosity channel, which has implications for the dynamics of the mantle”.

The researchers are now looking at the possibility of reproducing their study perpendicular to the current line, along the strike of the eastern North Island. In addition, the team will also be exploring how such a low-viscosity channel might form.

The research is described in Nature.

Dark matter seen in the Milky Way’s core

An international team of astronomers has found the best evidence yet that the inner core of the Milky Way contains significant quantities of dark matter. The result confirms the long-standing belief that the centre of the Milky Way is rich in dark matter, just like its outer regions. While the researchers have deliberately avoided using any specific models of dark matter in their analysis, they are confident that further studies of the galactic core could help identify which models are most viable.

Scientists first inferred dark matter’s existence from the fact that galaxies such as the Milky Way rotate faster than would be expected if they were held together by just the gravitational forces between visible matter such as gas, dust and stars. While it is apparent that the gravitational attraction of invisible dark matter is holding galaxies together, it has proved very difficult to measure the distribution of dark matter in the core of the Milky Way. This is because the complicated distribution and dynamics of conventional matter in the core makes it very tricky for astronomers to work out exactly where the dark matter should be.

In the new research, Fabio Iocco of the ICTP South American Institute for Fundamental Physics in São Paolo and colleagues in Sweden and the Netherlands have combined data from several recent observations of the Milky Way and compared it with theoretical predictions of how fast the core should be rotating.

Tricky measurements

The team looked at 2780 measurements of the motions of interstellar gas, stars and interstellar masers. These provide information about the rotation rate of our galaxy at distances between 3–20 kpc from its centre. To put this in perspective, the Sun is about 8 kpc from the centre and the vast bulk of the Milky Way lies within an 18 kpc radius. The team combined these data to arrive at the angular velocities of the galaxy at a number of different radii. The researchers then compared these figures with the angular velocities that would be expected if the galaxy contained no dark matter. This is tricky, explains Iocco, because we are inside the galaxy and moving with it, and this perspective makes it difficult to determine both the distance and the circular motion of other objects. “There is not full agreement in the literature on the exact distribution of stars in the Milky Way,” he notes.

Most researchers studying the galaxy choose “their favourite model of the morphological distribution of visible matter”, says Iocco. In this study, however, the team considered every accepted possibility in the literature, calculating the rotation curve – the rotation rate of the galaxy as a function of radius – that would be predicted by this distribution if there were no dark matter present. “None of these fit the observed rotation curve,” says Iocco, which implies that “none of the possible distributions of visible mass fit the total mass inferred in the galaxy – there is some missing mass even in the worst case”.

The team calculated the difference between the observed and theoretical rotation curves at a large number of different radii between 3–20 kpc. Differences are seen at all radii and although the statistical significance is relatively small at 3 kpc, it rises to above 5σ beyond 6–7 kpc. This figure of 5σ is considered to signify a discovery in particle physics.

Does Newtonian dynamics hold true?

This result means that there are significant quantities of dark matter well inside the 8 kpc radius of the Milky Way, provided that Newtonian dynamics holds true. This last qualification is crucial, because a minority of astrophysicists argue that the discrepancies between predicted and observed rotation curves are better explained by modifying Newtonian dynamics at large distances, rather than the presence of invisible matter (see “Gravity’s dark side”). The researchers believe, however, that by examining the galactic dynamics on comparatively small scales, their results will shed some light on this debate. Indeed, the team plans to address this issue in the future.

Jorge Peñarrubia of the Royal Observatory of Edinburgh believes that the research is an important step towards quantifying the amount of dark matter in the Milky Way. “The number of data they’ve compiled is certainly going to be crucial in trying to determine the amount of dark matter in our galaxy,” he says. However, he adds that “The next step will be to try to construct a dynamical model that can explain the motions that other people have measured. That’s going to be the difficult part.” Dan Hooper of Fermilab in Chicago agrees. “This study shows – conclusively in my view – for the first time that there is about the same amount of dark matter that we had predicted there should be in the innermost parts of the Milky Way,” he says. “It’s a pretty big step forward and one that I hope will continue as we get more information from things like the Gaia telescope, which will be able to measure even more stars with more precision.”

The research is described in Nature Physics.

  • In the following video Luke Davies of the University of Bristol explains how the presence of dark matter is inferred from the rotation of galaxies.

Physics meets biology in Baltimore

By Susan Curtis in Baltimore, US

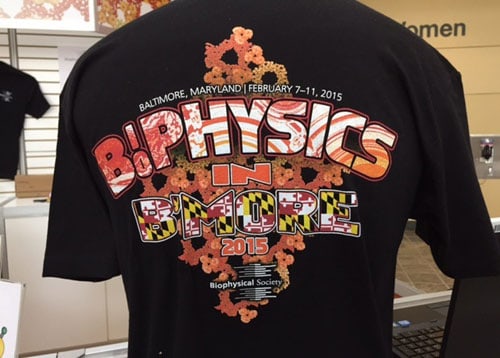
I’m in Baltimore this week for the 59th annual meeting of the Biophysical Society. The field of biophysics has grown rapidly in recent years as physics-based techniques have opened up new ways to study and understand biological processes, but with my limited knowledge of biology I was nervous that I would feel a little out of my depth.

The first talk of the “New and Notable” symposium helped to allay my fears. Michelle Wang is a physicist at Cornell University in the US who exploits optical techniques to trap and manipulate biomolecules. While established methods can only trap a single biomolecule at a time, Wang and her colleagues have pioneered the use of nanophotonic structures that can trap multiple biomolecules in a standing wave created within an optical waveguide.

“Our optical-trapping innovation reduces bench-top optics to a small device on a chip,” Wang told physicsworld.com when the team first reported their so-called nanophotonic standing-wave array trap last year. Since then, Wang and her colleagues have been working to integrate fluorescent markers with the nanophotonic trap to track the position of individual biomolecules, and have also been experimenting with optical waveguide materials other than silicon to improve performance and enable new applications.

(more…)

Particle pioneer Val Fitch dies at 91

The US physicist Val Fitch, who shared the 1980 Nobel Prize for Physics with James Cronin, died on 5 February at the age of 91. Fitch and Cronin were awarded the prize for the discovery in 1964 that subatomic particles called K-mesons violate a fundamental law in physics known as CP symmetry, allowing physicists to make an absolute distinction between matter and antimatter.

Three of the most important symmetry operations in physics are charge conjugation, C, in which the particles are replaced by their antiparticles; parity inversion, P, in which all three spatial co-ordinates are reversed; and time reversal, T. In experiments conducted on the Alternating Gradient Synchrotron at the Brookhaven National Laboratory in 1964, Fitch and Cronin showed that the decay of K-mesons violated the general conservation law for weak interactions known as CP symmetry.

Violating symmetry

Fitch and Cronin studied long-lived K-mesons, which decay into a variety of particles including three pions. However, the physicists found that, in 0.2% of the cases, long-lived neutral K-mesons actually decay into pairs of charged pions. If CP symmetry were conserved, a neutral K-meson could not decay into two pions, so the very existence of this decay demonstrated that the electroweak force does not obey CP symmetry. The Nobel prize was given to Fitch and Cronin “for the discovery of violations of fundamental symmetry principles in the decay of neutral K-mesons”.

Born on 10 March 1923, Fitch worked as a technician on the Manhattan atomic-bomb project during the Second World War at Los Alamos, New Mexico. In 1948 he then graduated from McGill University with a degree in electrical engineering, before completing a PhD at Columbia University in 1954. During his PhD, Fitch designed and built an experiment to measure gamma rays emitted from atoms in which an electron is replace by a muon. After obtaining his doctorate, Fitch moved to Princeton University, where he remained for the rest of his career. He also served as president of the American Physical Society from 1988 to 1989.

Poetry please, a protein-folding app for your phone, and a new home for the Institute of Physics

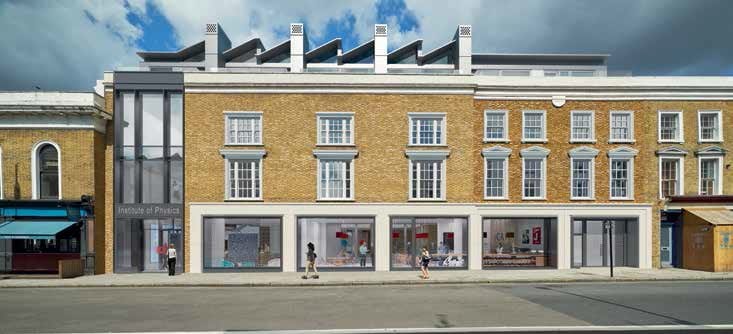
Artist's impression of the new headquarters of the Institute of Physics

By Hamish Johnston

You may not know it, but you could be a poet.

The European Space Agency (ESA) and the Hubble Space Telescope have just launched a contest to find the best “Ode to Hubble” as part of the celebrations for Hubble’s 25th birthday. Although described as an ode, the contest is actually looking for a short video tribute to Hubble that can include verse, song, prose as well as still and moving images. The piece can either be about the telescope or one of its many discoveries. There are two age categories, one for “generation Hubble” – those born after its launch – and one for over 25s. So look to the stars and get those creative juices flowing.

(more…)

Planck pins down the end of the cosmic ‘dark ages’

The first stars and large-scale structure in our universe formed much later than previously thought, according to the latest maps and data from the European Space Agency’s Planck telescope, which has been scrutinizing the polarized fossil light from the early universe. Planck’s new timeline pinpoints when star formation began in the nascent universe. This signalled the end of the cosmic “dark ages” and knowing when it occurred will help improve our understanding of the earliest epochs of the universe.

Some 380,000 years after the Big Bang, its thermal remnant – known as the cosmic microwave background (CMB) – emerged when neutral atoms first formed and space became transparent to light. While the CMB covers the whole sky at microwave wavelengths, it also includes some detailed information in the form of variations in temperature and polarization. These variations are thought to reveal density fluctuations in the early universe, which were the seeds of the stars and galaxies that we see today.

Indeed, as the universe became neutral, it became nearly unobservable across most of the electromagnetic spectrum, as all of the emitted short-wavelength spectrum was quickly absorbed by the atomic gas. This period is referred to as the “dark ages” and prevailed until some very dense regions began to collapse thanks to gravity. This led to the formation of the first dense structures within the neutral medium.

Lighting up

Gradually, the energetic radiation emitted by these early sources ionized all of the neutral hydrogen in the universe. This is referred to as the “epoch of reionization” and is of great interest to researchers because it tells us how the clumpy, structured universe that we see today evolved from the smoothly distributed matter that existed during the dark ages.

As soon as the bulk of the universe was reionized, light at many wavelengths could travel across the universe from the early sources, revealing the edges of the universe that we see today. Electrons and protons could finally combine and form neutral atoms without being torn apart by incoming photons that would scatter off them. The CMB photons are stamped by their last encounter with dark-age electrons (called the “last scattering surface”), and this is preserved in the CMB’s polarization. As a result, the polarization of the CMB provides crucial information about the ages and locations of first stars and galaxies.

Launched in 2009, Planck mapped the entire sky in nine different frequencies until 2013. Using its Low Frequency Instrument (LFI), which covers the 30–70 GHz range and the High Frequency Instrument (HFI), which spans six frequency bands from 100 to 857 GHz, the Planck collaboration has drawn up the most intricate maps of the of the CMB to date. Apart from Planck, more than 100 experiments have studied the CMB since it was first discovered, including NASA’s Cosmic Background Explorer (COBE) satellite and its Wilkinson Microwave Anisotropy Probe (WMAP). In fact, the CMB spectrum is the most precisely measured black-body spectrum in nature.

“After the CMB was released, the universe was still very different from the one we live in today, and it took a long time until the first stars were able to form,” says Marco Bersanelli of Università degli Studi di Milano, Italy. “Planck’s observations of the CMB polarization now tell us that these ‘dark ages’ ended some 550 million years after the Big Bang – more than 100 million years later than previously thought,” he adds, explaining that, while 100 million years may seem negligible compared to the universe’s age of almost 14 billion years, the timescale has a large impact when it comes to the formation of the first stars.

Later date

Previous measurements of the CMB polarization made by WMAP seemed to suggest that the reionization began some 450 million years after the Big Bang. But this was troublesome, as deep-sky images from the NASA–ESA Hubble Space Telescope provided a census of the earliest known galaxies in the universe, which started forming some 300–400 million years after the Big Bang. However, these galaxies would not have been powerful enough to tip the universe into the reionization epoch and end the dark ages at the 450-million-year mark. Researchers would have had to invoke some more exotic sources of energy to let that happen.

Now though, thanks to Planck, the problem is significantly minimized, as the earliest stars and galaxies alone might have been enough to drive the process. “From our measurements of the most distant galaxies and quasars, we know that the process of reionization was complete by the time that the universe was about 900 million years old,” says George Efstathiou from the University of Cambridge in the UK. “But, at the moment, it is only with the CMB data that we can learn when this process began.”

This later end of the dark ages also implies that it might be easier to detect the very first generation of galaxies with the next generation of telescopes such as the James Webb Space Telescope.

The research is to be published in Astronomy and Astrophysics. Preprints of all the Planck papers are available online.

Photons simulate time travel in the lab

Physicists in Australia claim to have simulated time travel using fairly standard optical equipment on a lab bench. They say they have prepared photons that behave as if they are travelling along short cuts in space–time known as “closed time-like curves”, and add that their work might help in the long-sought-after unification of quantum mechanics and gravity. Others, however, argue that the research does little or nothing to establish whether time travel is possible in nature.

Although everyday experience suggests the impossibility of travelling backwards or forwards in time, Einstein’s general theory of relativity does not rule it out. The theory allows for loops in space–time called closed time-like curves that could be created by very powerful sources of gravity such as black holes. These structures would bring an object back to a place and a time that it had already passed through, typically via a short cut between the two separated regions of space–time known as a wormhole.

Grandfather clause

In classical physics the existence of closed time-like curves would lead to a number of paradoxes. One of the best known of these is the grandfather paradox, in which someone who has travelled backwards in time kills their grandfather while he is still young, thereby preventing their own birth. In quantum mechanics, however, such paradoxes can be avoided.

The quantum-mechanical equivalent of the grandfather paradox involves a subatomic particle that has two states – one and zero – corresponding to “alive” and “dead”. The paradox emerges if the particle started out in state one, travelled backwards in time, met a younger version of itself and then flipped the value of its earlier self to zero.

But in 1991 David Deutsch of Oxford University showed that the probabilistic nature of quantum mechanics comes to the rescue. Deutsch found that there would always be a state that a quantum particle could assume that would make the particle’s trip back in time a safe one. For example, if the particle were to start out in an equal mixture of one and zero, when flipped it would remain in that state – a 50:50 mixture of one and zero.

Disappearing down a wormhole

In the latest work, Martin Ringbauer and colleagues at the University of Queensland in Brisbane set out to reproduce Deutsch’s model in the laboratory. But given the absence of any real closed time-like curves in the vicinity of their lab, they were not able to directly study the interaction between younger and older versions of the same quantum particle. Instead, they used two separate particles. The idea is that the “younger” particle remains in normal space–time, while the “older” one disappears down a simulated wormhole, reappears in the “past” and then interacts with its junior partner.

To implement their scheme, the team generated pairs of single photons by shining a laser beam through a nonlinear crystal. The younger photon was encoded by polarizing it – with horizontal polarization representing zero, vertical polarization representing one and intermediate polarization representing superpositions. That photon then interfered with its older partner in a beamsplitter, and the outcome was recorded by a pair of detectors.

Consistency condition

One of these detectors constitutes the entrance to the “wormhole” and is used to record the state of the older photon to ensure that is in the same state as it is at the beginning of the experiment – the point at which it emerges from the wormhole. In this way, the scheme satisfies the “consistency condition” that Deutsch imposed on his model to remove the paradoxes from time travel – that whatever goes into a wormhole emerges from it unchanged.

Encoding the younger photon arbitrarily with one of 32 different polarizations and fixing the state of the older photon to satisfy the consistency condition, the researchers showed that they could indeed meet this condition. They also found that the presence of a closed time-like curve allows an observer to perfectly distinguish non-orthogonal states of the time-travelling photon, such as horizontal and diagonal polarizations. This is something that cannot normally be done in quantum-mechanical systems.

Encryption buster

According to project leader Tim Ralph, this result suggests a way to break quantum encryption, since any eavesdropper with access to a closed time-like curve would in principle be able to make a perfect copy of the secret key and so avoid revealing his or her presence via quantum measurements. More broadly, he says, the research could provide an insight into the tension between quantum mechanics and general relativity, given that closed time-like curves are only possible with strong gravitational curvature.

Todd Brun of the University of Southern California describes the work as a “very nice experimental demonstration of some of the bizarre consequences” of Deutsch’s model, although he says that the research is not able to test the model itself. Others, however, are more critical.

Entirely predictable

Charles Bennett of IBM says that the results from the experiment are “entirely predictable from well-established principles of quantum optics” and that what is instead needed is “continued theoretical exploration of closed time-like curves’ consistency with, and consequences for, other parts of physics”. He also believes that the experimental set-up “does not function as a mechanism for reliably distinguishing non-orthogonal states”. This is a view shared by Antoni Wójcik of Adam Mickiewicz University in Poland, who says that the experiment “provides very interesting confirmation of standard quantum mechanics but “does not answer any question” concerning time-travelling quantum particles.

Also critical is Seth Lloyd of the Massachusetts Institute of Technology, who has developed a rival model to Deutsch’s. He points out that in the latest experiment there is no physical connection between what comes out of and goes into the wormhole, and that as a result the wormhole’s output has to be classically computed and then manufactured. “This defeats the purpose of quantum simulation,” he says, “which is to predict what one can’t simulate classically.”

The research was first described in Nature Communications and the paper is now available on the arXiv preprint server.

UK to open its first 'pub observatory'

By Michael Banks

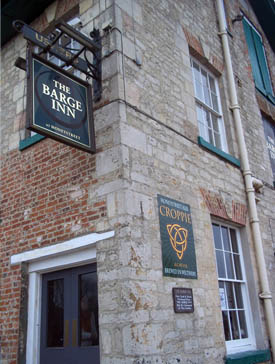
Fancy having a few pints while gazing at the stars? Well soon you will be able to, thanks to a new initiative at the Barge Inn at Honeystreet on the banks of the Kennet and Avon canal in Wiltshire, UK.

Known as “the most famous pub in the universe”, the boozer is already a favourite among UFO aficionados and crop-circle hunters.

But now the free house, which has its own brewery making beers such as Alien Abduction and Roswell, is turning to the stars by creating the UK’s first pub observatory.

The 205-year-old rural pub recently had planning permission accepted by Wiltshire county council for a 6 m-tall domed observatory to be constructed in the pub’s neighbouring campsite.

Dubbed the Honeystreet Observatory, it will be able to accommodate groups of about twenty people and will feature a Celestron 14″ 1400 Pro telescope. The images from the telescope will also be relayed onto screens in the pub.

It is hoped that the observatory will boost visitors, particularly in the winter months when there is less daylight and more time for observations – and drinking, of course.

“We had originally intended to build the observatory next year but due to the great
response since gaining planning consent, construction will commence next
month.” pub landlord Ian McIvor told physicsworld.com.

And will it be a good idea to mix alcohol with astronomy, particularly with the tricky ascent to the telescope? “You would be amazed at what some of the pub’s customers can accomplish after a few pints,” adds McIvor. “Gazing at the stars and falling down the stairs is a regular activity, so we think it will be business as usual!”

Copyright © 2026 by IOP Publishing Ltd and individual contributors