Yeah but no but yeah but no but…

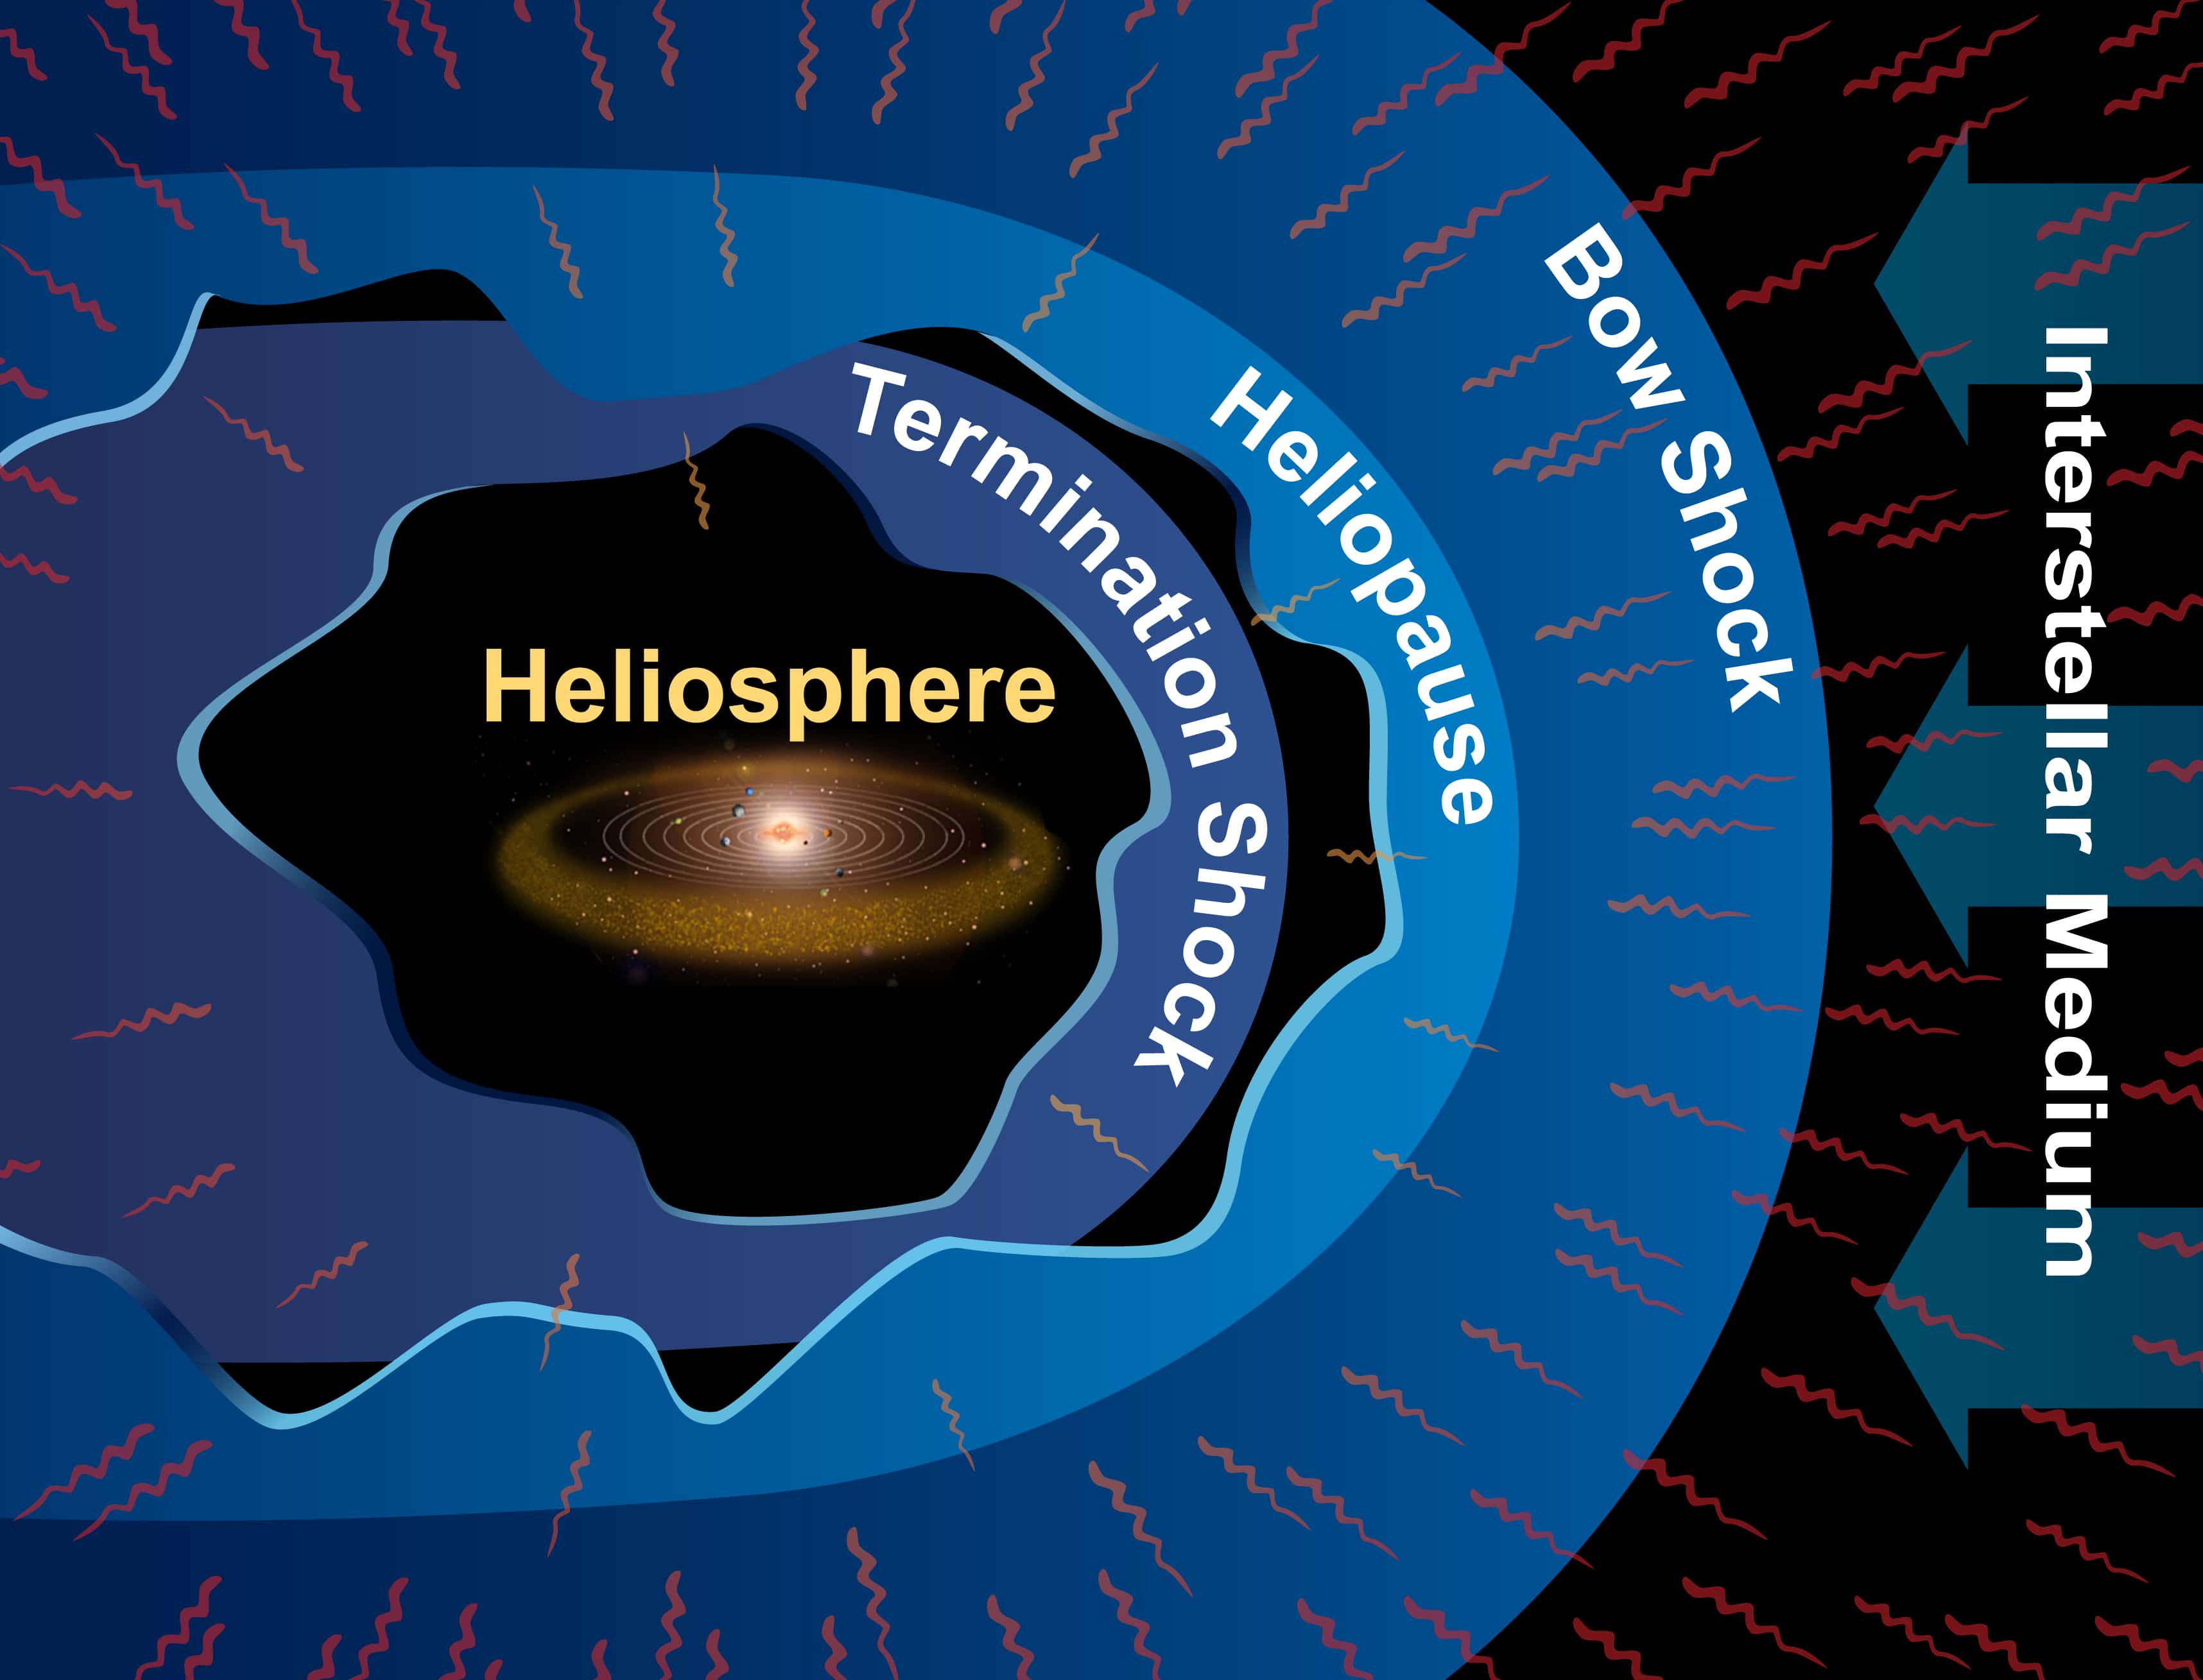
The various regions at the edge of the solar system

Has the Voyager spacecraft left the solar system and entered interstellar space? I don’t know about you, but I’m getting a teensy weensy bit bored by this question, which has been going on for years now.

Last September, we blogged about a paper in Science that, yep, it had definitely left the solar system a year before – on 25 August 2012 in fact.

Previous to that, though, there had been other reports that no it hadn’t (June 2013), it really, definitely is getting near the edge, but hang on actually not yet (March 2013), we’re not quite sure (June 2011), of course it’s definitely heading for interstellar space (November 2009), it’s already right near the edge (or possibly not) (November 2003).

(more…)

Electricity, eels and evolution

William Turkel’s Spark from the Deep is a fascinating book that explores a little-known aspect of how we came to understand and control electricity: the role played by electrogenic animals such as electric eels and rays. Such animals, he writes, “inspired [us] to colonize an electric world”, and in doing so, they profoundly transformed both our world and ourselves.

The book explores diverse areas of science and history, going well beyond mere descriptions of what happened to provide explanations of how and why biological and cultural evolutionary processes brought us there. A good example concerns Turkel’s discussion of vivisection, which makes useful reading for anyone with occasion to defend animal research today. To observers in the ancient and early modern world, strongly electric fish posed quite a mystery because of their ability to inflict pain at a distance. The mechanisms behind this ability could only be found by “opening the box”, but the act of doing so was (and still is) morally contentious.

Turkel argues that vivisection played an important role in the development of science because “treating humans and other animals as subjects for experiment or disassembly lowered the conceptual barriers between ourselves and our animal kin”. In addition, he writes, vivisection “lowered the barrier between animate and inanimate. If an electric fish could be used as an apparatus, it might also be possible to build an artificial device that could generate a shock like an electric fish”. This is exactly what Alessandro Volta did when he presented his first battery to the Royal Society in 1800, calling it his “organe électrique artificiel”. What better example of the value of pure versus applied research than the fact that our ubiquitous battery was invented to mimic a part of a fish?

Turkel also points out that many modern medical devices “would not exist if it had not been for the variety of grisly experiments” undertaken in the early days of electricity research. In 1774, for example, a child who arrived “dead” at a hospital was resuscitated by electric shock. But for Turkel, these episodes are more than just interesting anecdotes from the history of medicine and technology; they also contain information about what characterizes us as a species. “We humans,” he writes, “are unique in our willingness to treat just about anything as apparatus, including ourselves, one another, human body parts, other animals, animal body parts, inanimate objects, and hybrids of some or all of the above.”

The reductionist practices of disassembling animals into functional components naturally led to questions about how they had been initially assembled. For Charles Darwin, electric fish were a “special difficulty” that became chapter 6 of his book On the Origin of Species. In it, he wrote: “It is impossible to conceive by what steps these wondrous [electric] organs have been produced…I have to make, in my mind, the violent assumption that some ancient fish was slightly electrical.”

Darwin’s “violent assumption” was, in fact, a wonderful example of the dynamic evolution of scientific theories. Nearly 100 years later, scientists confirmed his prediction, eventually discovering hundreds of species of weakly electric fish and multiple indisputable evolutionary pathways by which such electricity developed. Darwin actually predicted this multiplicity in a general sense, writing that “I am inclined to believe that in nearly the same way as two men have sometimes independently hit on the very same invention, so natural selection…has sometimes modified in nearly the same manner two parts in two organic beings, which owe but little of their structure in common to inheritance from the same ancestor.” What a shame that so many adults today are ignorant of these incredibly powerful (and aesthetically and intellectually beautiful) theories that our ancestors worked so hard to discover and articulate.

Another gem in Turkel’s book is his explanation of Darwin’s reluctance to publish his On the Origin of Species until 1859 – 15 years after a previous work, Vestiges of the Natural History of Creation, “brought evolutionary debate to the mainstream”. In Vestiges, the anonymous author (later revealed to be Robert Chambers, a Scottish journalist and geologist) argued that everything in nature is governed by physical laws, and electricity played a key role in this grand unification scheme. The debate that followed its publication was acrimonious. Turkel argues that Vestiges can be interpreted as proposing “a vision of nature appropriate to the industrial age and the middle classes”. Consider how dramatically machines and pollution were changing people’s relationships with each other and the world. Were these changes an inexorable consequence of natural law? One might see parallels today regarding climate change.

While electromagnetic phenomena were radically transforming industrial society, physiologists began exploring how to measure feeble bioelectricity in more typical animals. In the 1820s, the most sensitive -current-measuring instrument available to scientists was a freshly pithed frog leg. Within a year of Alexander Graham Bell’s 1876 invention of the telephone, Emil du Bois-Reymond and his students were listening to bioelectric signals from muscles and nerves. Their instruments opened up completely new kinds of perception – a prerequisite to manipulating and controlling those newly discovered domains. In more recent times, electric organs have been the source for purified ion-channel proteins and DNA, and weakly electric fish remain some of the best model systems for a more holistic “neuroethological” approach to understanding brain function. Unfortunately, funding for such “exotic” research has virtually dried up, in spite of its history of important discoveries.

Turkel demonstrates throughout his book how evolution is an incredibly powerful key, one that can unlock and explain disparate questions about how and why we came to be who and where we are in this world. His concluding chapter contains a concise summary of chemical evolution that was a prerequisite to biological evolution, and also the pre-prerequisite of cosmological evolution. Evolution does for history what calculus does for mathematics. Our pursuits of pure science starting with electric fish led us on an unpredictable path to the most important and transformative discoveries in human history. But although the path was unpredictable, the fact that humanity would embark on such a journey is deeply encoded in our genes.

  • 2013 Johns Hopkins University Press $34.95hb 304pp

Web life: Lunar Reconnaissance Orbiter Camera

So what is the site about?

Launched in June 2009, NASA’s Lunar Reconnaissance Orbiter has spent the past five-and-a-bit years mapping the surface of our Moon, with the initial goal of identifying safe landing sites for future manned missions. Its camera, the LROC, is one of seven instruments on board the spacecraft; together, these instruments transmit about 155 GB of data back to their Earth-bound controllers every day. This steady stream of data has, naturally, created some challenges for the LROC’s science team. As they stated on the camera’s website, “When you have over a million individual images of the Moon, what do you do with them?” Part of the team’s response has been to develop this website, which contains several impressive visualizations and tools to help scientists (and curious onlookers) explore some of the fascinating and beautiful images in the LROC’s archive.

What can I do on the site?

Amateur lunar enthusiasts will have fun with the site’s Gigapan tool, which makes it possible for casual visitors to explore the LROC Northern Polar Mosaic. This composite image contains 680 gigapixels of valid image data and covers a patch of the Moon that, at 2.54 million km2, is slightly smaller than the combined areas of France, Spain, Germany and Scandinavia – all at a resolution of 2 m per pixel. The result is, according to the site, “likely one of the world’s largest image mosaics in existence, or at least publicly available on the Web”, and one can easily pass a pleasant half-hour simply marvelling at the profusion of craters and other features in it. But the LROC site isn’t just about pretty pictures. There are also links to a range of professional tools, such as the Lunaserv lunar-mapping service, that help both team members and external scientists extract data from the camera’s huge, information-rich archive.

Who is it aimed at?

In addition to the pages for armchair explorers and members of the professional lunar-science community, the site also features areas that cater to teachers and students. The “Learn” section, for example, contains short answers to a handful of commonly asked questions about lunar science, including “Does the Moon have volcanoes?” (Answer: yes, several, but they’re not active anymore) and “What is the largest impact feature on the Moon?” (Answer: the South Pole-Aitken Basin, which is 2500 km in diameter). The “Teach” section is more detailed, with a range of lesson plans, fact sheets and posters tailored towards students of all ages. One of the most complex projects, for example, asks older secondary-school students to design a chamber for growing terrestrial plants on the lunar surface, but there is also a junior version called “Moon Munchies” that should get the creative juices flowing for the youngest scientists.

Anything else?

If you only have a few minutes to spare, check out the “Images” tab, which showcases some of the LROC archive’s “most exciting” shots of the lunar surface. At the time of writing, the top image in the list showed the eroding walls of the Maskelyne B crater – a reminder that the Moon has not always been static in geologic (lunalogic?) terms. Another image shows a track made by the Russian rover Lunokhod 2 as it trundled along the lunar surface in early 1973. At around 42 km, Lunokhod’s journey is still the longest made by any rover on the surface of another celestial body. Thanks to the LROC, we can see where its travels ended: in another image, the 1.6 m-wide defunct rover shows up as an irregularly shaped black blob on the grey lunar surface.

Plasmonic chip diagnoses diabetes

A plasmonic chip that can diagnose type-1 diabetes (T1D) has been unveiled by researchers at Stanford University in the US. The chip is capable of detecting diabetes-related biomarkers such as insulin-specific autoantibodies and could be used in hospitals and doctors’ surgeries as a quick and simple way to detect early-stage T1D.

Diabetes could affect nearly 370 million people worldwide by 2030, according to the World Health Organization. More worrying still, diabetes is now the second most common chronic disease in children. For reasons that are still unclear, the rate of T1D (also known as autoimmune diabetes) in children is increasing by about 3% every year, with a projected increase of a staggering 70% between 2004 and 2020.

Although T1D was once thought of as being exclusively a childhood disease, around a quarter of individuals now contract it as adults. The rate of type-2 diabetes (T2D) (also called metabolic or diet-induced diabetes), normally seen in overweight adults, has also alarmingly escalated in children since the early 1990s, in part because of the global obesity epidemic. Until quite recently, it was fairly simple to distinguish between T1D and T2D because the diseases had occurred in different groups of people. However, this is becoming more and more difficult because the groups are beginning to overlap. The main problem is that existing diagnostic tests are slow and expensive, and it would be better to detect diabetes as early as possible to ensure the best possible treatment.

Higher concentration of autoantibodies

T1D is different from T2D in that patients with the disorder have a much higher concentration of autoantibodies. These are produced by the body and work against one or more pancreatic islet antigens such as insulin, glutamic acid decarboxylase and/or tyrosine phosphatase. Detecting these autoantibodies, and especially those against insulin (which are the first to appear), is therefore a good way to detect T1D. Again, standard tests are not very efficient and even the most widely used technique, radioimmunoassay (RIA) with targeted antigens, is far from ideal because it is slow and relies on toxic radioisotopes.

In an attempt to overcome these problems, the Stanford researchers have developed an autoantibody test that is more reliable, simple and faster than RIA and similar tests. It comprises a microarray of islet antigens arranged on a plasmonic gold (pGOLD) chip. It can be used to diagnose T1D by detecting the interaction of autoantibodies in a small blood sample with insulin, GAD65 and IA-2, and potentially new biomarkers of the disease. It works with just 2 µL of whole human blood (from a finger-prick sample, for example) and results can be obtained in the same day.

Enhancing the fluorescence emission

The team, led by Hongjie Dai, made its pGOLD chip by uniformly coating glass slides with gold nanoparticles that have a surface plasmon resonance in the near-infrared part of the electromagnetic spectrum. Plasmons are collective oscillations of the conduction electrons on the surfaces of the nanoparticles. They allow the nanoparticles to act like tiny antennas, absorbing light at certain resonant frequencies and transferring it efficiently to nearby molecules.

The result can be a large boost in the fluorescence of the molecule, and the researchers have shown that the pGOLD chip is capable of enhancing the fluorescence emission of near-infrared tags of biological molecules by around 100 times. Together with Brian Feldman‘s group, the researchers robotically printed the islet antigens in triplicate spots onto the plasmonic gold slide to create a chip containing a microarray of antigens.

“We tested our device by applying 2 µL of human serum or blood (diluted by 10 or 100 times) to it,” explains Dai. “If the sample contains autoantibodies that match one or more of the islet antigens on the chip, those antibodies bind to the specific antigens, which are then tagged by a secondary antibody with a near-infrared dye to make the islet spots brightly fluoresce.”

Antibody detected at much lower concentrations

The samples came from Feldman’s patients who had new-onset diabetes. They were tested against non-diabetic controls at Stanford University Medical Center.

The antigen spots fluoresce 100 times more brightly thanks to the plasmonic gold substrate, which allows the antibody to be detected at much lower concentrations (down to just 1 femtomolar) than if ordinary gold were to be employed in the microarray platform.

“We believe that our technology will be able to address the current clinical need for improved diabetes diagnostics,” Dai says. “The pGOLD platform is also being commercialized by a new start-up company, Nirmidas Biotech, based in San Francisco, aimed at better detecting proteins for a range of research and diagnostic applications. It might even be able to detect biomarkers for other diseases such as heart disease with ultrahigh sensitivity.”

The researchers describe their plasmonic chip in Nature Medicine.

New medical probe combines sound and electromagnetic induction

The Lorentz force combined with acoustic shear waves could help doctors detect dangerous diseases, say researchers in France. The team has shown that the electromagnetic force could create oscillations in living tissue, producing shear waves that can be detected to reveal the tissue’s elasticity. The technique has shown promise in the laboratory and could now be developed as a clinical technique.

An experienced doctor can determine a lot about the human body by simply pressing on it with their fingers, a process called palpation. Many serious medical conditions such as breast cancer can be diagnosed this way because they cause tissue to be firmer than normal. Some internal organ diseases such as liver fibrosis also cause the tissue to stiffen, but, in general, these organs are inaccessible to manual palpation. While the texture of internal tissue can be probed by medical imaging techniques such as ultrasound, these techniques measure a different quantity from palpation.

Shear propagation

When tissue oscillates, it supports both pressure waves (back-and-forth motion) and shear waves (side-to-side movement). Traditional ultrasound techniques operate in the megahertz range and at these frequencies shear waves propagate just a few microns in tissue. As a result, most ultrasound techniques rely on using pressure waves to determine the compression modulus of the tissue.

However, tissue is mainly water – an incompressible fluid – so its firmness to the touch depends on how easily it moves aside to allow a doctor’s fingers to sink in. This is defined by the shear modulus, which can be calculated from the speed of the shear waves in the tissue. Therefore, measuring the sheer modulus can give doctors a map of the inside of the human body as if they could “touch organs and evaluate their stiffness”, says team member Stephan Catheline of the University of Lyon.

Frequency drop

In the past few years, researchers have developed ways of measuring the shear modulus by using shear waves with a much lower frequency, which propagate further in soft tissue. These waves are created inside the body by firing focused ultrasound through the skin, but this has its drawbacks. The brain, for example, is protected against shock and vibration by both the skull and the thin layer of cerebrospinal fluid lining it, which makes inducing shear waves difficult.

Now Catheline and colleagues have adapted an idea called magneto-acoustical electrical tomography to create the shear waves. This involves passing an alternating electric current through tissue in an applied magnetic field. The resulting electromagnetic Lorentz force induces shear-wave oscillations in the tissue. While other researchers had used a high-frequency alternating current, the team used a frequency of only 10–1000 Hz. Using a synthetic tissue substitute called a phantom, and then a sample of pig liver, the researchers tested out their idea, showing that they could induce low-frequency waves with an electric current and detect them using ultrasound transducers. Their results for the pig liver agreed with accepted values for the shear elasticity of healthy liver tissue.

High electric fields

Before the research can be used in medicine, there are some difficulties to address. First, the researchers needed high electric fields to generate a large enough Lorentz force. They estimate that the electrical current passing through the tissue was 100 times higher than accepted safety limits, albeit only momentarily. However, modern magnetic resonance imaging (MRI) scanners can generate magnetic fields many times higher than the 100 mT available from the permanent magnets in the team’s laboratory: using these, one could generate the same Lorentz force with a lower electric field. Second, the cerebrospinal fluid that prevents ultrasound from getting into the brain would also stop it getting out, so one would need another way to detect cerebral shear waves. Here too, MRI might provide the answer, as it has been used in the clinic to detect tissue oscillations.

Kathy Nightingale, an elastography expert at Duke University in North Carolina, says that “so far, what’s exciting about this research is that it’s the first demonstration that I’m aware of of the generation of shear waves using this Lorentz force approach”. There are clear challenges in liver elastography, her own specialism, on patients with livers further below the skin, such as obese patients, she explains. “If this were to be successful in that population, that could be significant,” she says, but stresses that we will have to “wait and see”.

The research will be published in Physical Review Letters.

How to avoid earthquakes when storing carbon dioxide underground

Strategies for reducing the risks of storing carbon dioxide deep underground can be developed by studying the seismic activity associated with waste-water disposal in the oil and gas industry. That is the conclusion of geophysicist James Verdon, of the University of Bristol in the UK, who looked at case studies of 11 waste-water injection sites in the US. He found that the small earthquakes caused by water disposal occur mostly in rock below where the water is stored and not above it: something that is promising for those wanting to capture carbon dioxide and store it underground.

As society struggles to reduce global emissions of greenhouse gases, a number of scientists believe that carbon capture and storage (CCS) will be needed to halt climate change. CCS involves injecting carbon dioxide into rock formations deep underground. However, there are many concerns over the efficacy of CCS. One worry is that the process could trigger earthquakes that would cause cracks in the trapping rock that would allow the gas to leak out again.

Calculating risk

Because most CCS projects are experimental, there are few data available to calculate the risk of CCS-induced earthquakes. But there are similarities between CCS and waste-water injection, which is used to dispose of waste fluids from oil fields. This inspired Verdon to analyse the spatial distribution of the seismicity measured in the 11 waste-water case studies. He also considered the influence of the local geology and the way in which the fluid was being injected. Verdon found that 99% of seismic events occurred within 20 km of the injection well, and that the majority of events took place below the target reservoir.

“We’re still not completely clear as to why most events occur below the injection level,” says Verdon. “However, it is a good thing because events above the injection level would raise concerns that carbon dioxide was leaking out of the target formations and into overlying layers, or to the surface. Events occurring well below the reservoir pose no such concerns.”

So what makes some wells more prone to seismicity than others? Verdon showed that seismicity can only occur when there is a nearby fault, which is close to critical stress. “This [fluid injection] process is not creating earthquakes from scratch,” he says. “There has to be a fault that is fairly near to triggering, and the injection activity pushes it over the edge.”

Hard rocks prone to failure

Verdon also found that faster fluid injection is more likely to lead to higher pore pressures, which increase the risk of seismicity being triggered. Finally, he noted that injection into harder rocks runs the risk of triggering larger seismic events than injection into softer sediments. “Harder rocks can support higher stresses, which leads to larger events when they fail,” he says.

Verdon calculates that the worst-case scenario would be for CCS injection to trigger an earthquake of around magnitude five. “This is assuming that all the volume change put into the ground is released as a single large event,” he says. “In reality, most of the time, most injection into the ground produces little or no seismicity.”

Based on his findings, Verdon has two main recommendations for reducing the risk of induced seismicity at CCS sites. The first is to carry out thorough site characterization and geological appraisal prior to injection, to map any faults that might be re-activated and calculate the kind of stresses necessary to trigger these faults to move. And the second recommendation is to monitor the area during the injection process.

Mitigation strategy

“If injection begins to trigger a fault it might be manifest in smaller events that can be detected by sensitive monitoring apparatus,” he says. “This information could be used to change the injection programme, perhaps by reducing the injection rate or drilling a new well into a different part of the reservoir.”

Verdon thinks that it is important that the issue of induced seismicity is taken seriously and communicated honestly to the public, but he also thinks that this has to be balanced against the risks associated with climate change.

“There will always be a risk that CCS triggers seismicity and we should do the very best we can to appraise and monitor sites to prevent this happening,” he says. “But the risks of not pushing ahead with CCS far outweigh the risks of doing it.”

The research is described in Environmental Research Letters (ERL).

  • In this video James Verdon describes the process of “fracking”, which also involves injecting water deep underground:


A theremin fit for a gerbil, hairdos for physicists and the trouble with Richard Feynman

How we created spooky experimental music in a superconductor lab”: what physicist could resist clicking on this story, which appeared on the Guardian website earlier this week? Written by the physicist-turned-computational-biologist Andrew Steele, the article describes how Steele and a few pals converted a magnetic sensor into a musical instrument. Like the theremin, which is played by waving your hands around an antenna, this new instrument responds to the player’s motion. But because the sensor was optimized for studying superconductors rather than creating freaky mood music, Steele explains the “instrument covered three octaves in less than a centimetre of hand movement”. He suggests that playing the instrument should probably be left to a talented gerbil rather than talented superconductor researchers. You can listen to Steele’s attempt at making music on SoundCloud.

(more…)

The July 2014 issue of Physics World is out now


Unless you’re prepared to modify our understanding of gravity – and most physicists are not – the blunt fact is that we know almost nothing about 95% of the universe. According to our best estimates, ordinary, visible matter accounts for just 5% of everything, with 27% being dark matter and the rest dark energy.

The July issue of Physics World, which is out now in print and digital formats, examines some of the mysteries surrounding “the dark universe”. As I allude to in the video above, the difficulty with dark matter is that, if it’s not ordinary matter that’s too dim to see, how can we possibly find it? As for dark energy, we know even less about it other than it’s what is causing the expansion of the universe to accelerate and hence making certain supernovae dimmer (because they are further away) than we’d expect if the cosmos were growing uniformly in size.

(more…)

Charging up with jumping droplets

Superhydrophobic surfaces can be used to harvest small amounts of energy from the atmosphere, according to new research carried out by scientists at the Massachusetts Institute of Technology (MIT). The team has developed a device that uses jumping droplets of condensed water vapour to carry charges between two sets of metal plates. The device could be used as a handy tool in remote areas, to charge mobile phones or as an environmental sensor.

As the name suggests, superhydrophobic surfaces are highly effective at repelling water. This ability is down to their nano-scale topography, which limits contact – and therefore adhesive forces – between the surface and overlying liquids. Dominated by cohesive forces, droplets on these surfaces tend to ball up, forming beads that can easily roll away. Droplets of the right size – around 10–100 μm in diameter – can sometimes spontaneously jump, converting their excess surface energy into kinetic energy.

Jump start

These jumping droplets do not travel alone, however – they take a tiny electric charge with them. This effect – first noted by Nenad Miljkovic and colleagues in a paper last year – occurs through the interaction of free charges in the water with the superhydrophobic surface. “An electric double layer forms at the water/coating interfaces, and because of the fast jumping dynamics, charge separation can occur,” says Miljkovic. This, he explains, leaves a small positive charge on the droplets and a small negative charge on the surface.

In their new study, Miljkovic and colleagues have put their earlier discovery to practical use – harvesting atmospheric energy. To do this, they created two sets of interleaved copper plates: one patterned to be superhydrophobic, the other hydrophilic. As water droplets condense on the first set of plates, they merge and leap across to the adjacent hydrophilic plates. With each drop, a small charge is transferred – building up a difference between the two sets of plates that can be used to power a circuit. The design is scalable: the larger the plates, the greater the overall charge transferred.

Remote tool

The concept does have its limitations though: it requires a humid environment, and the researchers’ prototype only provides 15 picowatts of power per square centimetre of plate. Despite this, Miljkovic is confident that the concept can be fine-tuned to harvest at least one microwatt per square centimetre. If achieved, the harvester might become a useful tool in remote regions. Such a device, 50 cubic cm in size, could charge a mobile phone in about 12 hours – an output comparable with other waste-energy harvesting solutions – and would also collect clean water. One specific application for this technology could be in automated environmental sensors, whose low power requirements might be covered by the morning dew alone. For more extensive uses, however, a cold sink – such as a flowing river – would be required to keep up the condensation.

Julie Crockett – a mechanical engineer from Brigham Young University who was not involved in the study – calls the work a “significant contribution to [the] field”, highlighting the potential for optimization of the superhydrophobic structuring. She adds, however, that “questions still remain about the longevity of the process, because of the jumping droplets coating the opposing hydrophilic wall, and the heat flux available for direct condensation of atmospheric moisture”.

“This finding is very exciting because it suggests that electricity could be passively harvested from the condensers found in many engineering systems,” comments Jonathan Boreyko – a mechanical engineer, formerly of the University of Tennessee, who will be joining Virginia Tech in the autumn – who was also not involved in this study. “It would be interesting to see how the performance is altered when using smooth parallel surfaces, which would remove the temperature gradient in the chilled superhydrophobic surface to enable more uniform jumping-drop condensation across the gap to the opposing electrode,” he adds.

Having demonstrated their prototype’s viability, the researchers are now refining their design, aiming for increased power output. They are also working on an aluminium version, which should be cheaper to make than their copper prototype.

The research is described in Applied Physics Letters.

Seismic study digs into volcanic plumbing

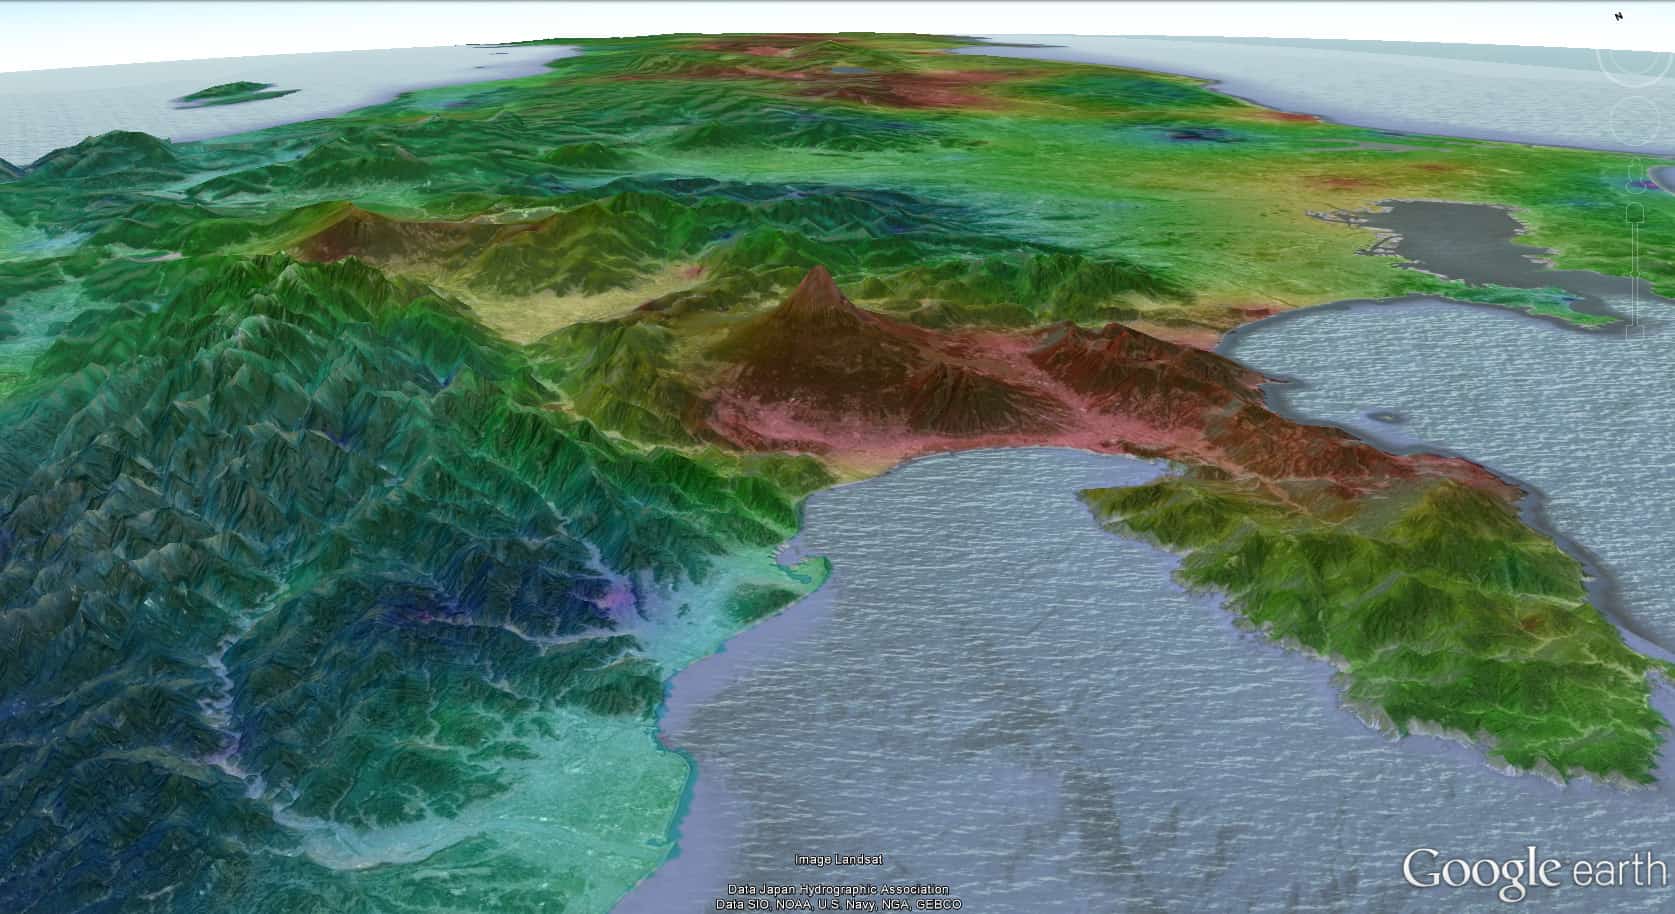
Map of the seisemic velocity of Mount Fuji

Plumbing problems do not get any bigger and more complicated than a backed-up volcano. But geophysicists looking at the responses of ground waves below Japanese volcanoes have now come up with a technique for identifying where pressurized volcanic fluids build up, allowing them to better anticipate when a volcano may erupt. Scientists already knew that seismic waves from large earthquakes agitate volcanic systems and that large eruptions generally follow a build-up of pressurized fluids at some depth. But they had been unable to pin down the specific physical changes that seismic waves cause.

Now though, Florent Brenguier of the Institut des Sciences de la Terre in Grenoble, France, and colleagues at the University of Tokyo have used recordings of seismic-wave velocity from the devastating 2011 Tōhoku earthquake to create a map of seismic-velocity changes in its aftermath. Surprisingly, the largest changes were not observed in the area closest to the earthquake epicentre near the Pacific coast but farther inland, immediately below volcanic regions. The image above highlights an anomalously low seismic velocity below the Mount Fuji volcano after the earthquake, despite it being some 500 km from the epicentre. The drop in velocity is because the regions are susceptible to earthquake shaking – cracks in the crust open so that fluids at high pressures can escape, and could be seen as proxies for the high-pressure fluid build-up (Science 345 80).

Copyright © 2026 by IOP Publishing Ltd and individual contributors