Exoplanet burning bright…

55 Cancri e


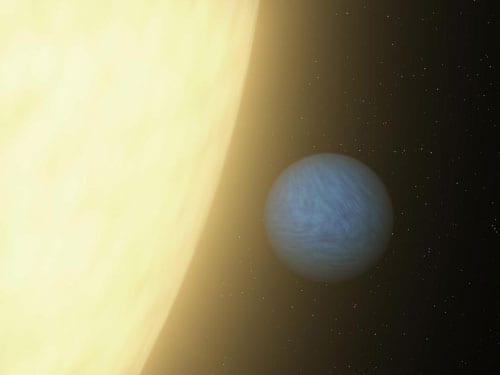
An artist’s impression of the 55 Cancri system, with 55 Cancri e nearly lost
in the glare of its star. (Courtesy: NASA/JPL-Caltech)

By Tushna Commissariat

Exoplanetary scientists will rejoice to hear that NASA’s Spitzer Space Telescope has managed to detect and analyse the tiny amount of infrared light that comes directly from a super-Earth exoplanet for the first time. About a few dozen super-Earths – planets that are 2–10 times more massive than the Earth – have been officially detected and countless other possible candidates have been found.

The exoplanet in question – known as 55 Cancri e – belongs to the 55 Cancri star-system, which is a measly 41 light-years away from the Earth – a small distance by astronomical scales. Indeed, 55 Cancri is so bright and close that it can be seen with the naked eye on a clear, dark night. The system is known to have five planets, with 55 Cancri e being the closest to its parent star. The planet is about eight times more massive than the Earth, completes its orbit in a dizzying 18 h – the shortest orbit known for an exoplanet – and is tidally locked, so one side always faces the star.

Previous studies of the planet revealed that 55 Cancri e is an extreme exoplanet with a rocky core surrounded by a layer of water in a “supercritical” state – the water is heated to such a degree that it is somewhere in-between a liquid and a gas – and topped off by a blanket of steam. In the new study, Spitzer measured the amount of infrared light that comes from the planet itself by looking at the slight dip in total light intensity when the planet undergoes an occultation – that is, when it circles behind the face of its parent star. When viewed in infrared, the planet is brighter relative to its star as its scorching surface heat blazes in the infrared end of the spectrum. This information reveals the temperature of a planet and, in some cases, its atmospheric components. Most other current planet-hunting methods obtain indirect measurements of a planet by observing its effects on the star’s light. In this case, the data revealed that the star-facing side of the exoplanet is more than 2000 K – hot enough to melt metal.

“Spitzer has amazed us yet again,” says Bill Danchi, who works on the Spitzer programme in Washington, DC. “The spacecraft is pioneering the study of atmospheres of distant planets and paving the way for NASA’s upcoming James Webb Space Telescope to apply a similar technique to potentially habitable planets.”

Silicon ‘prism’ bends gamma rays

For as long as physicists have known about gamma rays, they have believed that it would be impossible to create a practical lens that could focus them like light. Now, however, a team of physicists in France and Germany has made an unexpected discovery that suggests gamma-ray focusing is indeed possible. As well as leading to a range of new applications in medical imaging and security screening, the discovery could result in a better fundamental understanding of how light interacts with matter.

When electromagnetic radiation travels through a medium, its speed is given by the index of refraction of the material. When radiation goes from one medium to another, the change in the index of refraction causes its path to bend – and this forms the basis of classical optics. For X-rays, the index of refraction is defined by Rayleigh scattering, which is essentially a classical phenomenon that can be explained without reference to the detailed interactions between individual photons and atomic nuclei.

While physicists have used Rayleigh scattering to focus X-rays, the strength of the effect drops off as the inverse square of the X-ray energy. This means that at high X-ray energies – and on into low gamma-ray energies – the radiation is not bent enough for a lens to work effectively. One way round this is to put the radiation through a large number of successive lenses. However, no lens is perfectly transparent and at higher energies the large number of lenses needed would result in practically all of the radiation being absorbed.

Making a comeback

According to classical physics and conventional quantum physics, this trend should continue at higher energies. This is what Dietrich Habs and colleagues at Ludwig Maximilians University in Munich, Germany, together with collaborators at the Institut Laue-Langevin in Grenoble, France, set out to measure in silicon. But instead they discovered that the exact opposite occurs – the index of refraction starts to make a comeback at energies greater than about 700 keV. What is more, while the index of refraction is negative for X-rays, it becomes positive for gamma rays.

Habs is an experimental physicist and does not claim to have a detailed theoretical explanation for the phenomenon, but he believes the results provide tantalizing hints of quantum electrodynamics beyond the Schwinger limit – the point at which traditional perturbative treatments of quantum electrodynamics break down and the mathematics becomes incalculable with current techniques. The researchers attribute the results to another process called Delbrück scattering, which occurs when an incident photon has enough energy to penetrate close enough to the nucleus to produce an electron–positron pair from the quantum vacuum.

Rewriting textbooks?

In the past, Habs explains, it was not possible to produce a sufficiently mono-energetic source of gamma rays to actually measure the refractive indices of materials at such extreme energies, so the data tables in nuclear-physics textbooks have been taken from theory, which assumed that Delbrück scattering is a weak effect. Now those textbooks may have to be rewritten. “What is new now is that with gamma rays we can really address the extremely high electric field of the nucleus,” explains Habs.

Nuclear physicist Norbert Pietralla of the University of Darmstadt in Germany is impressed by the results. “The measurements indicate that there exists an index of refraction for gamma-ray energies that is substantially larger than people believed before,” he says. He explains that this could lead to lenses for gamma rays.

Habs is also excited about the breadth of the possible applications the technology might offer. He suggests medical imaging as just one possibility, saying that gamma rays could be used to track lithium in the brains of patients being treated for bipolar disorders. On a broader note, he believes that the discovery could lead to a revolution in gamma-ray optics much like that initiated by the invention of the telescope and the microscope in the 17th century. Materials with nuclei that have a large positive charge – such as gold – should be ideal for making gamma-ray lenses, and the team are currently studying gold lenses.

The research is published in Physical Review Letters.

Solar-cell efficiency boosted by folds and wrinkles

Solar cells constructed with microscopic leaf-like folds and wrinkles can produce 47% more electricity than similar flat cells – according to the researchers in the US who made the wrinkled cells. The team has also shown that the devices can exploit a wider range of the solar spectrum and are considerably more robust than their flat counterparts.

Crystalline silicon photovoltaic cells have been around for more than 50 years, but they are fragile, expensive and labour intensive to produce. Devices made from organic plastic semiconductors are flexible, lightweight and cheap, but they are less efficient. In order to make them commercially viable, scientists have been trying to boost the efficiency of plastic solar cells from just a few per cent towards 10–15% – compared with crystalline silicon devices, which have an efficiency of about 20%. Recently, a team at UCLA created organic cells with an efficiency of 10.6%, and the new leaf-mimicking technique could offer a way to increase that value still further.

Architectural inspiration

The traditional strategy for enhancing solar cells has focused on improving the performance of photovoltaic materials and reducing manufacturing costs. Looking at the geometric structure of cells is a relatively new and potentially fruitful avenue of research. That is because nature’s solar powerhouses – leaves – contain structures that trap and guide sunlight to maximize the amount of light that is harvested. Using the complex network of creases and undulations on the surfaces of leaves as inspiration, the researchers constructed photovoltaic cells with similarly uneven surfaces and found that electricity production shot up in comparison with flat cells.

Jongbok Kim and colleagues at Princeton University and the University of Pennsylvania were surprised at the impact of the geometric structures. “I expected that it would increase the photocurrent because the folded surface is quite similar to the morphology of leaves, a natural system with high light-harvesting efficiency,” says Kim. “But when I actually made organic solar cells with this concept, its effect exceeded my expectations.”

Curve control

The technique for making the wrinkles is nothing new. A rigid layer of crust atop a more flexible substrate creates instabilities that cause folds to form – a process that can be controlled with great precision. The team used ultraviolet light to selectively cure layers of optical adhesive, altering their elasticity to varying extents to induce stresses in the material. The result is ripples that repeat with periods of 1–5 µm. The team has classified the shallower ripples as wrinkles and the deeper ones as folds. The entire folded layer was then coated with the active photovoltaic polymer P3HT:PCBM.

For leaves and solar cells alike, the longer light remains in the photoactive regions, the better its chance of being absorbed. The shallow solar-cell wrinkles alter a photon’s angle of incidence slightly, curving and thereby lengthening its trajectory through the active material. The deeper folds offer an even more pronounced effect but the researchers found that a balance of the two works best.

Team leader Lynn Loo of Princeton University explains that once the light is in the active layer of the device, an encounter with a deep fold will guide it out of the active layer. “So you have a sweet spot,” says Loo. Indeed Loo and colleagues found that when more than 11% of the surface is wrinkled, “you’re guiding light in but you’re also guiding light out and shortening how much time it can spend in the active layer”.

Surprise benefits

What is remarkable about the wrinkled P3HT:PCBM cells is that their enhanced wave-guiding effect actually extends the range of wavelengths that the material can absorb. In particular, the device performs well with light in the near infrared, where the efficiency of most solar cells tails off. Indeed, the design achieves about 600% greater absorption at these wavelengths than compared with flat P3HT:PCBM cells. In addition, the wrinkled cells retain their effectiveness completely when bent, where conventional flexible cells experience a 70% drop in output. This marks them out for use in fabrics, portable devices and on curved and uneven structures.

The work is described in Nature Photonics.

How to transform your research institution

Imagine if you were presented with the opportunity to bring about major practical and political changes at your research institution. What would you do? Where would you start? Could you cope with the inevitable conflicting opinions? This was the task facing Giorgio Margaritondo, a physicist who was part of the team that restructured one of Switzerland’s leading institutions, the Ecole Polytechnique Fédérale de Lausanne (EPFL).

In recent years, Margaritondo has helped to bring about several substantial changes at the EPFL, including the scrapping of traditional university departments in favour of a more interdisciplinary approach. Margaritondo is also a strong advocate of the need to create more opportunities for women and for young people to progress early in their careers.

In this video interview, Margaritondo talks to Matin Durrani, the editor of Physics World, about his experiences at the EPFL.

Building nanomagnets atom by atom

Physicists in Germany have developed a new technique for making tiny magnets that involves picking up and placing individual iron atoms using a microscope tip. The nanometre-sized magnets can be made in a range of different shapes, while the same microscope tip can also be used to measure their magnetic properties. After comparing their results with elaborate computer simulations of the nanomagnets, the researchers found deviations that could point to hitherto unknown atomic-scale magnetism effects.

“The assembly technique we used is very similar to the children’s game LEGO,” explains team member Jens Wiebe of Hamburg University. “Our building blocks are iron atoms that are laid on a very clean copper surface, and each block behaves like a small compass needle that can point in one of two directions – up or down. This allows us to assemble magnets the constituent atoms of which can be arranged in a variety of different configurations.”

The researchers were led by Roland Wiesendanger at Hamburg University and included scientists from the Institute for Advanced Simulation in Jülich. They used the sharp tip of a spin-polarized scanning tunnelling microscope to build their nanomagnets. The tip can be positioned with high precision above the iron atoms and is able determine the locations of individual atoms on the copper surface. If the tip is brought close enough to an individual atom, it can be used to “pick” the atom up and move it to another position.

Chains, triplets and flowers

“We can build artificial magnets atom by atom that have a variety of different shapes – such as chains, triplets and ‘flowers’,” says Wiebe. “What is more, the tip of the microscope is coated with a magnetic material, which allows us to measure the magnetization curve of each of the constituent iron atoms within the magnet.”

The team compared its experimental results with theoretical calculations based on the Ising model of magnetism. The researchers found that at low applied magnetic fields, the magnetization curves of chains of assembled iron atoms differs from those predicted by theory. However, at higher fields, the theoretical and experimental magnetic curves agree remarkably well.

“Empirically speaking, the opposite sloping curves we saw for the low-field cases hint at an additional magnetic field acting opposite to the applied magnetic field (B), or the presence of an additional magnetic moment that is coupled antiferromagnetically to the end atoms of the chains,” says Wiebe. “Indeed, we are able to reproduce the low-field anomalies of some chains by considering an additional magnetic field in the Ising model that scales with –B (pointing opposite to B) or by including an additional magnetic moment of around 5 Bohr magnetons antiferromagnetically coupled to the chain ends with an ‘exchange constant’ of about –50 µeV.”

The origin of such an additional magnetic field or moment is currently unknown though, he adds, and only seems to affect linear chains and not more compact nanostructures such as the triplets or the flower shapes.

Fundamental questions

According to the team, the same technique, if applied to magnets consisting of a larger number of atoms, could help scientists tackle important fundamental questions in magnetism concerning “spin glasses” or “spin liquids”, which are the magnetic states of particular solid-state materials.

The researchers now hope to build novel hard nanomagnets using an appropriate combination of elements from the periodic table.

The research is described in Nature Physics.

Geophysicists fingerprint sea-level rise

By considering the unique sea-level “fingerprint” created by a melting ice sheet, a team of geophysicists in North America has developed a new method for pinpointing the sources of global sea-level rise. Their approach could provide a way to measure the impact of the Greenland and West Antarctic ice sheets – the greatest sources of uncertainty in projections of future sea-level changes.

Long-term variations in sea level are caused by processes including thermal expansion of the water, changes in ocean circulation, and changes in the size of glaciers and ice sheets. Measurements from tide gauges indicate a global average sea-level rise of 1–2 mm/yr during the 20th century. However, this estimate ignores geographical variations in sea level, and provides no information about the contribution of different processes.

One possible way to pick apart the total sea-level change is to look for the distinct pattern, or fingerprint, of a melting ice sheet. Close to the ice sheet, for example, the sea level tends to fall. This is a result of both the local uplift of the Earth’s crust after being relieved of the great weight of the ice and a reduction in the ice sheet’s gravitational pull on the ocean. Moving further away from the ice sheet, however, the sea level rises progressively.

Looking for fingerprints

Carling Hay at the University of Toronto and colleagues at Harvard University, along with Rutgers University geophysicists in Canada and the US, have developed a new statistical method for identifying these ice-sheet fingerprints. Their approach uses an algorithm known as the Kalman filter, which processes noisy measurements and provides an optimal estimate of a system’s state. The Kalman filter is well suited for analysing sea-level change because it can use known information about the system to fill data gaps – a common occurrence with tide-gauge records.

In order to test this framework, the team created a sea-level record from scratch, containing known contributions from different processes. The researchers first removed the long-term trends from almost 600 tide-gauge records going as far back as 1807, isolating the short-term sea-level variability – the observational “noise”. Then, at each tide-gauge site, a long-term, warming-forced sea-level trend was added, obtained from a climate-model simulation. Changes in land height caused by changes in glacial mass were supplied by an Earth model, and a globally uniform trend of 0.8 mm/yr was added to account for any unmodelled sources of sea-level rise, such as the melting of mountain glaciers.

Melt rates of 0.3 and 0.5 mm/yr were assumed for the Greenland (GIS) and West Antarctic (WAIS) ice sheets, respectively, along with their predicted fingerprints. The researchers then applied the Kalman filter to this synthetic dataset, initializing the algorithm with melt rates of zero.

Matching melt rates

The algorithm was found to estimate the melt rates most accurately when applied to the maximum number of tide gauges, providing enough information for the ice-sheet fingerprints to be separated from the globally uniform trend. The final estimated melt rates for the GIS and WAIS were 0.21 and 0.38 mm/yr, respectively, close to the values used in the synthetic dataset. The 1σ uncertainties associated with these values indicate the magnitude of ice-sheet melting that could potentially be detected in real sea-level records.

“It should be possible to use historical tide-gauge records to robustly infer positive Greenland and West Antarctic ice-sheet melt rates above 0.3 and 0.4 mm/yr, respectively,” explains Hay. “We are now in the process of applying our methodology to historical sea-level records to provide a new estimate of total sea-level rise and ice-sheet melt rates over the 20th century,” she adds.

Eric Leuliette, an oceanographer at NOAA’s Satellite Oceanography and Climatology Division, comments that this approach is, however, unlikely to provide a complete picture of past sea-level changes. “Because of the lack of long tide-gauge records near some regions with glaciers, it may be impossible to use fingerprints to reconstruct all of the individual sources of 20th century sea-level rise,” says Leuliette, who was not involved in this latest research. “But this study demonstrates that it may be possible to use tide gauges to at least constrain the contributions from Antarctica and Greenland.”

Hay and colleagues eventually hope to apply their algorithm to satellite measurements of sea-surface height. Although these data are only available for the past 20 years, they offer near-global coverage.

The research is described in Proceedings of the National Academy of Sciences.

Quasars shine a new light on cosmic distances

An international team of scientists has developed a method to determine the distances to quasars throughout the universe. This could allow quasars to be used as standard candles. The researchers found characteristic patterns in the light given off by a group of quasars and say that these regularities are directly related to the redshift of the quasar. This allows them to reliably derive the unknown redshift – how fast objects are moving away from one another in the expanding universe – of one quasar from the known redshift of another.

Astronomers are always keen to find new and accurate methods to measure cosmic distances and the expansion of the universe. “Standard candles” such as Cephids and supernovae have played important roles in astronomy. Indeed, the discovery of the accelerating expansion of the universe through observations of distant supernovae won Saul Perlmutter, Adam Riess and Brian Schmidt the 2011 Nobel Prize for Physics. But using supernovae to gauge the extreme distances of the universe has its problems – the furthest known supernova is at a redshift of about 1.7 and so reliable measurements of distances greater than that are not possible using supernovae. Also, astronomers have to wait for stars to “go supernova” and then have a short window of time to make their observations.

Contrary to that, the furthest quasar has been found at a redshift of about 7.1, and so looks much further back to the beginnings of the universe. Also, quasars are some of the brightest objects in the universe, and unlike supernovae can be studied for much longer time scales. Unfortunately, quasars emit different amounts of light in all wavelengths, and this makes it very difficult to use them to measure cosmological distances using their luminosity–distance relation. It was only last year that another team of researchers showed that it was possible to use the luminosity–radius relation of active galactic nuclei – a type of quasar – to determine their distance; using them as standard candles.

Quasar light patterns

But as it happens, quasars also have regularities in their light curves – how they brighten and dim over time – that could easily be used to determine their redshifts. Dejan Stojkovic from the State University of New York (SUNY) at Buffalo, US, and colleagues found that using the light curves to calculate the redshift of a quasar, independent from its luminosity–distance relation, would then allow quasars to be used as standard candles. They studied the publicly available light curve data from the Massive Compact Halo Objects (MACHO) project, which looked at quasars behind Magellanic Clouds.

“Potentially, quasars are much better [standard candles], but we still do not know them well enough,” says Stojkovic. “Until we noticed that the light curves of quasars follow certain patterns, no known regularities had been studied. And that was because they do look completely different at first glance,” he explains.

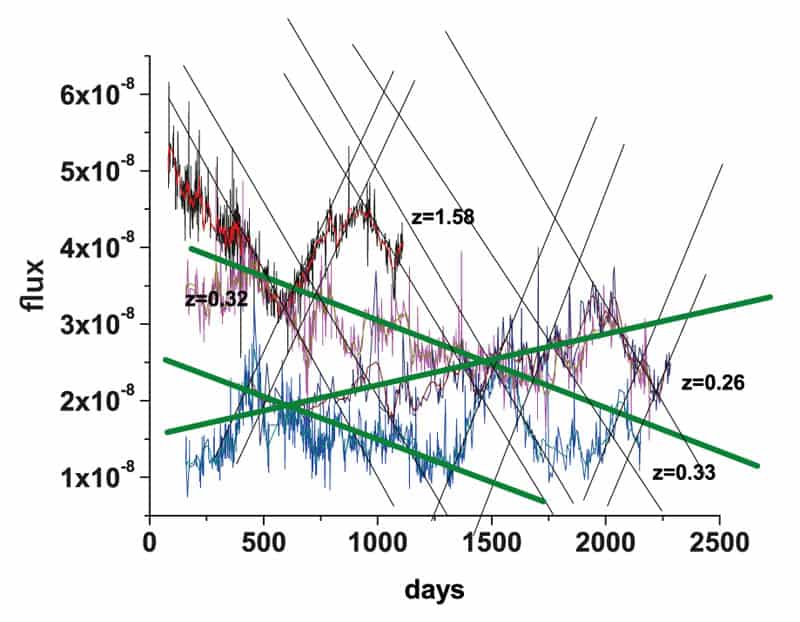
The team plotted a graph of the flux of a quasar versus “real time”, and this, according to Stojkovic, was crucial. “Mostly, for quasar variations, people plot their absolute magnitude which is a log of the flux; whereas flux is the actual energy emitted over unit time. So all our values are ‘real’ values,” he says. The team also transformed all the values for the quasar’s rest frame, so that the calculated values were for quantities exactly as “they were emitted right there”. The researchers then only carried out “global transformations” so that they were “not changing the physics of any of the observed values”.

Curve fixing

The team found that the light curve data for different quasars matched when the graphs were laid one on top of the other. This led it to conclude that if the light curves were similar, then the redshift of one quasar could be used to calculate the unknown redshift of another quasar using only the unknown quasar’s light curve. To be able to do this, the researchers developed and tested two independent methods.

In the first method, the researchers identify the straight-line segments of the slopes in their graphs and it is these slopes that appear to be directly related to the redshift of the quasars. So then, matching the slope of a quasar with a known redshift determines the redshift of the unknown quasar. Testing this by using quasars with known redshifts and labelling one as the “unknown” gave the researchers extremely accurate values.

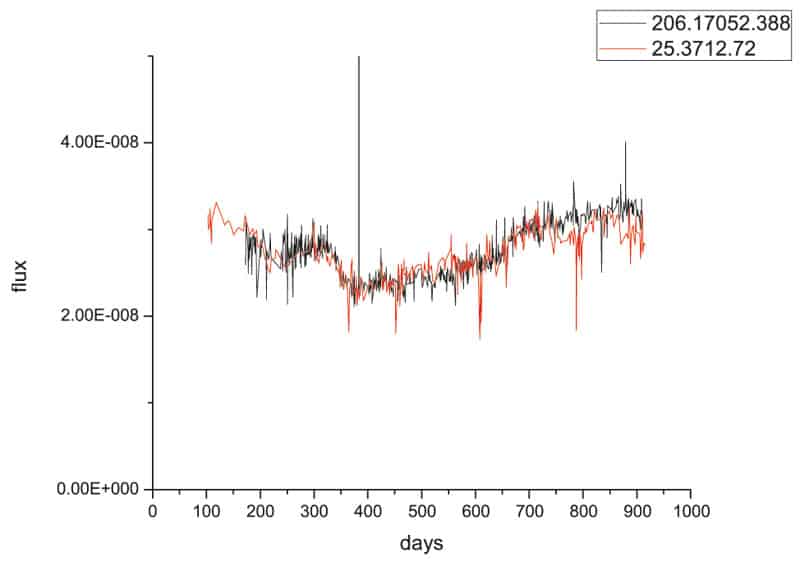
The second method is more of a statistical take on the light-curve readings, according to Stojkovic. Again, they used two quasars, both with known redshifts, but deemed one “test quasar” as the “unknown”. Then, instead of plotting only the straight-line segments of the curves, they matched a considerable portion of the light curves – several segments instead of just one – and they were able to “fit” the redshift ratios of the quasars closely. “This means that when we had the best fit for the light curves, we had the redshift, and this was the really exciting part,” explains Stojkovic.

‘Proof of concept’

Both the above techniques suggest that the similar light-curve patterns shared by different quasars could allow them to be used as standard clocks, or candles, combined with separate luminosity–distance calculations. But Stojkovic is quick to point out that it is early days yet for their method, as it is more a “proof of concept” at the present time.

This is because the technique requires high-quality observational data for quasars, where each individual quasar is observed for a minimum of 90 days or more to see the regularities. As people were unaware of these regularities, such data are scarce. Of the 56 quasars observed in the MACHO data, only 14 had enough data for the team to use. “It was very encouraging that our methods worked perfectly for all 14 quasars with sufficient information, but much more data is necessary,” says Stojkovic. He also points out that it might be possible that the method may work only for one type of quasar, and that they may not be able to match light curves of all quasars, but this must once again be tested.

“While our method might not be instantly useful, it might become standard in the future. The method we currently use to detect extrasolar planets – where you look at them transiting across a star – was developed in the 1980s, but they did not have the technology that we do today to pick up a strong enough signal. But now, we routinely use it,” says Stojkovic.

In the months to come Stojkovic is keen to automate the entire process of fitting their various graphs. Currently, this is done “visually” and eliminating human involvement entirely would speed up the process, allowing much more data to be processed and more accurately. Stojkovic’s brother and team member, Branislav Stojkovic, from the computer sciences department at SUNY, is helping to develop algorithms that could easily match the 1D curves from the quasars. More data and faster processing methods over time will tell if quasars will replace supernovae as distance and time markers of our universe.

The research is to be published in Physical Review Letters. A pre-print is available on the arXiv pre-print server.


Particle physicist sentenced for terror plot

By James Dacey

The BBC is reporting that the physicist Adlène Hicheur has been sentenced by a French court to five years in prison.

Hicheur, a 35-year-old French-Algerian, was arrested by French police on 8 October 2009 on suspicion of having links with the organization al-Qaeda in the Islamic Maghreb. Until his arrest, Hicheur was a postdoc at the Swiss Federal Institute of Technology in Lausanne and worked on the Large Hadron Collider at CERN.

During his time in custody, Hicheur had received support from some members of the physics community. In November 2010 the Nobel laureate Jack Steinberger and 18 other physicists wrote to the French Physical Society about their concerns over the continued imprisonment of Hicheur without charge. Hicheur also received support from an “international defence committee”, consisting of about 100 scientists, which wrote to French authorities including the French president Nicolas Sarkozy.

In January 2011 the Swiss authorities announced they would be closing the case into the actions of Hicheur. But the French authorities did not follow suit, and French pre-emptive anti-terrorism laws dictate that any person can be held in prison for up to two and a half years without charge.

According to the BBC article, today’s guilty verdict is based on police-intercepted e-mails from Hicheur to an alleged contact in al-Qaeda. The e-mails apparently suggest that Hicheur was willing to be part of an “active terrorist unit”, attacking targets in France.

Michael Dittmar, a researcher based at ETH Zurich and CERN who had written an article in support of Hicheur in the May 2011 issue of Physics World, expressed his surprise at the verdict. “I just heard it in shock,” he told physicsworld.com.

Dittmar said that he did not want to comment directly on the verdict, having not seen the e-mail exchanges. He did, however, restate his criticism of the French legal system. “It is totally unacceptable to put someone in prison for 2.5 years without charge, to allow the leak of some info to the media about the reasons, resulting in increased fears within society, and all this most likely for some political interests.”

The great graphene name game

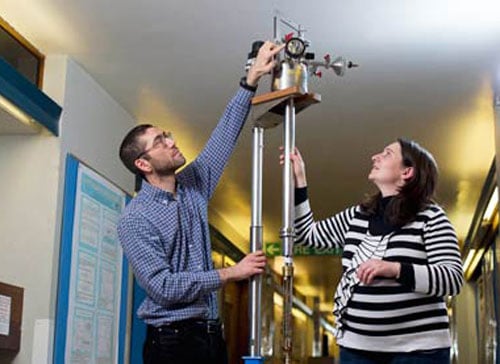
University of Exeter researchers


University of Exeter researchers Saverio Russo and Monica Craciun.
(Courtesy: University of Exeter)


By Tushna Commissariat

Here at Physics World, the word graphene gets used a lot. You might find that simply saying the word “graphene” elicits a groan from most of the editorial team. But this is usually followed quite swiftly by a fair amount of interest, because it’s undeniable that graphene is some kind of “wonder material” with a seemingly endless list of bizarre properties and applications. Along with the plethora of potential applications for graphene comes an interesting array of names for graphene-based materials. When our news editor Michael Banks heard that scientists in Spain had created an acoustic analogue for graphene, he dubbed it “graphone” – a name that has a certain resonance to it!

But it seems that researchers at the UK’s University of Exeter really ran out of suitable graphene-related names recently as they have decided to call their new graphene-based material “GraphExeter”. According to the researchers, GraphExeter is the most transparent, lightweight and flexible version of graphene that is also an excellent at conducting electricity, and so “could revolutionize the creation of wearable electronic devices, such as clothing containing computers, phones and MP3 players”.

The researchers created GraphExeter by sandwiching molecules of ferric chloride between two layers of graphene. Ferric chloride enhances the electrical conductivity of graphene without affecting the material’s transparency. The researchers say it is also much more flexible than indium tin oxide (ITO), the main conductive material currently used in electronics. As ITO is used so extensively, it is expensive and resources are expected to run out by 2017. The research is published in the journal Advanced Materials here.

Lead researcher Monica Craciun says “GraphExeter could revolutionize the electronics industry. It outperforms any other carbon-based transparent conductor used in electronics and could be used for a range of applications, from solar panels to ‘smart’ T-shirts. We are very excited about the potential of this material and look forward to seeing where it can take the electronics industry in the future.”

According to a University of Exeter press release, the researchers are “now developing a spray-on version of GraphExeter, which could be applied straight onto fabrics, mirrors and windows”. While the applications of GraphExeter may be varied and interesting, the researchers might have to come up with a slightly more user-friendly name for their new material if they intend to use it in a T-shirt venture!

Do you consider astronomy to be a distinct academic discipline from physics?

By James Dacey

In his editorial article in the May edition of Physics World, Matin Durrani writes about the various “trump cards” that astronomy has over some of the more esoteric areas of physics. He refers to the stunning pictures, the strong amateur involvement via citizen-science projects and the fact that getting your head around the basics of the subject is usually fairly painless.

hands smll.jpg
The theme was inspired by the upcoming transit of Venus, a spectacular astronomical event on 5–6 June that will see our sister planet cross the face of the Sun as viewed from the Earth. Given that this transit will not occur again until 2117, excitement ahead of the event is building among scientists and the media alike. And this highlights another of astronomy’s trump cards: the predictability of such events allows the community to publicize and plan for the occasions long before they occur. The same could not be said, for instance, about the discovery of the next quasiparticle or the formulation of the latest incarnation of string theory.

Most would agree that astronomy does have some unique selling points. Some, however, might push this distinction even further and argue that astronomy is a separate discipline from physics altogether. The argument is that physics is a science concerned with the pursuit of general theories, applicable across the entire universe, that can be tested against empirical observations. Astronomy could be considered to be less fundamental in this respect, being a largely observational discipline.

But what do you think? Let us know via this week’s Facebook poll

Do you consider astronomy to be a distinct academic discipline from physics?
Yes
No

Have your say by casting your vote on our Facebook page. And feel free to post a comment to explain your choice or offer a different comparison between physics and astronomy.

In last week’s poll we acknowledged the 50th anniversary of the UK in space by asking the you who you thought was most likely to reach the next significant milestone in manned space exploration. The majority of voters believe that the future of manned space travel will play out in a different way to how it all began in the 1960s as a two-horse race between the US and the USSR. Some 46% of voters believe that “an emerging space nation such as China or India” will reach the next significant milestone. Another 20% believe that it will be an international collaboration. 16% think it will be a private company, 12% believe it will be the US and just 6% believe it will be Russia.

In addition to votes, the poll also attracted some interesting comments on our Facebook page. Owen Marshall, for instance, believes that the space race never stopped – it has just attracted some speedy new contenders. “While I think that an emerging nation will hit the next significant milestone in space exploration, I also believe that such an event will be a wake-up call to other nations such as the US and Russia, and that they will follow closely,” he wrote.

Thank you for all your participation and we look forward to hearing from you in this week’s poll.

Copyright © 2026 by IOP Publishing Ltd and individual contributors