Researchers in Spain have made the most sensitive mass sensor ever. Capable of weighing a single proton – which has a mass of 1.7 yoctograms, or about 10–24 g – the device is made of a suspended carbon nanotube. The sensor could be used to detect single molecules or to study chemical reactions as they happen, and could even provide insights into the fundamentals of quantum mechanics.
The new mass sensor was made by Adrian Bachtold and colleagues at the Catalan Institute of Technology in Barcelona. It consists of a single suspended carbon nanotube that resonates at a certain frequency. “We can increase the pitch – or acoustic resonance frequency – of this ‘nanostring’ by reducing its length,” explains team member Julien Chaste. “Our resonator is very short (just 150 nm in length) and is 2 nm in diameter.”
The carbon nanotube resonates at 2 GHz. When a tiny particle sticks to the tube, this resonant frequency drops – with heavier particles lowering it more than lighter ones. The shift in resonant frequency can be monitored and used to calculate the mass of the particle.
Researchers have made such mass sensors before and these devices were able to detect masses of about 100 yoctograms. The new device can weigh objects 100 times lighter still.
Current annealing
Bachtold’s team boosted the sensitivity of the device by passing a large electric current through it to “clean” it. “Such current annealing was sufficient to get rid of some absorbed atoms, which act as contaminating ‘dust’,” Chaste explains. The experiments were also conducted under ultrahigh-vacuum conditions to reduce interference from ambient molecules to a minimum, and at temperatures of just 4 K to reduce thermal effects.
The researchers used their nanobalance to detect single naphthalene molecules and small numbers of xenon atoms. From this, they calculate that the mass sensor has a resolution of 1.7 yoctograms, which is around the mass of a single proton.
Following chemical reactions
The team says that its sensor might be used to distinguish different elements in a compound, which might differ by only a few protons. It would therefore be possible to follow chemical reactions as they occur, says Chaste.
“The record mass sensitivity of our device is related to its tiny size, but the nanoworld in general, and nanoresonators in particular, is ultrasensitive to small masses, forces, charges and magnetic moments,” he adds. “As well as mass detection, nanoresonators operating at ultralow temperatures might also be very interesting for fundamental studies in quantum physics.”
Researchers in Japan have new evidence that the Earth’s lower mantle contains more silicon than its upper mantle. The results suggest that the composition of the Earth’s silicates match the type of meteorites thought to exist in the solar nebula from which the Earth was created.
The Earth’s mantle can be divided into three sections: the upper mantle, which stretches from the thin crust down to about 400 km in depth; a transition zone of about 250 km; and finally the lower mantle, which stretches from the transition zone to about 2900 km in depth. Most geoscientists agree that the upper mantle is composed mostly of peridotite, a dense igneous rock containing a high proportion of the mineral olivine (Mg,Fe)2SiO4. At the transition zone, a change in the way seismic waves propagate has generally been explained by a phase transition in the structure of the olivine, suggesting that the lower mantle, too, is peridotite in composition. If this is true, however, the Earth would contain far less silicon than chondritic meteorites – the type of meteorites thought to exist at the time of the Earth’s formation.
More or less silicon?
In the past, this “missing silicon problem” has provoked much debate. Some geoscientists believe that the missing silicon must be made up in the Earth’s core, while others believe the lower mantle must contain an additional source of silicon. There has even been a suggestion that the meteorites from which the Earth formed contained less silicon than is generally assumed.
Now, geophysicist Motohiko Murakami of Tohoku University in Sendai and colleagues claim to have solved the missing silicon problem. They believe that the lower mantle in fact contains more silicon than the upper mantle – which is consistent with the Earth having been formed from chondritic meteorites. “The main result of our work is that the mantle has [a] chemically stratified structure with [a] silicon-enriched lower mantle in comparison with the upper mantle,” says Murakami.
Murakami and colleagues performed laboratory-based seismic-velocity measurements on two possible lower-mantel minerals – silicate perovskite, or (Mg Fe)SiO3, and ferropericlase, or (Mg,Fe)O – under very high pressures and temperatures. Comparing these measurements with actual seismic-velocity data using a model, the researchers found that more than 93% of the lower mantle should be made of perovskite, the silicon-rich mineral.
James Connolly, a geoscientist at the Swiss Federal Institute of Technology in Zurich, says that in recent years there has been a trend in seismic models towards a silicon-enriched lower mantle, although he adds that the enrichment proposed by Murakami and colleagues is the “most extreme” he has seen. He thinks the group’s conclusions are interesting because they support the notion that the mantle has two separate layers that circulate independently, and that the Earth was formed by accretion of chondritic meteorites. “The popularity of both of these hypotheses has been waning in recent years,” he says.
Some uncertainty
However, geophysicist Baosheng Li of Stony Brook University in New York thinks there may be a problem with the Japanese researchers’ modelling. For example, he says that there is a “large uncertainty” in their temperature measurements, which may compromise their conclusions. Still, he thinks the group’s techniques are, in general, “first class”. “I found this paper interesting, although in my personal view it still needs more data to confirm [that] the lower mantle holds the ‘missing silicon’,” he adds.
The European Space Agency (ESA) has announced that a mission to Jupiter has beaten two other candidates to be the agency’s pick for its first “large” class (L-class) mission. The €850m Jupiter Icy Moons Explorer (JUICE) is expected to launch in 2022 and will travel to Jupiter and its moons. The 19 members of ESA’s Science Programme Committee opted for the craft during a meeting today in Paris following a recommendation from the ESA executive last month. The mission is the first L-class probe as part of ESA’s Cosmic Vision 2015–2025 programme.
JUICE is expected to carry about 11 instruments, which are not included in the mission’s €850m price tag as they will be paid for by the member states that build them. Once launched in 2022, the mission will take eight years to reach Jupiter, where the craft will then test the conditions that may have led to the emergence of habitable environments. “JUICE is a very exciting mission, and it’s about time Europe did another big planetary exploration, so I am not surprised the ESA executive sees this as the obvious thing to do,” says astronomer Andy Lawrence from the University of Edinburgh in the UK.
The missions that have missed out are an X-ray observatory called the Advanced Telescope for High Energy Astrophysics (ATHENA) and the New Gravitational Wave Observatory (NGO). Both ATHENA and NGO are downgraded versions of the €3.8bn International X-ray Observatory (IXO) and €1.8bn Laser Interferometer Space Antenna (LISA), both of which had to be redesigned after the US pulled out because of budget constraints. LISA was designed to measure gravitational waves – tiny ripples in space–time that are an unobserved prediction of Einstein’s general theory of relativity and that are believed to occur whenever massive objects accelerate. IXO was planned for launch in 2021 to study black holes and the hot gas associated with galaxies and stars.
The JUICE mission is also the result of NASA pulling out of the Europa Jupiter System Mission (EJSM/Laplace) – a joint mission with ESA that would have involved sending two probes to Jupiter and its moons: NASA’s Jupiter Europa Orbiter (JEO) and ESA’s Jupiter Ganymede Orbiter (JGO). JUICE is now based on the design for JGO and will focus in particular on studying three of Jupiter’s moons: Ganymede, Callisto and Europa.
“[This decision has] everything to do with NASA, and is really just about money,” says Lawrence. “NASA pulled out of all three predecessor missions – LAPLACE, IXO and LISA – so we just don’t have enough money to carry out the old plan.”
A “scary” decision
The announcement last month that the ESA executive had opted for JUICE caused consternation within groups working on NGO and ATHENA. Indeed, the NGO team sent a letter to Alvaro Gimenez, ESA’s director of science, complaining about how the process was handled, while the ATHENA team started a petition – created by Kirpal Nandra from the Max Planck Institute for Extraterrestrial Physics in Garching, Germany, along with 10 other astronomers – to save the mission.
“ATHENA offers a huge leap forward in capabilities with respect to current X-ray observatories and is at present the only possibility for a major astronomical observatory operating in the X-ray band a decade from now,” the petition authors write. The petition got the support of more than 1450 astronomers, and in addition to being sent to Gimenez was also passed on to representatives of the Science Programme Committee.
“ESA’s report to the Science Programme Committee contains no justification for the recommendation of JUICE,” Nandra told physicsworld.com. “The details of the decision-making process have been kept secret, so officially there is no information as to why we got the result we did.”
Lawrence says that ESA’s decision could damage European X-ray astronomy. “Astronomers will carry on doing X-ray related science,” he says. “But we will lose the technical and engineering skills, so we won’t be ready to build the next big mission when it finally comes. That is scary.”
That view is shared by Nandra, who says that the decision “could be a disaster, not just for X-ray astronomy, but the whole of astronomy and astrophysics”. He adds that there is now a “very real possibility” that there will be no operating X-ray observatory at all in the 2020s, as other national space agencies have nothing planned beyond the current decade.
It is likely, but not certain, that ESA will still launch a second L-class mission before the end of 2030, which will be a choice between ATHENA and NGO. “It’s really all about ATHENA versus NGO,” adds Lawrence.
It may sound inconceivable, but two physicists in Spain claim to have made an acoustic version of the wonder material graphene by simply drilling a honeycomb pattern of holes into a plastic sheet. Daniel Torrent and José Sánchez-Dehesa of the Polytechnic University of Valencia say they have spotted “Dirac cones” – a characteristic feature in the electronic band structure of graphene – in sound waves that propagate on the surface of the plastic. While much more work is required before practical applications could emerge from what the researchers call an “acoustic analogue of graphene”, the material could be used to improve acoustical systems or even gain a better understanding of graphene itself.
Since graphene was discovered in 2004, this 2D honeycomb lattice of carbon has been found to have a wealth of fascinating electronic properties. Many of these arise from the fact that graphene is a semiconductor with zero energy gap between its valence and conduction bands. Near where the two bands meet, the relationship between the energy and momentum of the electron is described by the Dirac equation and resembles that of a photon. These bands, called Dirac cones, enable electrons to travel through graphene at extremely high speeds.
Torrent and Sánchez-Dehesa decided to find out if an acoustic analogue to Dirac cones could exist. They did this by first calculating the properties of sound waves travelling on the surface of poly(methylmethacrylate) – also known as Perspex or Plexiglas – onto which holes had been bored to create a honeycomb lattice. The researchers were particularly interested in the dispersion relation of the sound waves, which is the relationship between the energy of a sound wave and its momentum.
Definitively Dirac
The calculations, which revealed the existence of a Dirac point and Dirac cones, suggest that the surface acoustic waves are best described by the Dirac equation. In particular, the model predicts the existence of surface acoustic waves with a specific Dirac frequency and Dirac velocity that should propagate with ease through the material without scattering.
To look for these waves, Torrent and Sánchez-Dehesa took a sheet of Plexiglas measuring 300 mm by 100 mm and bored 1113 holes in it to create a honeycomb pattern. Each hole had a diameter of 3 mm and depth of 2.88 mm, with the distance between holes being 3.33 mm. As illustrated in the image above, this resulted in the removal of a large amount of material, leaving behind a trellis-like structure.
The sheet was then connected to a loudspeaker and the sound was measured using microphones at two different locations. The physicists blasted the material with short pulses of sound with a central frequency of 22 kHz and a pulse width of about 5 kHz – chosen because the predicted Dirac frequency of the material lay within the pulse.
Sharp dip
Torrent and Sánchez-Dehesa found that the “phase delay” – the time difference in the arrival of the sound waves at each microphone – dipped sharply at about 22 kHz, which they say corresponds to the vertex of the Dirac cone. They also noticed that the dispersion relation of the waves, as calculated from their experiment, revealed a Dirac cone at about 22 kHz, as expected from theory. In particular, they found a linear relationship between momentum and energy near the Dirac point, which is a hallmark of a Dirac cone.
Nicholas Fang of the Massachusetts Institute of Technology in the US describes the work as “exciting” and told physicsworld.com that he agrees with Torrent and Sánchez-Dehesa’s claim of having identified a Dirac cone. “This is quite impressive, as from the theories, to observe such a Dirac cone in an acoustic system would require a precise shape and volume fraction of the structures,” he says.
Both Fang and the original researchers say that it is too early to know if materials with Dirac cones could be put to practical use. One possibility, however, could be to use them for acoustic lenses that can collect sound without losing any of it to reflection.
Torrent and Sánchez-Dehesa are now doing experiments designed to confirm that the acoustic waves travel unimpeded across the material – much like Dirac electrons in graphene. Indeed, Sánchez-Dehesa believes that similar materials could be used to simulate the electronic properties of graphene using sound. This could be useful because important properties such as lattice parameters can be easily changed in Plexiglas – but not in graphene itself.
The Institute of Physics and Picnic Films have bagged a gong at this year’s Learning on Screen Awards for making four short films about the career opportunities open to those with qualifications in physics. The award was given for best video in the “General Education Non Broadcast” category.
Each clip lasts about 6 min and topics covered include how ultrasound is used at Wolverhampton Wanderers Football Club and how the laws of physics are applied to the creation of video games. The other two videos look at how physics can be applied to solar energy and architecture.
The clips are aimed at 14–16 year olds who are working towards their GCSE qualification in physics. By capturing the imagination of British teenagers, the Institute of Physics hopes that the films will encourage more people to choose to study physics at a higher level and ultimately choose a career in physics.
You can watch the video on solar energy above and the rest of the clips can be found here.
Researchers in the US have developed a new type of textured glass that they claim is glare free and could either be self-cleaning or highly anti-fogging. The surface of the material – described as “multifunctional” glass – has a nanotextured array of conical features that is coated in a surfactant, giving the glass its desirable properties. The researchers hope that in the future the glass can be cheaply manufactured so that it could be used in optical devices such as smartphone screens and televisions, solar panels, car windshields and even windows in buildings.
Rolling drops
Scientists already know that a superhydrophobic surface – a surface that repels water, such as a lotus leaf – arises from a combination of surface “roughness” and certain intrinsic chemical properties. Water drops bounce or roll easily off such surfaces, taking with them any dust and dirt, so cleaning the surface. It is known that such enhanced superhydrophobicity can be achieved by patterning a surface with a dense array of conical pillars with rounded caps. These shapes make the surface water-repellent, while the conical shapes give a greater resistance to a loss of superhydrophobicity.
Conical nano-forest
In this latest material, the surface pattern consists of tiny cones that are five times as tall as their base width of 200 nm. The researchers, led by George Barbastathis and colleagues from the Massachusetts Institute of Technology (MIT) in the US, fabricated the glass using coating and etching techniques adapted from the semiconductor industry. The process involves coating a silicon-oxide substrate with several thin layers of a surfactant, including a photoresist layer, which is then illuminated with a grid pattern and etched away to finally produce the dense conical array. Using one type of surfactant makes the surface highly superhydrophobic.
Interestingly, if the same conical structures are coated with a different surfactant, it promotes superhydrophilicity – it allows a continuous water film to grow over it. This makes it highly anti-fogging. Barbastathis tells physicsworld.com that “it is the nanocones that determine the optical properties, while the hydrophilic and hydrophobic nature of the glass is determined by the surfactant used, as they determine the wetting properties of the surface”. Although the capped nanocones look rather frail under a microscopic, the researchers say their calculations show that the cones should be resistant to a range of forces, from the impact of raindrops in a strong downpour, wind-driven pollen and grit or even human handling. However, further testing is necessary to see how well the surfaces survive over time in practical applications.
According to the researchers, the inspiration for their multifunctional glass came from nature – where many biological surfaces perform multiple specific tasks. For their work, they looked at everything from water-repellent lotus leaves to the Namib Desert beetle, which is capable of collecting water from fog on its hardened wings, and to moth eyes that helped develop anti-reflective coating.
The researchers point out that solar panels – which often lose efficiency becuase of dirt or dust layers – could be protected by a layer of the “self-cleaning glass”. Furthermore, the anti-reflective properties of the glass would be better at transmitting incident light, especially when the Sun’s rays are inclined at a sharp angle to the panel. Other applications could include using the glass in microscopes and cameras that are taken into humid environments, where both the anti-reflective and anti-fogging capabilities could come in handy.
An interesting application of using the glass with a different surfactant could be in building windows. “You could have superhydrophobic glass on the outside of the windows so that rainwater is washed off, and superhydrophyllic glass on the inside of the building so the windows do not fog up,” explains Barbasththis.
In a brief on the MIT news site, the researchers say that in the future, textured glass could be produced “simply by passing it through a pair of textured rollers while still partially molten; such a process would add minimally to the cost of manufacture”.
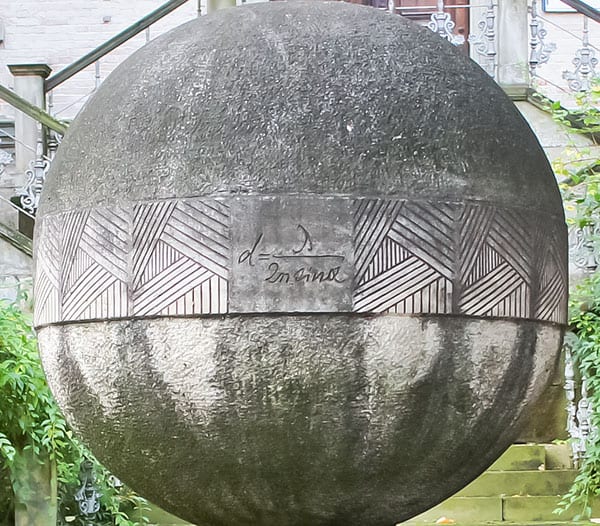
Ernst Abbe, one of the 19th-century pioneers of modern optics, has a concrete memorial sitting in the leafy grounds of the Friedrich Schiller University of Jena, Germany, engraved with a formula. Put simply, it describes a fundamental limit of all lenses: they cannot see everything. No matter how finely you grind and polish a lens, diffraction – the natural spreading of light waves – will always blur the smallest details.
Of course, theories should never be set in stone. At the turn of this century, physicists began to explore “superlenses” that could see past Abbe’s diffraction limit – that is, they could see features smaller than about half a wavelength of the light being used. Based on thin slabs of metal, these superlenses could bend light in unheard-of ways, counteracting diffraction so that an object’s features could be resolved into a perfect image. But there were problems: the lenses only worked if they were placed right next to an object and, even then, they were so lossy that their images were next to useless. Superlenses were not so super after all.
For many, that was a great shame. Biologists had been looking forward to imaging the tiniest parts of organisms in real time, which is almost impossible with current microscopy techniques. Perfect imaging could also have rebooted the computer-chip industry, allowing circuits and components to be etched smaller and more complex than before. Although other techniques exist that can see features smaller than half a wavelength – near-field scanning optical microscopy is one – they produce images by scanning a surface, which takes time. Only perfect imaging promised the ability to image objects at any resolution in a single snapshot.
Given the poor results of superlenses, some physicists have tried rehashing the blueprint in the hope that it can still offer practical applications. Others, however, have ditched the concept altogether, instead trying completely different approaches. These new approaches are in their nascent stages – most have not actually imaged anything, but only resolved point sources. Still, they are under high expectations, and could allow us to see more clearly than ever before.
Going negative
The superlens was a bold idea. First proposed in 2000 by theorist John Pendry of Imperial College, London, it hinges – as do all conventional lenses – on a property known as the refractive index. This describes the degree by which light bends as it enters a material – think how a stick dipped in water appears to bend towards the surface. As you would expect, a greater refractive index results in stronger bending. But Pendry’s insight came when he considered something radical: a negative refractive index.
To understand negative refraction, it is best to accept a little help from Albert Einstein. His general theory of relativity shows that very massive objects, such as stars or black holes, distort the underlying fabric of the universe – space–time – thereby bending the passage of light. Since refraction also bends light, one can picture it distorting an equivalent fabric – a virtual “optical space”. Negative refraction involves distorting optical space so much that it folds back on itself: a stick dipped in a negative-index substance would appear to bend the opposite way to usual.
Applying negative refraction to imaging, Pendry discovered a remarkable effect. Light rays usually defocus as they leave an object, but Pendry showed theoretically that negative refraction should cause these light rays to reconverge, creating an image of the object in perfect detail. Subsequent experiments proved him right, with superlenses achieving image resolutions of just a 20th of a wavelength – that is about 20 nm for visible light, and much smaller than Abbe’s limit of about half a wavelength. But limitations then surfaced.
One of these is to do with the negative-index materials, which are typically thin slabs of metal such as silver. Metals absorb light, particularly the part that carries the higher-resolution information. Another limitation is that superlenses must be sandwiched flush between the object being imaged and the detector. Only at this close range, in the so-called near field, can a superlens transfer all the information about the object to the image. So while in principle a superlens can produce images with unprecedented resolution, in practice it has limited use: it must be placed awkwardly close to the object, and even then the images appear grainy.
While in principle a superlens can produce images with unprecedented resolution, in practice it has limited use
These problems have not totally spelt the end for superlenses. One promising variation is the hyperlens, developed independently in 2006 by theorists Alessandro Salandrino and Nader Engheta at the University of Pennsylvania in Philadelphia, US, and Evgenii Narimanov, then at Princeton University in the US, and colleagues. Based on alternating layers of positively and negatively refracting material, the hyperlens can collect sub-diffraction-limited information from an object, just like a superlens can. Unlike a superlens, however, the hyperlens transfers this information to an image away from the near field into the far field. This means the hyperlens should be able to be integrated with more conventional optics, making it more attractive for practical applications.
The downside of the hyperlens is that, like its progenitor, it absorbs light, so reducing fidelity. “Loss is indeed an issue for all metal-related lenses,” says Zhaowei Liu, a physicist at the University of California, San Diego, US, who studies superlenses and hyperlenses. “But if you care about resolution more than transmission, then [superlenses and hyperlenses] are still okay. If things are really small, you can still see them – you just need to use really strong laser light.”
Back in time
Unfortunately, in many lines of research – biological imaging, say – intense laser light may not be an option, particularly if you want to avoid damaging your sample. But Geoffroy Lerosey, Mathias Fink and others at ESPCI ParisTech in France have shown that there is a way to achieve sub-diffraction-limited images without the drawbacks of superlenses or hyperlenses: so-called time reversal. So far, the group has demonstrated time reversal only for microwaves, which have fairly long wavelengths and are easier to manipulate than visible light. Nonetheless, at a conference in Barcelona, Spain, last year the researchers revealed numerical simulations suggesting that visible-light time reversal could also be a possibility.
So why does reversing time help beat the diffraction limit? The answer lies in evanescent waves: constituents of a normal wave that contain all the sub-diffraction-limited information. Evanescent waves usually peter out within a couple of wavelengths’ distance from an object – this is where the near field ends and the far field begins – which is why conventional lenses cannot see past the diffraction limit. It was only by effectively amplifying evanescent waves, using negative refraction, that Pendry showed superlenses were not restricted in this way. But Lerosey, Fink and others took a new tack to capture these fickle undulations: fooling emitted light into thinking it is going backwards, towards the source.
To see how this works, consider a demonstration performed by the researchers in 2007. The experiment consists of a group of antennas, each separated by a 30th of a wavelength – far less than the diffraction limit. One antenna in the group emits a microwave signal, which travels across a chamber to a second group of antennas. Upon receiving the signal, this second group of antennas – each of which is separated by half a wavelength – replays it backwards, like running a tape in reverse. As this time-reversed signal propagates, it interferes with itself in such a way that it converges towards the antenna in the first group that originally emitted it, almost as though it were travelling back in time (see box “A new way of seeing things”).
A new way of seeing things
Time-reversal imaging
A biological cell is placed near to a resonant metalens, a random collection of tiny oscillators. (a) Upon illumination, a cell shines through the metalens, which converts the evanescent light waves into propagating waves. This waveform reaches a sensor array (right). (b) If the waveform were simply recorded and re-emitted, it would spread out. (c) However, if the waveform is time-reversed before being emitted again, the waveform interferes with itself in such a way that it perfectly converges back to the source. But this last step does not have to be done in practice: an algorithm can predict what would happen were the time-reversed waveform to be emitted, creating a computer-based image with details smaller than the diffraction limit.
Maxwell’s fisheye
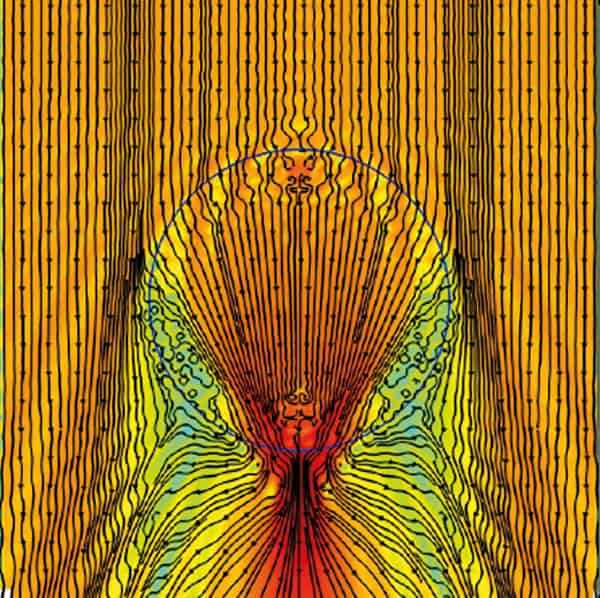
Maxwell’s fisheye is a flat lens with a spatially varying refractive index, which causes all light rays emitted from one point on the lens to meet at a point exactly opposite. In the design for a practical fisheye by Ulf Leonhardt and others (a), a mirror surrounds the lens, which enables an object to be placed not just on the surface of the lens but anywhere within it and still be imaged. In an experiment, Leonhardt’s group placed two microwave sources separated by a fifth of a wavelength on one side of the lens, and on the other side a bank of dissimilar microwave detectors separated by a 20th of a wavelength. (b) Only the detectors precisely opposite the two sources registered peak microwave signals. The researchers believe this is evidence that Maxwell’s fisheye can image beyond the diffraction limit.
Scattering-lens technique
The amount of light collected by a lens – defined by the lens’s numerical aperture – is key to imaging with higher resolution. According to Abbe’s formula, the greater the numerical aperture, the smaller the diffraction limit. (a) Even a large conventional lens struggles to collect much of the light emitted by an object – a lot passes by the sides. (b) A scattering layer placed before a lens captures light that would otherwise have been lost, thanks to the random path taken by light rays as they pass through the layer.
On its own, this process does not precisely focus the signal onto the antenna that originally emitted it. That is because the crucial evanescent waves never reached the second group of antennas – they would have already decayed. But here Lerosey, Fink and colleagues have another trick: they surround each antenna in the first group with a random collection of thin copper wires – a “resonant metalens”, in their terms – like a tuft of hair. This time, as an antenna in the first group emits a signal, the evanescent waves resonate with the wires and convert into propagating waves, which are detectable by the second antenna group. Now, upon time reversal, the signal focuses precisely back onto the source antenna and none of its neighbours, despite their being only a 30th of a wavelength away (Science315 1120). The fact that only the source antenna receives a signal shows that the imaging is truly sub-wavelength; if it were not, many neighbouring antennas – being closer to the source antenna than the diffraction limit – would also receive a signal.
Focusing a signal perfectly at its source would not be very useful for practical imaging – it only demonstrates that time reversal works. But in theory the focus point does not have to exist in the real world. To actually image something, you would only have to do a virtual time reversal – that is, record the incoming signal, calculate what the time-reversed waveform would look like, and then use software to predict the image that would have been produced. So unlike the image of a conventional lens, which is physically real, the time-reversed image would exist only in an algorithm’s output on a computer.
Let us say a biophysicist wanted to image a living cell. They would first place the cell within or near a resonant metalens and illuminate it with the necessary radiation – in this case, visible light. The signal from the cell, including the converted evanescent waves, would travel towards a bank of optical sensors, which would record it onto a computer. Then the computer would perform the time reversal and calculate the image that would be produced if the time-reversed signal were to propagate in real space.
Old idea
It is not yet clear whether the ESPCI researchers’ method will work in practice with visible light, for which record–playback time reversal will be much trickier. However, perhaps a simpler way to perform time reversal was dreamed up one morning in the early 1850s when James Clerk Maxwell, then a student at Cambridge University, was poking at his breakfast. According to legend, Maxwell was examining the kipper before him when he came up with the idea for a fisheye lens – a flat lens with a varying refractive-index profile that would cause light rays to travel in arcs, perfectly transferring all light rays emanating from one side to a point opposite.
Physicists had assumed Maxwell’s fisheye would not produce perfect images in practice, but in 2009 Ulf Leonhardt, a physicist at the University of St Andrews in the UK, predicted otherwise. Using Einstein’s equations of general relativity, Leonhardt showed that light rays emitted by an object on the surface of the fisheye would, in optical space, hug the surface of a sphere, travelling in great semi-circles that always meet at a point precisely opposite the starting point. This unique symmetry would mean that, on approaching the image point, the light rays would be acting as though they were travelling backwards in time towards the source. And this, said Leonhardt, meant perfect images.
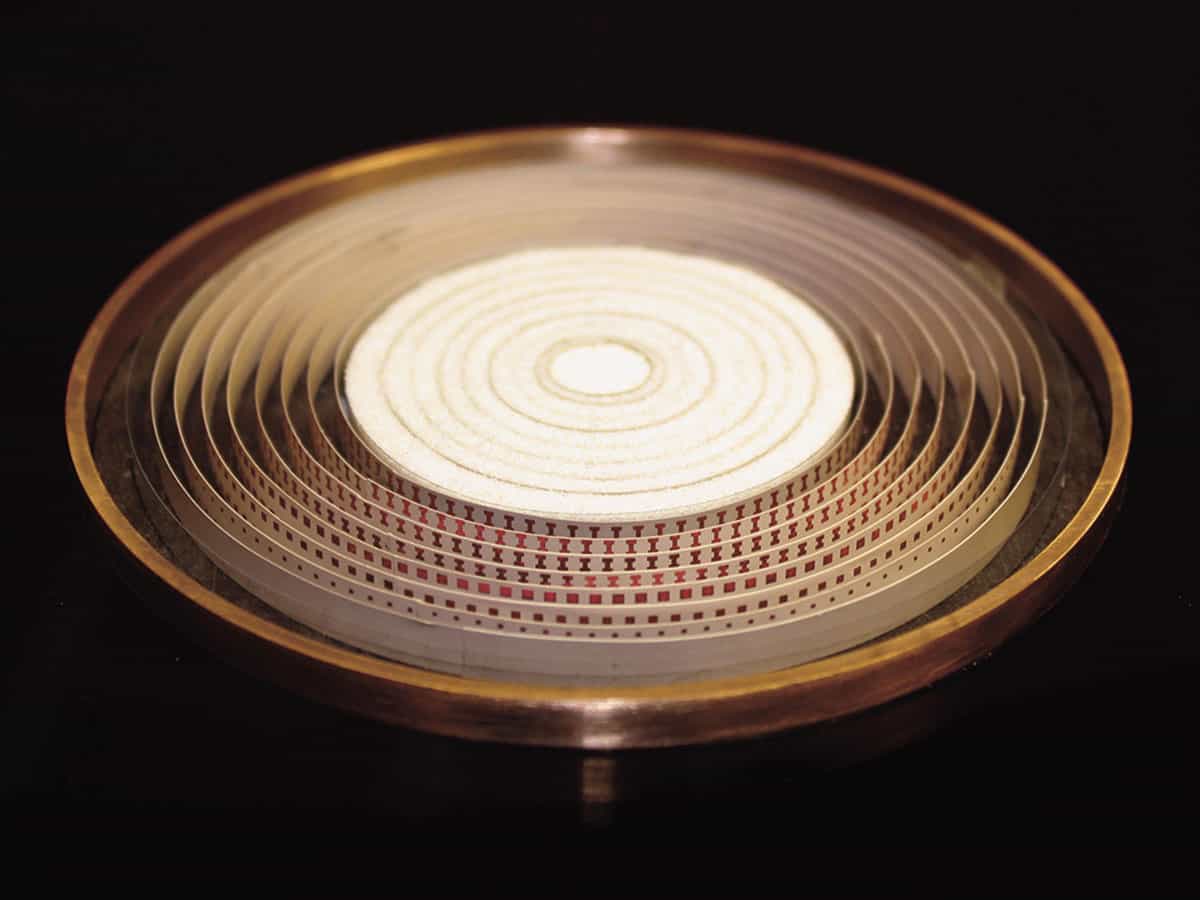
Proof perfect Ulf Leonhardt and Yun Gui Ma’s fisheye lens uses geometrical curves to mirror the curved universe of general relativity, but the device only works for microwaves. (Courtesy: Yun Gui Ma)
It was a controversial prediction, not least because it meant perfect imaging could be possible without negative refraction and, therefore, without loss – one of the main pitfalls of the superlens. But within two years Leonhardt – working with his student Yun Gui Ma, then at the National University of Singapore, and others – had experimental evidence that he was right. Their device used concentric rings of copper to achieve Maxwell’s refractive-index profile and, like the ESPCI researchers’ device, worked only for microwaves. Signals entered the fisheye via two sources a fifth of a wavelength apart and travelled across the device, into the far field, to a bank of 10 outlets a 20th of a wavelength apart.
If the fisheye did not exhibit perfect imaging, you would expect the output signal to be smoothed out over the outlets, because all 10 would span the diffraction limit of half a wavelength. Instead, the group found strong peaks at the two outlets that were precisely opposite the sources, separated by just a fifth of a wavelength (see box “A new way of seeing things”). For Leonhardt, this was sure evidence of imaging beyond the diffraction limit (New J. Phys.13 033016).
He has had to fight to convince others, however. One critic is Pendry, who believes the outlets record sub-wavelength features only because the outlets are “clones” of the source. Other sceptics go a step further and say that the signal peaks arise because of well-known field localization at the outlets, just as a lightning rod focuses electric fields around its tip. In December 2011 Richard Blaikie, then at the University of Canterbury in Christchurch, New Zealand, published results of a simulation in which a microwave source is contained within an empty mirrored cavity – that is, where there is no lens or refraction at all. He found that sub-wavelength focusing appeared when he added an outlet, or “drain” (New J. Phys.13 125006).
“The sub-wavelength field enhancement at or around the image point only occurs when the drain is present,” Blaikie writes. “The nature of the perfect imaging that has been the [cause] of much recent excitement is solely due to drain-induced effects.”
Leonhardt thinks his critics are missing the point. In his fisheye experiment there was not just one drain but 10. If Blaikie and others were right – that the perfect imaging is an artefact of the drains – then the field should have localized over each of them, since they were all spaced within the diffraction limit. Instead, the field localized only over the two drains precisely opposite the sources. Leonhardt believes the only way he will convince his sceptics will be to repeat the experiment in optics, a much more fiddly regime.
Beyond the limit
Virtual imaging The transparent microspheres employed by Zengbo Wang and others magnify the near-field light of an object (top of circle) so that it is big enough to be detectable (bottom of circle), thereby beating the diffraction limit. (Courtesy: Z Wang)
There are several other methods that have been shown to beat the diffraction limit. One of these, proposed in 2006 by Michael Berry and Sandu Popescu of the University of Bristol in the UK, involves so-called superoscillations. These are special types of wave, created in a hot-spot of many laser beams interfering with one another, that persist long enough for sub-wavelength information to transfer to the far field. In 2009 Fu Min Huang and Nikolay Zheludev of the University of Southampton in the UK showed experimentally that superoscillations could be used to focus light to a point as small as a fifth of a wavelength across. Unfortunately, the focus spot comes at a cost: an accompanying bright, unfocused halo of light, which might make imaging difficult in practice.
Another option was demonstrated last year by Zengbo Wang of the University of Manchester (now of Bangor University) in the UK and colleagues. Known as virtual imaging, it involves placing transparent spheres, each less than 9 µm across, onto an object, before shining white light up from beneath. The spheres essentially magnify the near-field light coming from the object to a size detectable by a camera above, offering a resolution of about 50 nm – about a quarter of the typical diffraction limit.
Finally, there is a way to see sub-wavelength details in the far field without using any special apparatus at all – just computer software. Developed by Mordechai Segev and colleagues at the Technion Israel Institute of Technology, it involves examining an image’s Fourier transform, which depicts wave components. For a diffraction-limited image, the Fourier transform would be incomplete. Segev and colleagues’ software therefore calculates the simplest wave components that would complete the Fourier transform and then adds them, essentially filling in the gaps by guessing what it expects to be there. The good news is unlimited resolution; the bad news is that – even in principle – it works only for sparse, technical images in which most pixels are blank. So if you were thinking of touching up your holiday snaps, think again.
Doing the opposite
Perhaps Leonhardt’s problem is that he is almost speaking a new language in optics. For example, he thinks the traditional distinction between the near field and the far field is a myth, particularly the notion that certain information is always lost in the far field. Yet among many sceptics, a few physicists think he might be onto something. “Leonhardt [is] one of the smartest people I ever met,” says Jacopo Bertolotti of the University of Twente in the Netherlands. “If he says Maxwell’s fisheye should work, he is saying it with many good reasons.”
In the meantime, Bertolotti, together with Allard Mosk and others at Twente, already has what may be the most impressive results yet for high-resolution imaging. Amazingly, though, the technique does not involve transferring light cleanly from source to image, but rather the opposite: scattering light in all directions (see box “A new way of seeing things”).
The reason for this counterintuitive approach is that Abbe’s diffraction limit depends not just on the wavelength of light being used, λ, but also on another property of the lens: the numerical aperture, nsinα, where n is the refractive index and α is the half-angle of the maximum cone of light that can enter the lens. In fact, the diffraction limit – the best resolution possible and the formula on Abbe’s memorial – is defined as λ/2nsinα. Similar to the aperture of a camera lens, the numerical aperture is a parameter that defines the range of angles over which a lens can collect light from an object. The greater the numerical aperture, the more light is collected – and the smaller the diffraction limit.
Set in stone Ernst Abbe’s memorial, engraved with his formula d = λ/2nsinα. (Courtesy: Jan-Peter Kasper/FSU)
Unfortunately, a big numerical aperture needs a big lens to collect lots of light. This is difficult for conventional lenses, which need a very high, well-tailored refractive index to bend light coming from the edges of an object back towards an image point. For these conventional lenses the biggest numerical aperture possible has a value of about 1, which is why the diffraction limit is usually about half a wavelength. A scattering lens offers a cheaper, easier way to achieve greater bending: light leaving the lens is sent randomly in almost all directions, which is good as it means some of it is bent through very large angles indeed. But the trouble is that the resultant image is a fuzzy, out-of-phase mess.
To avoid this problem, Bertolotti, Mosk and colleagues use a clever feedback mechanism that pre-adjusts the phase of the light reaching the scattering lens so that, once it passes through, it is in-phase again and not fuzzy. The light is pre-adjusted using a device known as a spatial light modulator, which is placed before the lens. To calibrate the modulator so that it changes the light’s phase by the right amount, a detector placed after the lens sends a test image to a computer, where it is analysed using an algorithm. The algorithm looks at the phase of the different parts of the test image and calculates how the spatial light modulator should compensate for the scattering by adjusting the phase of light going into the lens. Once the adjustment required is known, the modulator adjusts incoming light accordingly and any subsequent images taken using the scattering lens are in-phase and clear.
Last year, the Twente researchers tested their concept with a lens made from gallium phosphide, which they roughened on one side to scatter incoming light. They found that it could image, at a visible wavelength of 560 nm, gold nanoparticles with a resolution of just 97 nm (Phys. Rev. Lett.106 193905).
Praise for the Twente researchers’ work is high. “This is wonderful stuff,” says Leonhardt. “It is so non-intuitive. You make things worse to make things better.” Lerosey at ESPCI Paris Tech is also impressed, saying “It’s a good idea, it’s a nice group of concepts.” He adds that the field of view – the amount seeable by the lens – is not great, but then that is a practical hurdle that all these new techniques will have to overcome.
Of course, the catch with the scattering lens is that it does not actually beat the diffraction limit. The resolution may be nearly a sixth of the light’s wavelength, but it is within the confines of Abbe’s formula, which allows greater resolution so long as the numerical aperture increases – and in this case it is about 3. Conventional lenses cannot achieve sufficient apertures to resolve details finer than half a wavelength, but the scattering lens can – not with better quality optics, but with a neat use of computing technology.
So maybe there is a lesson to be learned. While there are now several promising approaches in addition to superlenses to smash Abbe’s diffraction limit, the best option for achieving sub-wavelength imaging in practice might well be to leave it intact. Setting the equation in stone was perhaps not such a bad idea, after all.
This article first appeared in the May 2012 issue of Physics World.
When it comes to scientific events that can get the whole world thrilled – researchers and non-scientists alike – astronomy wins hands down. Eclipses, comets or meteor showers, for example, are rare enough to get anyone with even a passing interest in science excited. But for true once-in-a-lifetime astronomical events, nothing can beat next month’s transit of Venus, in which our sister planet passes across the face of the Sun as viewed from Earth.
Transits of Venus occur in pairs eight years apart, with each pair separated by gaps of more than a century. The last transit occurred in 2004, meaning that the upcoming transit on 5–6 June will almost certainly be your only chance to see this rare astronomical alignment, as it will not occur again until 2117. For more on the science and history of this astronomical spectacular, don’t miss the fantastic feature “Venus: it’s now or never” by one of the world’s leading transit experts, Jay Pasachoff.
You can read the article here but to enjoy the article and images in all their glory, check out the May 2012 issue of Physics World. Members of the Institute of Physics (IOP) can read the new issue online for free right now through the digital version of the magazine by following this link or by downloading the Physics World app onto your iPhone or iPad or Android device, both available from the App Store and Google Play, respectively. The digital version lets you read, share, save, archive and print articles – either fully laid out or in plain-text view – and even have them translated or read out to you.
If you’re not yet a member, you can join the IOP as an imember for just £15, €20 or $25 a year via this link Being an imember gives you a full year’s access to Physics World both online and through the apps. To whet your appetite still further, here’s a quick summary of what else is in the new issue. And remember, let me know what you think of any of the topics by e-mailing me at pwld@iop.org.
• Atmospheric tales – Robert P Crease reveals why the discovery of Venus’s atmosphere is still so controversial.
• Quantum technologies: an old new story – Technologies based on the
properties of quantum mechanics have been around for many years, but Iulia Georgescu
and Franco Nori argue that we need a new definition for “quantum technologies”.
• Japan’s X-ray vision for the future – With the world’s first “compact” X-ray free-electron laser having opened its doors to users in March, Michael Banks travels to the remote SACLA facility in the mountains of western Japan to find out more about this ambitious new project.
• Fukushima fallout – Steven Judge and Hiroyuki Kuwahara report on efforts to monitor radioactive contamination in areas near the stricken Fukushima Daiichi reactor.
• Defeating diffraction – Once thought to offer imaging at unlimited resolution beyond that permitted by diffraction, superlenses never quite worked in practice. Now, physicists have a host of other ideas to make perfect images, but can these concepts succeed where superlenses failed? Jon Cartwright reports.
• Playing the game – Catherine Goode describes how a degree in physics and a childhood passion for computer and video games led her to a career in game design.
• Towards a Standard Model of finance – Andrew Aus looks at links between physics and finance in this month’s Lateral Thoughts column.
Apologies to our many Canadian readers, because this blog entry is not about that kind of curling – you can read about the physics of the winter sport here.
Instead, I’m blogging about how things like hair, plant tendrils and even red blood cells curl and uncurl. Despite these processes being all around us, it turns out that physicists have a relatively poor understanding of the dynamics of curling.
That’s why Andrew Callan-Jones of the University of Montpellier, France, and colleagues at the University of Paris have made a theoretical and experimental study of how a steel strip curls.
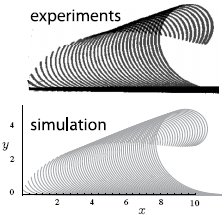
The experiment begins with a piece of steel that is 635 mm long, 9.5 mm wide and 0.13 mm thick. The strip is in a naturally curled state and is secured to a flat surface at one end. The strip is then flattened onto the surface and released so that it curls up again – a process that takes about 30 ms. The curling is captured by a fast camera at a rate of 7000 frames per second (above right).
The photographs reveal that the process begins at the free end of the strip, which lifts up and then bends over to complete the first few loops of the spiral. Then, a circular “spool” forms and some of the strip wraps tightly around this structure. Finally, the last few loops of the curl are wrapped very loosely round the spool.
One interesting observation by the team is that the radius of curvature of the spool is about twice that of the natural radius of curvature of the strip itself. This is illustrated by the fact that the free end of the strip forms a tighter curve inside the spool, with a radius of curvature that matches the material itself.
The physicists believe that the tight spool is formed as the curl spins rapidly – and this affects the radial forces that define the size of the spool.
This behaviour was successfully described by a mathematical model created by the team. These insights were then incorporated into a computer simulation of how a much longer strip would curl. This identified a third structure that emerges towards the end of the curling process – a large loosely wound region.
The researchers are now applying their new-found knowledge of curling to the bursting of red blood cells – which is caused by certain nasty bacteria and involves the curling back of the cell membrane.
The research is described in Physical Review Letters108 174302 and you can find the paper here.
Anyone lucky enough to be in the right place at the right time early next month will be in for a very rare treat – a sight of Venus passing across the face of the Sun. These fleeting astronomical events, known as “transits of Venus”, occur in pairs eight years apart, separated by gaps of more than a century. The fascination of these transits lies not only in their extreme rarity, but also in that they were once used to solve one of the biggest questions in astronomy: the distance between the Earth and the Sun. Yet one study of a particular transit of Venus remains controversial to this day.
It concerns the transit of 26 May 1761, as observed by the Russian polymath Mikhail Lomonosov. Using his four-and-a-half foot refracting telescope in St Petersburg, he claimed to have seen Venus’s atmosphere for the first time. “Venus”, he wrote shortly after the event, “is surrounded by a significant air atmosphere, similar to (if not even greater than) that which bathes our terrestrial globe.” Although we now know that Venus does indeed have an atmosphere, of the several dozen other people who saw the transit that day, none drew that explicit conclusion. Moreover, several current scientists still deny him the discovery (see “Venus: it’s now or never” by Jay Pasachoff).
The controversy is starkly displayed in the biography of Lomonosov published in 1937 by the chemist and historian Boris Menshutkin. Translated into English in 1952 by the US chemist Tenney Davis as Russia’s Lomonosov: Chemist, Courtier, Physicist, Poet, the book celebrates Lomonosov’s statement as a magnificent discovery. However, a footnote by the translator states equally authoritatively – the translator having consulted a US astronomer – that what Lomonosov saw had “nothing to do with the presence or absence of a Venus atmosphere and can in no case be regarded as a proof of its existence”.
So why does controversy still surround the discovery of Venus’s atmosphere more than 250 years later? What, if anything, can be done to resolve it? And what does this controversy tell us about the nature of scientific discovery itself?
Blisters and radiances
A polymath who contributed to many fields, including astronomy, Lomonosov (1711–1765) was the first Russian-born academician at the Russian Academy of Sciences. By the time of the 1761 transit, having notched up some 17 years’ experience making observations and inventing scientific instruments, he viewed the event from his house, a large dwelling with its own observatory.
“Having waited for Venus to enter on the Sun for about 40 min beyond the time prescribed in the ephemerides,” Lomonosov wrote, “[I] finally saw at last that the Sun’s edge at the expected entry had become indistinct and somewhat effaced, although before [it] had been very clear everywhere.” Thinking he was suffering from eye fatigue, Lomonosov looked away briefly, before returning to the eyepiece to find a small black spot joining the disc of Venus and the Sun. This was just after the moment of “first contact”, when the leading edge of Venus first touches the edge, or “limb”, of the Sun.
At second contact, when Venus was now entirely within the Sun and its trailing edge crossed the solar edge, Lomonosov noted that these two points were separated by “a hair-thin bright radiance”. Some six hours later as Venus’s leading edge approached the solar edge on its way outward from the Sun – what is dubbed third contact – the Russian wrote that “a blister appeared at the edge of the Sun, which became more pronounced as Venus moved closer to complete exit”. Not long afterwards, he saw fourth contact as “the blister disappeared, and Venus suddenly appeared with no edge”.
To support his conclusion that he had observed Venus’s atmosphere, Lomonosov cited the “loss of clearness in the [previously] tidy solar edge” at first contact, which he presumed to be caused by the “oncoming Venusian atmosphere”; as well as the “blister” at the third contact, which was, he said, caused by “refraction of solar rays in the atmosphere of Venus”. Lomonosov’s report, which also contained diagrams, was published in Russian on 17 July 1761 and in German a month later. Although other observers of the event mentioned a light radiance or aureole around Venus, none proposed a mechanism or explanation. So where is the controversy? Lomonosov said he had seen Venus’s atmosphere, described what he saw, produced a presumed mechanism, and published. Furthermore – spoiler alert – we know that Venus has an atmosphere.
Aureoles and artefacts
The controversy is sparked by two things: first, by how Venus’s atmosphere looks to contemporary Earth-bound instruments; and second, by what we now know about observational artefacts.
Historians know well the danger of “Whig history” – of judging the past from the perspective of the present. But science history can be different. Because laws and properties of nature are invariant, later observations can sometimes decisively correct previous ones. There are plenty of examples of wrong ideas being put right, not least Enrico Fermi’s detection of what he thought were transuranic elements in 1934, and Percival Lowell’s alleged detection of canals on Mars in the late 19th century. In the case of Venus, Jay Pasachoff from Williams College and his collaborator, the independent scholar William Sheehan, have written an article for the March/ April 2012 issue of the Journal of Astronomical History and Heritage (in press) pointing out that what we now know about the appearance of the refracted image of the Sun by Venus’s atmosphere, based on high-resolution observations of the 2004 transit, seems inconsistent with what Lomonosov reported in 1761.
Furthermore, modern observations have shed light on artefacts – products of instrument and observing imperfections rather than of the phenomenon being observed – that interfere with its perception. By far the most disruptive of these is the “black-drop effect”, which was first noticed by astronomers during the 1761 transit while trying to time the precise moment of second and third contacts. Nearly all observers saw, at second contact, a strange dark column or bridge linking Venus to the Sun, its precise appearance varying widely from one observation to another. Sometimes even being seen when Venus was as far as 3 arcseconds inside the solar disc, the bridge often thickened to make Venus’s disc look like an elongated droplet – hence the name. Another black drop affected the third contact, as Venus’s silhouette began to exit the solar disc. This effect – which was ascribed to a combination of factors, including the inherent optical limit of the telescope, physiological factors in the retina and atmospheric conditions – reduced the expected precision of 18th-century measurements of the Earth–Sun distance by about two orders of magnitude.
In space observations of the 1999 Mercury transit, Pasachoff and Schneider noted a black drop and found that an important contribution came from a hitherto largely overlooked effect: the extreme drop-off in brightness or “limb-darkening” at the Sun’s edge. In their article in the Journal of Astronomical History and Heritage, Pasachoff and Sheehan argue that Lomonosov observed not Venus’s atmosphere, but probably an artefact partly caused by this limb-darkening effect. Moreover, they suggest that Lomonosov was predisposed to assume that an atmosphere existed on Venus because of his belief in the plurality of worlds; in other words, because he was already convinced of the existence of an atmosphere, he may have been looking for effects that might reveal it. “Lomonosov arrived at the correct conclusion but on the basis of a fallacious argument,” they write.
The task of reconstructing what Lomonosov saw is extremely difficult because the words are ambiguous – and of course originally in Russian and German. It is like trying to recreate a photograph based on someone’s 250-year-old description in another language and then coming to conclusions regarding not one but several fine details about the item photographed. The Russian word translated into English as “blister”, for instance, is pupyr, which also means pimple. How can we confidently connect it with either an aureole or the notoriously variable black drop? What about the “hair-thin bright radiance”? Is that an aureole produced by the atmosphere or – as Pasachoff and Sheehan say – the first bit of solar disc visible limbward of Venus’s silhouette when the black-drop effect ended?
Lomonosov reported unusual effects at all four contacts, and argued that effects at the first, third and fourth contacts were caused by Venus’s atmosphere. Lomonosov’s description of the third contact seems to provide the firmest support – although Pasachoff and Sheehan dispute this, pointing out that in 2004 they saw the atmosphere for 20 min after the exit of the leading edge, and that Lomonosov writes that Venus had “no edge”.
Re-enactments?
Historians have discovered the danger of being overly confident about declaring that an experimentalist from an earlier era could not have seen a certain phenomenon, for such claims often short-change the abilities of antecedent scientists. A notorious cautionary tale involves the historian of science Alexandre Koyré, who in the 1950s confidently asserted that Galileo could not have deduced his law of falling bodies using such an inexact method as rolling balls down inclined planes and timing them with water clocks; surely Galileo must have deduced the laws first and cooked the data! This view was famously destroyed in 1961 by Thomas Settle, then a Cornell University history of science graduate student, who recreated the experiment in his room and managed to obtain precise enough data to deduce the law.
The rarity of Venus’s transits makes repetition problematic, but next month’s transit – the last until 2117 – seems to provide an outstanding if rare opportunity: pull out Lomonosov’s telescope and look.
However, this is not as simple as it sounds. First, we do not know which telescope Lomonosov used; we might only be able to deploy one of a similar kind. Second, there would be the non-trivial problem of securing permission to use a valuable and delicate historical instrument. Third, atmospheric conditions on transit day may not be identical. Finally, there’s the matter of experimental skill. Experiments are not automatic, and often involve pushing instruments to their limits. Knowing how such instruments can be trusted under which conditions is a mark of experimental skill, and often a function of how much an experimentalist has worked with the instrument. More skilled experimentalists can notice things that others miss with better equipment. A 21st-century observer using an 18th-century instrument is likely to lack this kind of skill.
The critical point
During the 1950s, one important fuel for passions surrounding the dispute over Lomonosov’s priority was Cold War rivalry; Western historians and scientists often attributed Soviet claims involving achievements of Soviet scientists as being propaganda. Such attitudes, however, are now long gone. But the issue still generates passions because the inability to resolve this issue points out the disturbing fact that some historical questions – and even some scientific ones – have hard-to-decide or ambiguous aspects.
Sometimes this is because the discoveries evolve in phases over an extended time; examples include the discoveries of oxygen and of dark energy. Who discovered Venus’s atmosphere would seem much easier to decide, for it has to do with what one astronomer observed at a precise instant looking at a specific event through a particular telescope. Yet because of the ambiguities of language, and of the impossibility of repeating the relevant conditions and deploying the necessary skills, this too may remain impossible to decide upon.
Teams of astronomers, both professional and amateur, hope to use antique telescopes to observe the coming transit – “experimental archaeologists”, as Sheehan calls them. He himself is planning to use a 19th-century 168 mm Brashear refractor at Mt Wilson, while others at Lowell Observatory plan to use the 152 mm Clark refractor that Percival Lowell took to Japan in 1892. What they find may shed some additional light on what earlier observers may have seen. Even so, the question of what Lomonosov saw is likely to remain forever open-ended.



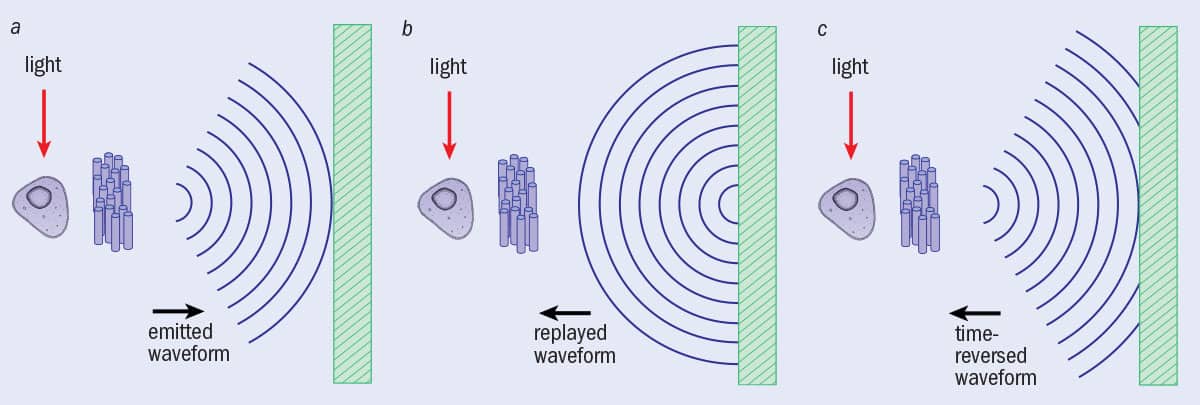 A biological cell is placed near to a resonant metalens, a random collection of tiny oscillators. (a) Upon illumination, a cell shines through the metalens, which converts the evanescent light waves into propagating waves. This waveform reaches a sensor array (right). (b) If the waveform were simply recorded and re-emitted, it would spread out. (c) However, if the waveform is time-reversed before being emitted again, the waveform interferes with itself in such a way that it perfectly converges back to the source. But this last step does not have to be done in practice: an algorithm can predict what would happen were the time-reversed waveform to be emitted, creating a computer-based image with details smaller than the diffraction limit.
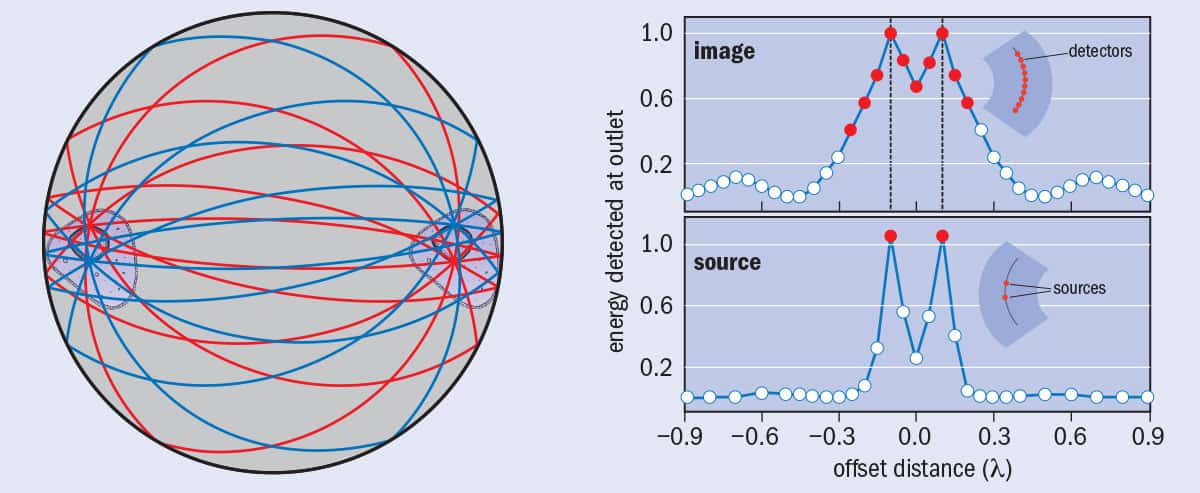 Maxwell’s fisheye is a flat lens with a spatially varying refractive index, which causes all light rays emitted from one point on the lens to meet at a point exactly opposite. In the design for a practical fisheye by Ulf Leonhardt and others (a), a mirror surrounds the lens, which enables an object to be placed not just on the surface of the lens but anywhere within it and still be imaged. In an experiment, Leonhardt’s group placed two microwave sources separated by a fifth of a wavelength on one side of the lens, and on the other side a bank of dissimilar microwave detectors separated by a 20th of a wavelength. (b) Only the detectors precisely opposite the two sources registered peak microwave signals. The researchers believe this is evidence that Maxwell’s fisheye can image beyond the diffraction limit.
 The amount of light collected by a lens – defined by the lens’s numerical aperture – is key to imaging with higher resolution. According to Abbe’s formula, the greater the numerical aperture, the smaller the diffraction limit. (a) Even a large conventional lens struggles to collect much of the light emitted by an object – a lot passes by the sides. (b) A scattering layer placed before a lens captures light that would otherwise have been lost, thanks to the random path taken by light rays as they pass through the layer.