Mapping forest carbon stocks

biomass map.jpg

By James Dacey

The distribution of stored carbon across the globe is considered to be a major uncertainty in greenhouse gas emissions calculations. But this map could help to improve the situation by detailing the spread of biomass carbon stocks over 2.5 billion hectares of forests across three continents – encompassing all tropical forests.

The map was created by researchers in the US, the UK and Gabon, who combined satellite data and ground-based observations to calculate above- and below-ground biomass quantities to a resolution of 1 km. To calculate forest heights, the researchers collected more than 3 million lidar shots using an instrument aboard NASA’s Ice, Cloud,and land Elevation Satellite (ICESat).

Presenting their map in a paper published online yesterday in Proceedings of the National Academy of Sciences, the researchers say that forests in the study region contained 247 GT of carbon. Forests in Latin America, sub-Saharan Africa, and south-east Asia accounted for 49%, 25% and 26% of the total carbon stock respectively.

The regions with the largest carbon biomasses are highlighted in deep red, while the zones with the least carbon are coloured in violet.

The researchers say that the new data and accompanying map could help developing countries in the study area to implement climate change mitigation policies relating to deforestation and degradation (REDD).

NMR spectroscopy without the ‘M’

Nuclear magnetic resonance (NMR) spectroscopy is perhaps the most useful technique in the organic chemist’s toolkit. But conventional NMR requires the sample to be placed in a very high magnetic field, which needs large and expensive superconducting magnets cooled by liquid helium. Now, an interdisciplinary group in the US has managed to accomplish NMR spectroscopy without magnets. The work could lead to portable NMR spectrometers, and possibly even small personalized spectrometers for medical diagnosis.

How it’s done

The applied magnetic field serves several purposes in NMR. Most nuclei of interest in NMR have two states – spin-up and spin-down. When placed in a magnetic field, the spin-down state is at a higher energy level than the spin-up state. Conventional NMR works by bombarding the sample with radio waves and measuring the energy absorbed or emitted when nuclei flip between the two states. The same nuclei in different parts of a molecule have slightly different transition frequencies; so measuring these frequencies allows researchers to work out the location of particular atoms in the molecule.

The bigger the magnetic field, the easier it is to resolve these different frequencies, providing a better understanding of complex molecules. Furthermore, a larger magnetic field increases the proportion of nuclei that are spin-up, which in turn causes a larger perturbation between the states, which gives a stronger signal.

The bottom line is that the signal intensity in conventional NMR increases roughly as the square of the magnetic field strength. NMR spectrometers over the years have therefore become bigger, more powerful and more expensive. The alternative – NMR spectroscopy with no applied field – seems bizarre because it should mean no energy gap, no spin polarization and nothing to measure.

Spin couples

Fortunately, in addition to interacting with the magnetic field, the nuclear spins also interact with each other. This effect, called “J-coupling” or “spin-spin coupling” is much smaller, but it is still seen in a standard NMR spectrum as a splitting of the main absorption peaks. In the absence of an applied field, the J-coupling is all that remains. The researchers say that the signals resulting from pure J-coupling can impart plenty of information regarding chemical structure. “We have acquired zero-field J-spectra in dozens of molecules, and no two molecules have produced the same features,” says atomic physicist Micah Ledbetter of the Nuclear Science Division at the University of California at Berkeley, who was part of the research. Nevertheless, since J-coupling is much weaker than the coupling to a strong applied field, the resonance associated with pure J-coupling is much harder to detect.

Solve and resolve

The current research at Berkeley builds on previous work in low and zero-field NMR and attacks this problem in two ways. First, the problem of spin coupling without an applied magnetic field can be overcome by employing a technique known as “parahydrogen-induced polarization”. Parahydrogen is a spin isomer form of hydrogen with the anti-parallel spin alignment, forming a “singlet state” (see image above). The technique used by them transfers a special kind of polarization from to the sample molecule, resulting in enormous signal enhancement. While the phenomenon of parahydrogen-induced polarization has been known for some time, the current work is the first to successfully use it in zero-field.

The researchers then used an innovative technique to measure the faint magnetic fields. The detectors used in early experiments with low-field NMR needed to be cooled to near absolute zero, which defeated the purpose of removing the applied field in the first place. Instead, the researchers modified a different type of detector called an “optical atomic magnetometer” – which requires no refrigeration – for use at zero-field.

The team demonstrated its technique by distinguishing between several similar hydrocarbon molecules – the first time that zero-field NMR has been successfully used for such complex chemical analysis.

Bernhard Blümich, an NMR spectroscopist at Aachen Technical University in Germany, is impressed. “This is a milestone paper,” he says, “All these components you need are not very expensive or can be made inexpensive in the future. You come up with an NMR spectrometer which is much less expensive than today’s high-field spectrometers.”

The research is published in Nature Physics.

Semiconductor shows its chameleon side

Physicists in Japan have shown how to make a semiconductor magnetic simply by applying a fairly modest voltage across the material at room temperature. Although the effect had been seen before, it previously required ultralow temperatures and massive voltages. Masashi Kawasaki of the University of Tokyo and colleagues say that their discovery could help to make MRAM memory chips more energy efficient, because a current would no longer need to be applied when writing data to the chips.

Magnetism plays a key role in much of condensed-matter physics, with metals such as iron and cobalt displaying permanent magnetism, or ferromagnetism, because the magnetic spins of their constituent electrons naturally align with one another. Semiconductors such as silicon, however, are instead paramagnetic, which means that their spins line up only when exposed to an external magnetic field.

But what Kawasaki’s team has done is to show that the semiconductor titanium dioxide, doped with about 10% cobalt impurities, can be transformed from a paramagnet into a ferromagnet (and back again) when housed in an electrolytic cell and a voltage applied across it.

In the absence of an applied voltage, the three spins inside each cobalt ion align with one another but there is no alignment between ions, as would be expected in a paramagnet. But with an applied voltage, extra electrons can enter the material, conveying information about the electron spins within the cobalt ions from one ion to the next. The spins of the ions now line up with one another, which in turn orients the spins of the mobile electrons in the same direction.

Although the chameleon-like ability to turn magnetism on and off in a semiconductor had been previously demonstrated by Hideo Ohno and colleagues at Tohoku University in Japan in 2000, using a thin-film semiconducting alloy, they were only able to do it at the ultralow temperature of 25 K and with a massive 125 V.

But by incorporating an electrochemical cell into a field-effect transistor, Kawasaki’s group has been able to add much larger densities of electrons to the semiconductor and so switch the material’s magnetism on and off at room temperature using a potential difference of just 4 V.

The researchers confirmed the presence of ferromagnetism in the doped titanium dioxide by passing a current through the material and measuring the voltage generated across it. The predominance of one spin direction over the other forced electrons to scatter more to the left than to the right (or vice versa), thereby generating a potential difference at right angles to their path (a phenomenon known as the anomalous Hall effect).

Flipping great

Kawasaki says that his team’s finding could boost the energy efficiency of MRAM memory chips, which consist of millions of pairs of tiny parallel ferromagnetic plates, with the plates in each pair separated by an insulator. The electrical resistance of these pairs is lower when the spins in each of the two plates are lined up in the same direction and higher when they are aligned in opposite directions, corresponding to a “1” and “0”.

Writing data to the chips involves altering the relative orientation of the magnetic spins, which is currently achieved by sending a current down a wire and exposing the plates to a magnetic field. If, however, the spins could be made to flip simply by applying a voltage to the pairs of plates then this flipping could be carried out at much lower energies, says Kawasaki. Although he has not yet actually managed to flip the spins in a semiconductor, Kawasaki says this is next on his agenda.

He admits that energy consumption in MRAM chips is not currently a huge issue, simply because this kind of memory is still not widely used, being much more expensive than other types of storage technology, such as flash memory. But he says that if prices come down and MRAM devices become more popular (they are fast and durable) then their hunger for energy will become a problem.

At that point, he maintains, it would make more sense to use semiconductors that can be made ferromagnetic by applying a voltage. “IBM is aiming at doing away with hard drives and using MRAM instead,” he says. “But its devices need a current to flip the memory.”

Magnetic messengers

Other researchers also believe that the latest work may have significant practical pay-offs. Yuan Ping Feng of the National University of Singapore thinks it could “lead to technological applications in semiconductor spintronics”, while Igor Žutić and John Cerně of the State University of New York in the US, writing in a “perspectives” piece accompanying the paper, argue that the new ferromagnets could “help us make more versatile transistors and bring us closer to the seamless integration of memory and logic”.

Žutić and Cerně also point out that, unlike normal ferromagnets, in which heat is a problem because it tends to break up the spin alignment, the new material might actually enhance magnetism at higher temperatures because additional heat increases the number of charge carriers. “This could strengthen their role as magnetic messengers and could conceivably overcome the usual role of heat as the main foe of ferromagnetism,” they say.

The research is reported in Science 332 1065.

Goodnight, Spirit

USPS.jpg
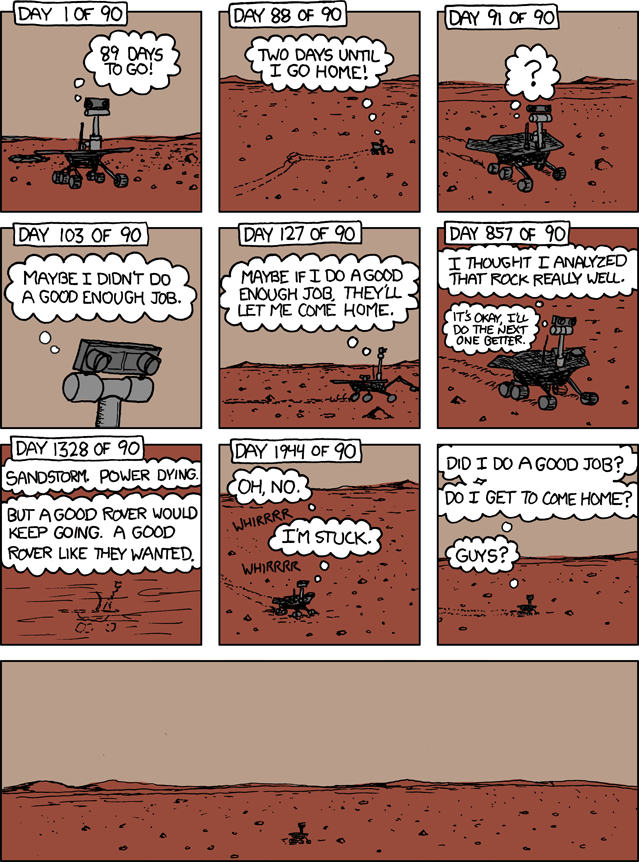
The “Spirit” comic strip on the xkcd.com webcomic (Credit: Randall Munroe/Creative Commons)

By Tushna Commissariat

The long and tumultuous journey for NASA’s Mars rover Spirit has finally come to an end, as the space agency’s engineers have ended attempts to regain contact with the vehicle, which has been out of touch since 22 March 2010. Now, Spirit’s twin, Opportunity, will explore the red sands solo until the arrival of younger brother Curiosity – NASA’s third rover, set to be launched in November.

The end of the road for Spirit came yesterday, when NASA engineers made a final and unsuccessful attempt to contact the rover. They had hoped that Spirit might rejuvenate as the solar energy became available once more, after a rather cold and dreary Martian winter without much sunlight. But without enough energy to run its survival heaters, the rover likely experienced colder internal temperatures last year than in any of its previous six years on Mars, possibly causing critical internal damage.

“Our job was to wear these rovers out exploring, to leave no unutilized capability on the surface of Mars, and for Spirit, we have done that,” says Mars Exploration Rover Project manager John Callas of NASA’s Jet Propulsion Laboratory in Pasadena, California.

Spirit landed on Mars on 3 January 2004 for what was planned as a three-month mission. After accomplishing its primary objectives, Spirit went on to explore a distance of 7.7 km, almost 12 times its initial goal. Spirit became the first robot to climb to the summit of a hill on another planet; and covered more than half a mile after its right-front wheel became immobile in 2006. Over time, it sent home more than 124,000 images, looked at 92 samples of soil and rock and unexpectedly discovered silica deposits in the Martian soil when it upturned soil due to a dragging back wheel. This was, ironically, one of the biggest discoveries made by a rover to date.

“What’s most remarkable to me about Spirit’s mission is just how extensive her accomplishments became,” enthuses Steve Squyres of Cornell University, Ithaca, a principal investigator for Spirit and Opportunity. “What we initially conceived as a fairly simple geologic experiment on Mars ultimately turned into humanity’s first real overland expedition across another planet. Spirit explored just as we would have, seeing a distant hill, climbing it and showing us the vista from the summit. And she did it in a way that allowed everyone on Earth to be part of the adventure.”

Just in case you are about to shed a tear, you might enjoy the above image that Randall Munroe, a former physicist who is now behind the popular xkcd.com webcomic, drew sometime last year when contact was lost with the rover. A rather touching and prophetic image, he brings out the human side of our robot geologist.

Tōhoku quake coincided with sky ‘anomalies’

A preliminary analysis of the atmosphere and ionosphere over Japan in March reveals infrared and electron anomalies coincident with the Tōhoku earthquake, researchers in the US and Russia claim. The anomalies are the latest evidence for a possible link between seismic activity and changes in the atmosphere or ionosphere, although sceptics believe they are unrelated.

Seismologists have searched for early-warning signals of earthquakes for more than a century. These range from small tremors in the ground, to aurora-like lights in the atmosphere and even to bizarre animal behaviour. But despite a few records of such incidents coming before quakes – usually noted retrospectively – there has never been any consistent method to accurately predict when a major shock is going to happen.

Tell-tale signs?

Many scientists still monitor various parameters around quake-prone regions in the hope that they will improve forecasting, or perhaps open up avenues towards prediction. These parameters include infrared emissions in the upper atmosphere and the total electron content (TEC) of the ionosphere – the part of the Earth’s atmosphere between altitudes of 80 and 1000 kilometres that is made up of electrons and ions. Changes in both infrared emissions and TEC are known to occur for non-seismic reasons: the infrared varies with cloud cover, for instance, while TEC gets a boost during heightened solar activity. Yet researchers have still claimed that they can pick out anomalous behaviour in the infrared and TEC that coincided with various past quakes, such as the 2008 Sichuan earthquake in China and the 2010 Haiti earthquake.

Now Dimitar Ouzounov of Chapman University in Orange, California, and colleagues claim to have evidence of anomalous infrared and TEC signals shortly before the magnitude 9.0 earthquake that struck off the coast of Tōhoku, Japan, on 11 March this year. The researchers believe that the apparent anomalies could be evidence that major seismic activity is preceded by a release of radon gas that ionizes and heats the surrounding air.

Ouzounov’s group retrospectively analysed four parameters: the Earth’s outgoing infrared radiation, using satellite imaging; the ionosphere’s TEC, calculated from global positioning satellite signals; the cross-section or “tomography” of the ionosphere, using data from low-Earth-orbit satellites; and the density of upper-ionosphere electrons, calculated from signals taken at four Japanese ground-based ionosonde stations. The infrared data was analysed for the month of March over a period of eight years – from 2004 to 2011 – while the ionospheric data was analysed only for around the time of the Tōhoku quake.

The researchers found what they say is the first indication of an infrared anomaly on 8 March 2011, three days before the quake. By 11 March, the day of the quake, the location of the maximum infrared emission apparently fell exactly over the quake’s epicentre. Meanwhile, they also found an increase in electron density, reaching a maximum on 8 March. This day also showed an abnormal variation in TEC over the epicentre, according to the findings. On 3–11 March the ionosondes recorded a “large increase” in electron density.

Supporters and sceptics

“The results are interesting for me even though the physical mechanism is not clear,” says Katsumi Hattori, a geoscientist at Chiba University in Japan. “My opinion is that their approach is one of the hopeful ways to forecast seismic activity. I think the prediction – when, where and what magnitude – is difficult, but the monitoring of [infrared emissions] and TEC can provide information for seismic activity. They are just the same as the parameters for a weather forecast.”

Yet many seismologists are sceptical about the benefits of such analyses, believing that it is easy to find correlations when data is taken selectively. Ian Main, a seismologist at the University of Edinburgh in the UK, says signals in the atmosphere and ionosphere “fluctuate all the time, and it would be surprising is some fluctuation did not occur around the time of the earthquake”. He adds, “One of the things you can predict about earthquakes is that following the event there will be claims of precursory behaviour identified in retrospect.”

Thomas Heaton, a seismologist at California Institute of Technology in the US, is also sceptical of prediction. “Through the years I have seen dozens of reported anomalous geophysical signals,” he says. However, we have yet to discover a precursor to an earthquake that reliably produces a significant signal before it occurs. “In fact, the more we look, the more it seems as though a large earthquake starts similarly to a small earthquake,” he adds, explaining that due to the similarities, even an advance signal would not help to judge the intensity of an upcoming earthquake.

Still, Ouzounov and his group are hopeful that their work will help both forecasting and prediction. Ouzounov told physicsworld.com that they have listed more than 100 earthquakes during the last decade and have discovered a “systematic appearance of atmospheric and ionospheric signals in the same time frame we have shown for the Tōhoku earthquake”.

The preliminary results are available on the arXiv preprint server.

Nanoantennas target single particles

Researchers have, for the first time, used a single “nanoantenna” – a device that collects and focuses light – to demonstrate that it could be used to detect particles and atoms. The work, by scientists at the Lawrence Berkeley National Laboratory (LBNL) in the US and the University of Stuttgart in Germany, could be used to make extremely sensitive gas sensors and detectors.

Conventional antennas, widely used to transmit radio or TV signals, can be used at optical frequencies if they are shrunk to the nanoscale, which could have potential applications in nanophotonics. The nanoantennas can also be used to generate electronic surface waves known as “surface plasmons”. This is done by confining electromagnetic waves – typically at the interface between metallic nanostructures (usually made of gold) and a dielectric (usually air) – that have dimensions smaller than half the wavelength of incident light.

When the oscillation frequency of the created plasmons matches that of the incident electromagnetic waves, a phenomenon known as “localized surface plasmon resonance” (LSPR) occurs, which concentrates the electromagnetic field into an even smaller space – around 100 nm3. Any object brought into this so-called locally confined field – or “nanofocus” – will affect the LSPR in such a way that it can then be detected using a technique called dark-field microscopy – a technique where only scattered light makes up an image.

Many applications

Paul Alivisatos and colleagues have now used such a set-up to detect single particles and atoms. The researchers created a novel version of the set-up whereby they carefully placed a single palladium nanoparticle in the focus of a nanoantenna made of gold. The interaction between the gold and the palladium nanoparticle creates an LSPR so that any particle that is brought near the vicinity changes the dielectric function of the palladium particle as it absorbs or releases it. “Light scattered by the system can be collected by a dark-field microscope and the change in the LSPR read out in real time,” says LBNL researcher Laura Na Liu.

The antenna enhancement effect can be controlled by changing the distance between the palladium nanoparticle and the gold antenna. The shape of the nanoantenna is important too, so that antennas that form a pointed tip are especially good for plasmonic sensing.

The researchers say that the device could be used to detect flammable gases, like hydrogen, that might easily be ignited by electricity during measurements with conventional sensors. Detecting small amounts of hydrogen is becoming increasingly important for developing fuel cells, especially as the gas can explode or ignite at concentrations of as little as 4%. And replacing the palladium with other nanocatalysts, such as ruthenium, platinum or magnesium, means that it could be used to detect gases such as carbon dioxide and nitrous oxides.

Alivisatos says that the new device, and the way it is made, provides a general blueprint for amplifying plasmonic sensing signals using single particles that “should pave the road for optically observing chemical reactions and catalytic activities in nanoreactors.” The device could also serve as a bridge between plasmonics and biochemistry, adds Liu, because it offers a unique tool for probing biochemical processes using light. The technique employed dispenses with the need to use fluorescent markers to label molecules for subsequent detection.

“This work very elegantly shows that nanoantennas can be used to pick up very small changes in a satellite nanoparticle which may be optimised for specific chemicals,” says Otto Muskens from the University of Southampton in the UK, who was not involved in the work. “This is an important next step in plasmonic biosensing with many possible applications.”

The findings were detailed in Nature Materials.

Judgement without understanding

Back in the late 1930s the University of Chicago initiated a search for a top-flight physicist. When it sought advice from geophysicist Merle Tuve, then at Johns Hopkins University, he apparently replied “Now, if you want to get a genius, don’t get [Edward] Teller, get [George] Gamow. But geniuses are a dime a dozen. Teller is much better than a genius. He is a man who gets along with everybody, who helps everybody. He has…never got into a disagreement with a single person.”

Tuve’s advice is wonderfully ironic, given that Teller’s later life was defined by disagreement. He annoyed his fellow physicists when he enthusiastically promoted the building of the hydrogen bomb, then made himself into a pariah in 1954 when he provided damning testimony against his former mentor J Robert Oppenheimer during the latter’s security hearings. He also sowed animosity by opposing the nuclear test ban and by enthusiastically supporting US President Ronald Reagan’s “Star Wars” project. Aware of his incredible talent for causing acrimony, Teller, a lover of irony, rather enjoyed the fact that Tuve once saw him as “the paragon of the uncontroversial figure”.

So what happened? How is it that Teller became the physicist so many people loved to hate? He was, clearly, an enigma, and that is what makes him interesting. On the one hand, he was a devoted husband, a generous friend and an inspired teacher. On the other, he was intoxicated by power and ruthless in his pursuit of it. His judgement was occasionally superb, but often bizarre. Instances of integrity were overshadowed by moments of deceit.

Istvan Hargittai believes that the Teller enigma can be unravelled by carefully examining the evidence gathered from the latter’s long life. The truth, in other words, is out there, and Hargittai’s book, Judging Edward Teller, represents his best effort at finding it. As an example of diligent archival research, it is a very impressive work. Tiny episodes are reconstructed with evidence collected from far-flung sources and then gathered together into a precise narrative. Hargittai is particularly good at exposing inconsistencies in Teller’s life story, which arose from Teller’s habit of tailoring his recollections to the moment at which they were told and to the audience to which they were delivered. With these convenient lies, Teller constructed his own myths.

Dogged research and methodical organization are certainly admirable qualities in a biographer. But historians are not just evidence gatherers; they also have to process the evidence, using insight to guide the reader toward meaningful conclusions. This is where Hargittai falls short. Too often, rough diamonds of evidence are left uncut because of his failure to expand upon their meaning. What results is a rather dull book – packed with information, but lacking soul.

For example, midway through the book Hargittai relates a watershed moment in Teller’s alienation from Oppenheimer. It occurred in 1942, just after General Leslie Groves took over military direction of the Manhattan Project. According to Teller, at a private meeting in New York, Oppenheimer said “No matter what Groves demands now, we have to co-operate. But the time is coming when we will have to do things differently and resist the military.” Hargittai concludes that Teller “found such an attitude toward their own authorities unacceptable”. Presto – there lies the origin of the betrayal that took place 12 years later. But was this a difference of opinion over the need to respect authority, or was something more fundamental at work?

Hargittai does not say; in fact, he lets the matter rest there. But to understand this incident’s impact on Teller, we need to know what Oppenheimer actually meant. Was he expressing political opposition to those of Groves’ ilk, or was this about something more fundamental – namely his concerns at the way science was becoming the handmaiden of war? If the latter, was Teller unconcerned about becoming a slave to soldiers? Hargittai refuses to provide the interpretation essential to answering these questions and thus to understanding this incident. The answer lies not in the evidence (for there is plenty of that), but in the processing of it. The slow distillation of myriad facts (some of them unconnected) might have led to useful insights. Unfortunately, a similar unwillingness to interpret occurs throughout the book.

It is difficult to understand Hargittai’s reluctance to engage with his material, given that he clearly has great enthusiasm for his subject (whom he actually met). In his preface, he remarks on how similar his background is to that of Teller. He, like Teller, is a scientist, being a professor of chemistry at the Budapest University of Technology and Economics. He is also Hungarian, Jewish, the son of a lawyer and a man whose family suffered terribly in the Holocaust – all characteristics shared with Teller. Hargittai feels that “with my background, I might have some advantage in understanding Teller’s character and attitude and the conditions under which he grew up”.

That seems an entirely reasonable claim. Unfortunately, Hargittai appears reluctant to use that understanding. As a result, his narrative seldom strays beyond that which can be empirically proven from the evidence. It reads like a cold scientific report based on observable data. To a scientist, this may sound like a good thing, but history is not a science. In history, understanding arises from a combination of evidence and intuition. If the latter is lacking, the former does not reveal much.

Thanks to Hargittai’s research, we know a great deal more about Teller than we knew previously. But it is mostly just raw data. An understanding of Teller’s motives during the great controversies of his life remains elusive. As a result, we are nowhere nearer getting to grips with the man. Of particular regret is the way Hargittai refers repeatedly to the softer side of Teller, which is supposedly revealed in his letters to his lifelong soulmate, the physicist Maria Goeppert Mayer. These letters apparently show a deeply insecure man who craved approval, yet they are only briefly quoted, and never in a way that sheds light on the complexity of Teller’s character.

Hargittai concludes that there were probably two Tellers, and maybe more. That, however, seems a cop-out – an inability to explain conflicting characteristics in just one man. The title of the book, Judging Edward Teller, reveals its limitations. Judging an individual is relatively easy. Understanding him is much more difficult. After reading this book, I still do not understand Teller.


Attention, early-career physicists

By Margaret Harris

Do we have too many PhD students? Should we be training them differently? What can we do to improve prospects for early-career researchers? Should the government get involved, or is this something the scientific community should handle on its own?

These were just some of the questions debated on Tuesday evening at London’s Royal Institution, where a crowd of about 50 gathered to air concerns about scientific careers before a panel that included UK science minister David Willetts and the Cambridge physicist Athene Donald. Organized by the pressure group Science is Vital, whose founder Jenny Rohn also appeared on the panel, the event aimed to move beyond the perennial debate about science funding to highlight other problems in science careers.

Panel moderator Evan Harris – himself a former MP and one-time science spokesman for the Liberal Democrats – began by asking everyone to “concentrate on the negative”, and audience members obliged. Short-term contracts for postdocs make career planning hard and family life impossible, said one. The constant need to get recommendations for the next short-term job discourages us from reporting bullying, added another. Janet Metcalfe of the career-development group Vitae argued that there is “not enough honesty” when senior scientists discuss job prospects with junior colleagues. One audience member even compared the current system – in which many PhD students and postdocs chase a tiny number of permanent jobs – to a pyramid scheme.

Some partial solutions did crop up in the discussion, including the idea of creating permanent “senior postdoc” roles for researchers who want to remain in science, but don’t want to manage a group. The existence of such roles would prevent some talented, well-trained people from leaving science, Rohn observed. However, she also suggested that senior academics had little incentive to make it happen, because PhD students did the same work and were much cheaper. “There is an inherent exploitation element to science careers,” she concluded.

(more…)

New technique narrows electron dipole moment

Measuring a fundamental property that the Standard Model of particle physics says should be zero might seem like the ultimate waste of time. But if the electron does have a non-zero electric dipole moment (EDM), it would have profound implications and point to new physics. Now, Jony Hudson and colleagues at Imperial College London have made the most precise measurement of the EDM yet, reducing its known upper limit by about 50% – and providing more evidence that it is either zero or extremely small.

The Standard Model, in its simplest form, prohibits the electron from having an EDM because this would violate time-reversal symmetry. While more sophisticated versions of the Standard Model do allow for an EDM, they nevertheless suggest it would be much too small to measure in the lab. Although Hudson’s team has only been able to put an upper limit on the EDM, it claims the new technique could be refined to search for an EDM 100 times smaller still.

Polarized molecules

In their method, the researchers studied the outer (or valence) electrons in ytterbium monofluoride (YbF) molecules. The molecules are exposed to an electric field, which polarizes the molecules. This polarization creates a very large local electric field in the vicinity of the valence electrons. If the electrons have an EDM, then they too would be polarized by this large local field.

But instead of seeking to measure a tiny EDM directly, Hudson and colleagues tried instead to measure the effect that the polarization would have on the electron energy states of the molecules. They began with a pulse of ultracold molecules that had been set into a superposition of two quantum states. The molecules were passed between two parallel plates where electric and magnetic fields can be applied. The molecules are then detected as they emerge from the plates.

In the presence of just a magnetic field, the relative phase of the two quantum states is rotated. Varying the strength of the magnetic field causes quantum interference between the two states and the result is a series of interference fringes at the detector.

Switching the electric field on should only affect this interference pattern if the electron has an EDM because this would introduce a separate phase rotation. To test for this, the team looked for changes in the interference pattern that were correlated to changes in the applied electric field. This was done for 25 million pulses of YbF and found no evidence of a phase shift related to an EDM.

Less than a hair’s width

This allowed the team to place an upper limit on the EDM of 10.5 × 10–28 e cm with 90% confidence. According to the researchers, this means that if the electron were magnified to the size of the solar system, its EDM would be no bigger than the width of a human hair.

This is about 50% better than previous measurements using thallium atoms and the team believes that it could soon improve the result by as much as a factor of 100. The researchers are currently trying to cool the YbF molecules to even lower temperatures and gain better control of the pulses as they pass through the experiment.

The research is reported in Nature 473 493.

Astronomers put a new spin on the age of stars

Like some people, stars can be secretive about their age. But now, a team of astronomers has taken an important first step towards developing a new method to determine the age of a star – by measuring its rotation. “A star’s rotation slows down steadily with time, like a top spinning on a table, and can be used as a clock to determine its age,” says astronomer Søren Meibom of the Harvard-Smithsonian Center for Astrophysics. Meibom presented his findings at the 218th meeting of the American Astronomical Society, currently being held in Boston, Massachusetts.

Tell-tale spots

Being able to accurately determine the age of a star is essential in astronomy. It is particularly relevant for stars orbited by extrasolar planets. Meibom and his colleagues are working on a way to deduce the age of a star using information about its rotation, or “spin”, by establishing a correlation between three parameters – the spin period, age and mass of the star. “Ultimately, we need to know the ages of the stars and their planets to assess whether alien life might have evolved on these distant worlds,” says Meibom. “The older the planet, the more time life has had to get started. Since stars and planets form together at the same time, if we know a star’s age, we know the age of its planets too.”

The ages of stars that lie within star clusters are easy to determine, as most of the stars are formed at the same time. Astronomers plot the colours and magnitude of the stars and the pattern they see can be used to tell the cluster’s age. But most stars known to have planets are not part of a cluster, just like our own Sun, and determining their age is much more difficult.

Using NASA’s Kepler space telescope as part of the “Kepler Cluster Study”, Meibom and his collaborators measured the rotation rates for stars in a one billion year old cluster called NGC 6811. The rotation is detected by looking for tiny changes in the brightness of the star caused by “spots” on its surface rotating in and out Kepler’s sight. Kepler is designed to detect small changes in brightness and therefore able to measure the spin of a variety of stars, including older stars, which rotate slowly and have fewer and smaller spots.

Calibrating clocks

The rotation periods measured for stars in NGC 6811 represent an important step towards establishing a relationship between stellar rotation and age. When this is established, measuring the rotation period of any star can be used to derive its age – a technique referred to as “gyrochronology”. It uses a rotating star as a clock, and calibrates this clock using stars in clusters with known ages. Once the clock is calibrated it works as a celestial time keeper.

To find the age–rotation relationship for stars in the NGC 6811 cluster, Meibom and his colleagues spent four years carefully sorting out stars in the cluster from unrelated stars that appeared to be in the same direction. This preparatory work was done using a specially designed spectrograph “Hectochelle” mounted on the MMT telescope on Mount Hopkins in southern Arizona. The spectrograph can observe 240 stars at the same time, allowing the researchers to observe nearly 7000 stars over four years. Once the actual cluster stars were known, the team used Kepler data to determine their spins.

The astronomers found rotation periods ranging from 1 to 11 days, as compared with the 28-day rotation period of the Sun. Their results saw a strong relationship between stellar colour (a proxy for stellar mass) and rotation period, with little scatter. This suggests that the spin–age relationship can be established for stars over a range of masses – not only for stars like our Sun.

So the next step for the team is to measure the rotation periods for stars of different masses in even older star clusters with known ages to ensure that this “clock” is accurately calibrated to older ages. Those measurements will be more challenging because of the smaller and fewer spots on older stars, meaning that the brightness changes will be even smaller and more infrequent (see figure above).

“This work is a leap in our understanding of how stars like our Sun work. It also may have an important impact on our understanding of planets found outside our solar system,” said Meibom.

The work is detailed in Astrophysical Journal Letters 733 L9.

Copyright © 2026 by IOP Publishing Ltd and individual contributors