Once a physicist: Conrad C Lautenbacher Jr


What sparked your interest in physics?

I have always been fascinated with science, and when I was 12 or 13, I was fortunate to have teachers who encouraged this interest. My father also had an aptitude for science and mathematics; he was a naturally intelligent individual who left high school before graduating and became a dental technician because his family needed him to work — this was during the Great Depression. So I believe this interest is in my genes.

What led you to join the Navy?

I grew up in Philadelphia, and one of my teachers who had a son at the Naval Academy would read letters from him to the class. These letters fascinated me — they were full of adventure and excitement, with descriptions of places I had never seen. By the time I joined the Navy in 1960, students at the Naval Academy were allowed to choose a major subject, rather than focusing solely on a military and engineering curriculum, so I took every course I could in mathematics and physics. I graduated with a double major in both subjects in 1964, and then went to sea for four months on an aircraft carrier before beginning a programme leading to a PhD in applied mathematics at Harvard University.

How did you get into oceanography?

My Navy and science interests came together in the subject of fluid mechanics and I enrolled in a number of graduate-level courses in the subject. My PhD involved building tsunami models, which is an oceanographic application of this topic. In the late 1960s computers were still fairly primitive, so my model of how tsunamis run up onto islands used an IBM 7094, which required punch cards and had a memory that was probably smaller than your watch has today.

What are you working on now?

I spent many years in the Navy learning how to lead and manage large-scale operations, and I have just finished an eight-year spell as administrator of the US National Oceanic and Atmospheric Administration (NOAA), which has one of the largest research infrastructures of any single agency in the world — it even has people living at the South Pole recording atmospheric composition and investigating ozone-hole physics. Now I am working for the Computer Sciences Corporation and a subsidiary company, Antarctic Research Support, which is bidding for the next contract to support the US National Science Foundation’s work in Antarctica. Operating in Antarctica requires more than just scientists researching neutrino detection and ice-sheet mechanics — it also requires a unique and specialized support system. Antarctica has perhaps the harshest environment in the world and supply lines that stretch more than a third of the way around the Earth. Meeting the needs of daily living is an enormous challenge.

What are your views on climate change?

Whatever we do about climate change, we need to base it on sound science, which means investing in improved observing systems and obtaining climate-level data. As head of NOAA, I spent a lot of time organizing an international consortium to build a Global Earth Observation System of Systems (GEOSS) — including satellites and atmospheric-, ground- and ocean-measurement systems — so that, among other things, we can improve our understanding of climate dynamics. The models today are much better than the ones that existed a decade ago, but they are still not accurate enough to project very far into the future, and certainly not for 100 years from now. We know that the Earth has been warming, and we know that there are effects that, if extended, will cause ­significant problems. So we know enough to do something, but in my view the choice of what to do is a political question. As a scientist, I try to stay out of those kinds of debates.

What is your advice for physicists who want to tackle environmental problems?

First, work in a field associated with geosciences. For the future of the human species, we need more people who are interested in Earth sciences. The second thing is to think big. If we are going to solve the climate problem, or build a sustainable society, we need breakthrough scientific work. We have maybe a couple of generations to resolve these issues. I do not want to be negative — I am a glass-half-full person — but I do want to support the need for nations to invest more in Earth sciences and environmental education for the public. I reorganized NOAA in a way that aligned agency offices to mirror the relationships that exist among the Earth’s natural systems. It is counterproductive to isolate scientific disciplines such as meteorology, biology, geological surveying and so on — they are naturally connected by Earth systems’ dynamics. Earth scientists of all disciplines must talk to each other and break down the barriers of jargon and culture.

How do you feel your physics training has helped in your career?

Many people do not understand that physics is an important practical subject. Today’s world is highly technical. We cannot exist without the benefits of scientific discoveries — they are commonplace and everywhere around us. Physics has helped me in the same way that it helps everyone — the art of daily living requires both an appreciation and an understanding of scientific and physical processes. All of us must realize that the future of society depends on this technical world being supported properly, and also improved rapidly to reach the goal of a sustainable future for the human species.

Religion explained

When Physics World carried out a readers’ survey to mark its 20th anniversary in October 2008, in the main the editors took a light-hearted approach. They asked readers to answer nine multiple-choice questions on matters such as who inspired them to do physics, whether they mind being unpopular at parties, and what was the top physics discovery of the previous 20 years. A summary of the results appeared last year on the physicsworld.com blog (22 December 2008).

But one question was more serious: “Which of the following reflects your views on science and religion?” Readers were offered a choice of five answers (see “Readers’ view” at the end). It takes but a glance to see that this question suffers the flaws of other efforts to get hard statistics about “deep issues”. I know I cannot be too critical, given that the editors devised the survey and you (well, 505 readers) responded. Let me just say that the question must have been thought up very close to deadline. But much more revealing than the data were readers’ comments.

The matrix

I found that I could, very roughly, place each of the comments in a 2 x 2 matrix based on how readers conceive of science and religion (see figure). In the upper-left quadrant, I put respondents who regarded science as consisting of (true) beliefs about the world, and religion likewise as a set of beliefs about the world and the existence of a personal God in it. For some respondents in this quadrant, who made up perhaps two-thirds of all respondents, religious beliefs are salutary and have nothing to do with science.

But for others, religious beliefs reflect ignorance and are akin to belief in mermaids and unicorns. “Religion stems from lack of knowledge,” wrote one reader; while another said that religion has a place in human culture just as “Father Christmas and the tooth fairy” do. People in this quadrant tended to view science and religion as inevitably conflicting over issues such as evolution and cosmology.

In this quadrant I would also put respondents who said they were agnostic, viewing religion as consisting of an unproven belief in a personal God. “As a physicist,” one wrote, “I have to accept the possibility of existence of anything that can’t be disproved (yet).” Another: “I am an agnostic…there is insufficient evidence but the probability is very low.” Still another: “Never rule out anything until proved otherwise, however unlikely.” These agnostics regarded belief in a personal God as akin to belief in the Loch Ness Monster, Bigfoot or UFOs. If God is proven to exist, this may call for some behaviour modification — but until then, we are fine as we are.

In the upper-right quadrant, I assigned respondents who viewed science as belief in a set of neutral facts, and religion as an approach or stance towards the world. These people viewed religion as not consisting of beliefs — not even in a “divine administrator” — but about how we live and our principles for leading a better life, as exemplified perhaps by Buddhists, Quakers and Unitarians. Many respondents with this view of religion saw it as posing no threat to science; indeed, several cited “organized religion”, rather than religion per se, as what conflicts with science.

Others in this quadrant saw religious approaches as dangerous, as a social pestilence or plague — “the root of earthly conflicts” — while still others revealed a Marxist-like conception of religion as the opiate of the masses. “Religion has no place in science,” commented one reader, “but in practice it does have a place in human society since the masses need some sort of moral guidance that science can not supply (and shouldn’t).” Religion helps people “to develop a conscience and provides an otherwise absent comfort”, claimed another, and another said that “the masses need religion but scientists should know better”.

In the lower-left quadrant, I put respondents who saw religion as consisting of beliefs, but who saw science not as having to do with beliefs in particular theories or results — these change! — but as an approach to generating beliefs. Scientists cannot avoid inheriting some beliefs about the world, but they probe these beliefs with all available resources, and some ways of probing are better than others. Members of this group often saw science as a progressive worldview as comprehensive as religion, for inquiry is a supreme value, truth is sought in a public and objective process, and no belief is unchallengeable. Those in this quadrant tended to see science as more profound than religion. “Science is my religion,” one person wrote.

The critical point

I would assign myself — and a handful of other respondents — to the lower-right quadrant, viewing both science and religion as consisting more of approaches to the world than of sets of beliefs about it. Humans inherit fragments of knowledge about nature, and scientific inquiry is the response to the feeling that it is worth knowing more. Humans also inherit imperfect patterns of behaviour, and a religious life is the response to the feeling that we can “live better” than we do.

But it is a messy subject, for most adults know that there are better and worse ways of living. Yet in reaction to the perceived excesses and hypocrisies of organized religion, many people name that desire to live better as being “spiritual”, “humanistic” or even “secular humanistic” — reserving the term “religious” for organized schemes to live better that they themselves deem deluded or impractical.

What is fascinating about this question in the Physics World survey are not the statistics but the many different conceptions of science and religion that lie behind them.

Readers’ views

Responses to the question “Which of the following reflects your views on science and religion?”, which appeared in Physics World’s 20th-anniversary survey of October 2008. A total of 505 readers replied.

  • I am an atheist who sees no place at all for religion in the universe — 114 responses (22.6%)
  • I am a non-believer, but I think religion and science can coexist because they each deal with separate aspects of the universe — 153 responses (30.3%)
  • I am a religious person who thinks science and religion can coexist because they each deal with separate aspects of the universe — 81 responses (16.0%)
  • I am a religious person who thinks that science and religion are different ways of looking at the same thing. My faith enhances my appreciation of science — 91 responses (18.0%)
  • Other — 66 responses (13.1%)

The Earth – for physicists

The prospect of human-induced climate change has many people worried. In addition to the sheer scale of the problem, there is also the challenge of it being so complex. The Earth’s behaviour is fiendishly hard to predict in detail. Computer power is not enough: models need to be based on solid physical insights and a good understanding of the Earth’s current behaviour — and also its history.

Luckily, in the past decade we have learned a vast amount about this history. The mists of time are clearing. It seems we are not alone in passing through perilous times. The Earth has witnessed some remarkable disasters. To keep our tale brief, let us focus on four: the “big splat” about 4.55 billion years ago; the “late heavy bombardment” about 4 billion years ago; the “oxygen catastrophe” roughly 2.5 billion years ago; and the “snowball Earth” events about 850 million years ago. The details of these events — and indeed whether they even happened at all — remain controversial. They are, however, widely accepted theories. In every case there is interesting physics involved in testing these theories.

The birth of the Moon
The Sun was probably formed from the gravitational collapse of a cloud of gas and dust. Early models of star formation assumed spherical symmetry, but if you know the joke to which the punchline is “consider a spherical cow”, then you should suspect that this is a dangerous oversimplification. Indeed, angular momentum plays a major role. As such a cloud collapses gravitationally, it should form a spinning “accretion disk”.

When the centre of this disk became dense enough for its pressure to hold it up, our Sun was born as a “protostar”. This phase lasted a scant 100 000 years or so; the temperature then rose to the point where an outflow of hot gas prevented the Sun from accreting any more material. At this point the Sun became what we call a “T Tauri star”, powered only by gravitational energy as it slowly shrank. After about a further 100 million years, it became an ordinary main-sequence star as the hydrogen at its core began to undergo fusion.

Some dust circling the early Sun became hot and melted, and some of the molten droplets later froze into “chondrules” — millimetre-sized spheres of simple minerals such as pyroxene and olivine, which are mostly made of sodium, calcium, magnesium, aluminium, iron, silicon and oxygen. These chondrules are the main constituent of some of the most primitive objects that still ply their way through the solar system: stony meteorites called “chondrites”.

The dust circling the early Sun started forming lumps called “planetesimals”. As these lumps collided, they got bigger and bigger, eventually forming the asteroids and planets we see today. Some lumps melted, letting heavier metals sink to their cores while lighter material stayed on the surface. And some crashed into each other, shattering and forming chondrites and other meteorites such as iron–nickel meteorites and stony meteorites called “achondrites”.

By using radioactive-dating techniques on meteorites, researchers claim a shockingly precise knowledge of when all this happened: sometime between 4.56 and 4.55 billion years ago. So, the Earth was probably formed sometime around then — and our story officially begins at this point.

The Earth’s history is divided into four eons: Hadean, Archean, Proterozoic and Phanerozoic. When I was a child, the “Cambrian era” was as far back as my textbooks went, except for the murky “Precambrian”. But the Cambrian began just 540 million years ago. The Cambrian marks the start of the current eon, the Phanerozoic, meaning “the age of visible life”. This is when multicellular organisms took over the world, leaving fossils we find today. But we will dig much deeper: the Phanerozoic will be end of our story.

Back to the Hadean. As befits its name, this was a time when the Earth was hellishly hot. It began with an event that formed the Moon around 4.53 billion years ago. What made the Moon? The most popular current explanation is the “giant-impact theory” — sometimes called the “big splat” theory.

The idea is that another planet formed at one of the Lagrange points of Earth’s orbit. In 1772 Joseph Louis Lagrange showed that if you have a planet in a circular orbit about the Sun, then a much lighter body will stably orbit the Sun at the same distance if it lies 60° ahead or behind that planet. There are indeed many asteroids located near the Lagrange points of Jupiter, and also some at the Lagrange points of Mars and Neptune. No asteroids have been found at Earth’s Lagrange points. But according to the giant-impact theory, a planet did form at one of these points. When it attained a mass of about that of Mars, it would no longer have been stable at this location. It would have gradually drifted toward the Earth, and eventually smacked right into it! This collision could have formed the Moon.

It is a dramatic theory, but there is a strong case for it, nicely summarized by science writer Dana Mackenzie’s recent book The Big Splat, Or How Our Moon Came to Be. For example, tidal friction is making the Moon gradually recede from the Earth. We know it is now moving away at a rate of about 3.8 cm per year. Ancient sediments record the tides and show that months have been getting longer at least since Precambrian times. Extrapolating backwards we find that in the Hadean eon the Moon was very close to the Earth. Could it have been flung off from the Earth by centrifugal force, or formed near the Earth in the first place, or captured by the Earth’s gravitational field? All these theories must be considered, but the giant-impact theory seems to fit the data best. People take it so seriously that the hypothetical doomed planet that hit Earth even has a name: Theia. In Greek mythology, Theia was a female titan who gave birth to the Moon.

In 2004 the astrophysicist Robin Canup of the Southwest Research Institute in Boulder, Colorado, published some remarkable computer simulations of the big splat. To get a moon like ours to form — instead of one that is too rich in iron, or too small, or wrong in other respects — you need to choose the right initial conditions. Canup found it best to assume that Theia is slightly more massive than Mars: between 10% and 15% of the Earth’s mass. It should also start out moving slowly towards the Earth, and strike the Earth at a glancing angle.

The result is a very bad day. Theia hits the Earth and shears off a large chunk, forming a trail of shattered, molten or vaporized rock that arcs off into space. Within an hour, half the Earth’s surface is red hot, and the trail of debris stretches almost four Earth radii into space. After three to five hours, the iron core of Theia and most of the debris comes crashing down. The Earth’s entire crust and outer mantle melts. At this point, a quarter of Theia has actually vaporized.

After a day, the material that has not fallen back down has formed a ring of debris orbiting the Earth. But such a ring would not be stable: within a century, it would have collect to form the Moon we know and love. Meanwhile, Theia’s iron core would have sunk to the centre of the Earth.

The giant-impact theory is still much debated, in part because there is little direct evidence left: the oldest known rocks on Earth were formed almost half a billion years later.

The late heavy bombardment
The Archean eon begins with the formation of the first rocks that survive to this day. This happened about 4 billion years ago. Many igneous rocks, in particular basalt, must have been formed before this. In fact, the oceans may have started forming 4.2 billion years ago. But we do not see any traces of this early geology. One possible reason is that the beginning of the Archean eon was not a peaceful time.

After the Moon was formed, the Earth continued to suffer many impacts. Curiously, instead of their frequency gradually dropping off over time, it may have spiked during a period called the late heavy bombardment, which occurred some 4 to 3.8 billion years ago. A lot of large craters on the Moon date back to this period, so probably the Earth got hit too — but here, such old craters would be lost to weathering and geological activity. So, the Moon is our guide.

During the late heavy bombardment, the Moon was hit by 1700 meteors that made craters that are more than 100 km across. The Earth could easily have received 10 times as many impacts of this size, with some being much larger. To get a sense of the intensity of this pummelling, recall the meteor impact that may have killed off the dinosaurs at the end of the Cretaceous period 65 million years ago. This left a crater 180 km across. Impacts of this size would have been routine during the late heavy bombardment.

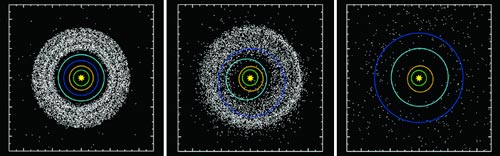
Why was this era so violent? One theory is that at around this time Jupiter and Saturn moved into a 2:1 orbital resonance (when Jupiter completes two orbits at the same time as Saturn completes just one), thereby causing a big disruption in the original population of asteroids and icy objects orbiting the Sun. In 2005 an international collaboration of planetary physicists, including Hal Levison from Southwest Research Institute — one of the people who pushed the idea that Pluto is a “dwarf planet” — published a paper about some fascinating computer simulations of the solar system (Nature 435 466). As initial conditions, they take all four gas giants to lie in circular orbits more closely spaced than they are now. By interacting with planetesimals, Saturn, Uranus and Neptune gradually migrate outwards. When Saturn reaches the point where it orbits the Sun once for every two orbits of Jupiter, the whole outer solar system destabilizes. The orbits of Neptune and Uranus become more eccentric and they throw many planetesimals out of their original orbits. Some are hurled into the inner solar system, which would explain the late heavy bombardment.

The oxygen catastrophe
It is believed that the Earth’s surface cooled enough to form a crust even before the late heavy bombardment. Meanwhile, volcanic activity would have released lots of steam, carbon dioxide and ammonia. This formed what is called the Earth’s “second atmosphere”. The Earth’s “first atmosphere”, mainly hydrogen and helium, was already lost to space. The second atmosphere was mainly carbon dioxide and water vapour, with some nitrogen but probably not much oxygen. This second atmosphere had about 100 times as much gas as today’s “third atmosphere”.

As the Earth cooled, oceans formed. They may have boiled away completely during some large impacts but then reformed. Eventually much of the carbon dioxide in the atmosphere dissolved into the seawater. This later precipitated out as carbonates, thus starting a new phase in what the geologist Robert Hazen of the Carnegie Institution of Washington’s Geophysical Laboratory and his co-workers call “mineral evolution”. This is not evolution in the Darwinian sense, just the gradual diversification of minerals over the Earth’s history. In 2008 a team of geologists led by Hazen estimated that 350 kinds of mineral could be found on Earth during the Hadean eon. But as the Earth’s history proceeds, their count keeps rising. By the end of the Archean eon it reaches 1500, thanks in part to the formation of oceans – but also thanks to the rise of plate tectonics.

The first step in plate tectonics was the formation of “cratons”: ancient, tightly knit pieces of the Earth’s crust and mantle, dozens of which survive today. For example, in the UK, south-eastern Wales and part of western England lie in the Midlands craton. While most cratons only finished forming 2.7 billion years ago, nearly all started growing earlier. Cratons are made largely of igneous rocks like granite, which are more sophisticated than basalt. Granite is formed in a variety of ways, for example by the remelting of sedimentary rock. Early granite-like rocks were probably simpler.

Cratons fit together to form the larger plates that constitute the Earth’s crust today. Indeed, plate tectonics as we know it started about three billion years ago. A key aspect of this process is the recycling of the Earth’s crust through “subduction”: oceanic plates slide under continental plates and get pushed down into the mantle. Another feature is underwater volcanism, leading to hydrothermal vents — fissures in the seafloor that spew out hot water.

It is possible that these vents played a role in the most dramatic of all Archean developments: the origin of life. Since the early Earth lacked free oxygen, the first life must have been anaerobic. Even today, many of the oldest known microbes, such as those found in hydrothermal vents, cannot tolerate the presence of oxygen. Such organisms gave rise to an active sulphur cycle and deposits of sulphate ores starting about 3.6 billion years ago. Later they made the atmosphere increasingly rich in methane.

At some point, microbes started photosynthesizing and putting oxygen into the atmosphere. It seems likely that the first plants acquired their ability to photosynthesize by symbiosis with such microbes. Indeed, the chloroplasts in plants have their own separate DNA.

It is not clear when photosynthesis began — estimates range between 3.5 and 2.6 billion years ago. One possible clue — rocks called “banded iron formations” that are made of thin layers of iron oxides alternating with iron-poor rock — started to appear at about this time. They may have formed when oxygen from the first photosynthesizing organisms reacted with iron in seawater. No-one knows for sure why the periods of iron-rich sediment come and go.

It took a long time for photosynthesis to have a significant effect on the Earth’s atmosphere — but when they did, roughly 2.5 billion years ago, the result was dramatic. After all, oxygen is highly reactive in its gaseous form, and most early life could not tolerate it. So, this episode in the Earth’s history has been dubbed the oxygen catastrophe. Luckily, evolution found a way out: now many species need oxygen.

The oxygen catastrophe marks the end of the Archean eon and the beginning of a new eon, the Proterozoic. The next billion years were dominated by something called the “intermediate ocean”: the seawater contained a lot more oxygen than before, but still much less than today.

Snowball Earth
Starting about 850 million years ago, something dramatic happened: episodes of runaway glaciation during which most or all the Earth was covered with ice. Advocates of the extreme version of this scenario call them “snowball Earth” events, while others argue for a mere “slushball”. Since ice reflects sunlight, making the Earth even colder, it is easy to guess how such runaway feedback might happen. The opposite sort of feedback is happening now, as melting ice makes the Earth darker and thus even warmer. The interesting questions are why this instability does not keep driving the Earth to extreme temperatures one way or another, why the snowball-Earth events started when they did, and why the Earth did not stay frozen.

Here is a currently popular answer to the last question. Ice sheets slow down the weathering of rock. This weathering is one of the main long-term processes that use up atmospheric carbon dioxide, by converting it into various carbonate minerals. On the other hand, even on an ice-covered Earth, volcanic activity would keep putting carbon dioxide into the atmosphere. So, eventually carbon dioxide would build up and the greenhouse effect would warm things up again. When the ice melted, weathering would increase and the amount of carbon dioxide in the atmosphere would drop again. However, this feedback loop is very slow. Indeed, it has been suggested that in the hot phase, as much as 13% of the atmosphere could be carbon dioxide — some 350 times more than we see today!

By the end of these glacial cycles, it is believed that oxygen had increased from 2% of the atmosphere to 15%. (Now it is 21%.) This may be why multicelled oxygen-breathing organisms date back to this time. Others argue that the “freeze–fry” cycle imposed tremendous evolutionary pressure on life and led to the rise of multicellular organisms. Both these theories could be correct. (For more details, try Gabrielle Walker’s excellent book Snowball Earth.)

The rise of multicellular organisms marks the end of the Proterozoic eon and the start of the current eon: the Phanerozoic. This is the end of our story — but of course the history of the Earth does not end here.

We are now in the Cenozoic era of the Phanerozoic eon. The Holocene era has just ended and the Anthropocene has begun, characterized by significant human impact on ecosystems and climate. By demolishing natural habitats, humans have set in motion a mass-extinction event that may rank with the end of the Cretaceous period 65 million years ago. We are also boosting atmospheric carbon-dioxide levels at an incredible rate. If the temperature rises by one more degree, then the Earth’s temperature will be the hottest it has been in 1.35 million years, before the current cycle of ice ages began. Where are we heading? Nobody knows.

However, studying the history of the Earth will put us in a better position to guess. We cannot run experiments to test the Earth’s response to different levels of greenhouse gases. Computer models are essential, but evidence from snowball Earth and other incidents in the Earth’s past are crucial checks on these models. Similarly, studying past mass-extinction events, and the Earth’s recovery from them, may provide clues about the future of biodiversity on this planet.


Threats to ultra-high-field MRI

In 2004 the European Commission (EC) adopted a directive restricting occupational exposure to electromagnetic fields. This directive (2004/40/CE), which examines the possible health risks of the electromagnetic fields from mobile phones, Wi-Fi, Bluetooth and other devices, concluded that upper limits on radiation and applied electromagnetic fields are necessary to prevent workers from suffering any undue acute health effects. But although not initially intended, the biggest impact of the directive could be on magnetic resonance imaging (MRI), which is used in hospitals worldwide to produce images of unrivalled quality of the brain and other soft tissues.

MRI involves studying how hydrogen nuclei in water molecules respond to an applied static magnetic field. When placed in a sufficiently strong field, the hydrogen nuclei absorb energy from an applied electromagnetic radio-frequency (RF) field and re-emit it in a way that reveals information about the physical and chemical properties of the tissue’s environment in the body. MRI is a powerful diagnosis tool that is much safer than techniques that use X-rays or other ionizing radiation.

A typical MRI scanner has three main components: a magnet producing a static field of typically 1–3 T; an RF-field generator with antennas or coils; and a smaller electromagnet that is switched on and off rapidly to localize the hydrogen nuclei and allow an image to be obtained. When an MRI scan is being performed in a hospital, most of the relevant staff leave the room. However, the main magnet, which is made of superconducting materials, is always on and there are a number of instances, for example when a patient is being placed in the scanner or anaesthetized, where staff members need to be present in the field. Engineers are also exposed to the main magnet’s field whenever a scanner is being installed or serviced.

Stalling progress
The problem with the exposure limits that are outlined in the directive is that they follow the recommendations of the International Commission on Non-Ionizing Radiation Protection (ICNIRP) — a non-governmental organization officially recognized by the World Health Organization — based on a precautionary approach to very limited data, most of which are not relevant to MRI. Those limits could end up preventing the technique from being used — just when European scientists are starting to lead the world in ultra-high-field (UHF) MRI magnet research. The initially proposed limits will immediately put the brakes on progress and, moreover, be a big blow to companies that make MRI scanners and magnets, such as Siemens, Philips, Bruker and Magnex. These firms could end up being unable to meet the growing global demand for clinical UHF MRI scanners, the high fields from which could boost the potential of MRI for healthcare and biomedical sciences, particularly for neurological applications.

Investigations conducted by the EC and the UK government concluded that MRI workers routinely exceed the exposure limits in the directive — despite no evidence that they experience any ill effects as a result. This fact led the EC to postpone until April 2012 the implementation in member states of the directive, which had been due to come into effect on 30 April 2008 — the idea being to allow a satisfactory solution to be found. However, in April of this year the ICNIRP published yet another report — this time setting guidelines for static magnetic fields. (The initial guidelines set by the ICNIRP addressed only time-varying electromagnetic fields of up to 300 GHz.) If included in the directive, the new guidelines would have an even greater impact on the development of MRI technology in Europe.

While I applaud the ICNIRP for putting together an outstanding review of the literature on the known or reported effects of magnetic fields in biological tissues or organisms, it should be pointed out that regulations based on current (and necessarily limited) literature might potentially prevent any progress in MRI. The problem is that the proposed guidelines state that only a worker’s limbs can be exposed to fields between 2 T and 8 T. But because the magnets that produce such fields are so much bigger than the distance between the limbs, the trunk and the head, it is difficult — if not impossible — to expose a patient’s limbs to such a field without exposing their trunk and head too. The upshot is that it will no longer be possible to build, test, validate, maintain and use biomedical magnets above 2 T in Europe.

Although the report says that exposing the head and the trunk to 2–8 T fields might be “justified for some specific work applications when the environment is controlled and appropriate work practices are implemented”, this possibility remains to be clarified within the directive. Exposure to magnetic flux densities above 8 T is not even considered, as the report says that “not enough information is available on which to base exposure limits beyond 8 T”.

There is, however, a growing worldwide demand for clinical MRI scanners operating above 3 T. These high fields can be used to image the brain, anatomically and functionally, with unsurpassed spatial and temporal resolution to detect, for example, the onset of Alzheimer’s disease. MRI with ultra-high fields also makes it possible to image molecules other than water, such as important ions, metabolites and neurotransmitters, or tracers specially designed to reveal molecular or cellular disorders.

Indeed, there are currently well over a thousand 3 T MRI scanners and more than 30 7 T clinical MRI systems in use — or about to be installed — around the world, more than half of which are in Europe. Two 9.4 T human MRI scanners are already operating in Germany, while France will soon install a 11.7 T clinical MRI system. UHF systems for biomedical research on animals are even more common, some of which have fields of over 16 T. Yet there have been no published reports of these scanners having any adverse affect on workers at those sites.

It seems that the new ICNIRP report focuses on 2 T and 8 T because reliable literature is available only up to these field strengths, and not at higher strengths. However, these upper values must not be mistakenly understood by lawmakers as real critical thresholds, but rather technical limits at a given time, thus leaving room for progress. Furthermore, the report acknowledges that “guidance is not based on time-averaged exposure because, in addition to the experience gained with the use of MRI and other static field sources world-wide over the last 20 years, mechanistic considerations indicate that any effects are likely to be acute”.

Political challenges
Although patients undergoing MRI scans are not affected by the directive, they are nonetheless also exposed to the same field strengths (or even slightly higher as they are at the centre of the magnets). The ICNIRP report points out that the exposure limits for the general public should be derived by applying a reduction of five with respect to the occupational limit, which corresponds to 0.4 T. Guidelines for patients are still in preparation.

The situation is much better in the US, where the Food and Drug Administration (FDA), which considers MRI to be a “minimal risk” procedure up to 8 T, has continuously extended its recommended limits for subject exposure over the last few years from 2 T to 4 T, and now to 8 T for anyone aged one month or older. UHF MRI can still be used on human subjects beyond this limit — indeed there are two 9.4 T MRI clinical scanners in the US with a 11.7 T system about to be installed, albeit under the approval of a local Institutional Review Committee.

Indeed, there are no reports in the literature showing that ultra-high fields have any real impact on health. Of course, electromagnetic fields could have fundamental biological effects, but the question is whether those effects can actually harm a person or their organs. So although the EC’s directive should, in principle, be welcomed, as it seeks to promote environmental protection and workers’ health and safety, the problem is that it encompasses very broad aspects of the health concerns associated with electromagnetic fields and was not intended for MRI. As a recent European Parliament resolution points out, “the use of MRI must not be threatened by directive 2004/40/EC as MRI technology is at the cutting edge of research, diagnosis and treatment of life-threatening diseases for patients in Europe”.

UHF MRI is progressing rapidly, especially in Europe — there are already sites with MRI magnets operating above 8 T, with more to come. The fact that no reports of adverse effects have been published, so far, is reassuring, but caution must, of course, be exercised when exposing people, patients or workers to ultra-high fields. The challenge for politicians and the EC over the next two years is to create regulations that are flexible enough to not only protect workers, but also allow research in the field to progress. They need to work with patient groups, healthcare professionals, trade unions, industrial MRI manufacturers and biomedical research institutions. The European Union and its member states must carry out and fund, without delay, biological and epidemiological studies on the effects of ultra-high fields on tissues and organisms. Meanwhile, in the absence of available data, we should permit tests that expose people to static fields higher than 8 T — provided that appropriate precautionary measures are taken — and ensure that these limits can be extended if current or future studies suggest it is safe to do so.

Web life: Planet SciCast

So what is the site about?
Planet SciCast is an online repository for short films about science — a bit like a science-specific, moderated version of YouTube. As of July 2009, the site hosts over 150 films on topics ranging from CERN’s Large Hadron Collider to fun things to do with treacle. New content appears on the site every few weeks, and some films include links to information about related experiments, demos and activities. The site also runs an annual competition aimed at getting more people involved in making science films, with prizes in categories like “best original score” and “best presenter”.

Can you describe a typical film?
The majority of the bite-sized movies — the maximum length is two and a half minutes — come from children and young students. Accordingly, most feature experiments that are easy to do in a classroom with common lab equipment or a few inexpensive household items. Some, like a demonstration of alkali-metal reactivity, are old stand-bys of chemistry and physics lessons. Others show an amazing degree of creativity in both their choice of topic and their presentation: a film about lasers, for example, opens with its teenage cast re-enacting a scene from the James Bond film Goldfinger before moving on to explanatory diagrams and animations.

Does this mean it is just for children?
Not at all. The site encourages contributions from parents, teachers, science communicators and researchers. Indeed, anyone with a video camera and an interest in science education is welcome to send in material, although the prize competition is only open to amateur film-makers from the UK and Ireland. Despite this limitation, competition for the 2009 best film prize in the “adults” category was fierce. The winning entry came from Andrew Hanson, a senior research scientist at the UK’s National Physical Laboratory, whose animated romp through relativity beat a tutorial on levitation, a 1950s-themed explanation of baking powder, and a film on oil and water called, er, The Immiscible Love Story.

Can you give me some highlights?
One thing that the site proves is that sometimes even extremely simple ideas can make great films. A perfect example of this is The Bernoulli Waltz, which pairs table-tennis balls suspended on a column of air with Johann Strauss’ “Blue Danube” waltz in a wordless tribute to the opening sequence of the film 2001: A Space Odyssey. Other films rely on clever word play — particularly The Geiger Müller Groove (showcasing a catchy rap about alpha, beta and gamma radiation), which won “best physics film” in 2009. Be sure to check out The Formation of Crude Oil, which illustrates the required elements — dead sea creatures, lack of oxygen, pressure and heat — in a way that is simultaneously informative, amusing and rather disturbing to lovers of stuffed toys.

How can I get involved?
In some ways, you already are: the Institute of Physics (which publishes Physics World) is one of the site’s supporters, as it sponsors both a regional competition and the SciCast Physics award. The next competition deadline is not until the end of March 2010, so there is plenty of time to brainstorm ideas for your own science film. Instructions for submitting material are available on the site, but currently you cannot submit films online.

RGA User Group offers broad appeal

The RGA User Group was originally formed to coordinate informal meetings for users and manufacturers of residual gas analysers (RGAs) to help them better understand each others needs and hence derive potential benefits. The first meeting of the group took place in 1996 in Rugby and comprised just 11 attendees. Since then the group has organized meetings approximately every 18 months. Attendance has grown steadily, culminating in the last meeting, held in March 2008 at the Culham Laboratory in Oxfordshire, which attracted more than 70 participants from industry, manufacturing and academia.

The RGA is an analytical instrument that is widely used throughout the vacuum industry. Its origins are as a diagnostic tool for measuring the partial pressures of the gases present in a vacuum chamber after it has been pumped down. However, advances in electronics and software have meant that the RGA is now revealing its true worth as a mass spectrometer, covering a variety of applications that are far removed from just measuring the quality of the vacuum.

The range of process-vacuum areas where RGAs are employed has widened to span everything from semiconductor processing to the extreme high vacuum (XHV) requirements of the latest generation of particle accelerators. The biggest benefit for users is that this range of applications has resulted in a significant market for RGAs that is filled by many different manufacturers, with the outcome that there is lots of product choice and such instruments can now be purchased at relatively low cost.

To the uninitiated, one RGA may look very much like another, but not all are the same, and this is where the group can help to enlighten users about the optimum set-ups for different vacuum processes and applications. Having an informed understanding of such intricacies is seen as a growing necessity for a large number of users, and the RGA User Group strives to address this need by providing opportunities for users, both new and old, to share their practical experiences of the instrumentation.

The user group has grown from humble beginnings to provide an established forum for the exchange of information and practical advice. It organizes workshop-style meetings with the aim of bringing industrial, academic and research-based RGA users together with equipment suppliers and manufacturers. These events are normally held at the laboratories of large UK government-research facilities. The events are free to all attendees, thanks to support from the companies attending the small exhibitions run in conjunction with the one-day meetings. The group also receives financial support from the Institute’s Vacuum Group and ASTeC, the UK’s centre of expertise for accelerator science and technology.

A typical meeting consists of eight or nine short presentations by experts from academia and industry that might cover everything from the practical aspects of using and servicing instrumentation to the latest advances in equipment miniaturization. The schedule offers attendees lots of time for networking with other users and with manufacturers, which helps to facilitate collaboration and the transfer of ideas. The meeting is usually rounded off with a tour of the facilities where the event is being held. An archive of presentations from meetings, together with other RGA User Group information, is available at rgausers.org.

The group is currently making plans for its next meeting, RGA-9, which will take place early next year. This will be another milestone in the evolution of the RGA User Group because it will form part of what it is hoped will be the first in a series of new vacuum events for the UK. Vacuum Symposium UK aims to address the needs of the vacuum community with an annual event incorporating both technical and commercial elements.

The 1st Vacuum Symposium UK (VS-1) will take place on 10–11 February 2010 at the Daresbury Laboratory in Cheshire. The meeting will be free to participants and the event will run over two days, with the RGA-9 programme forming day one and a complementary VS-1 programme running on day two. The event will include free training seminars for new vacuum users, technical talks for more-experienced attendees and a vacuum-equipment exhibition. It is hoped that the event will attract interest from across the entire UK vacuum industry and beyond. So, if you are a user of vacuum equipment, have an interest in vacuum science and technology or are a supplier/manufacturer of vacuum equipment, then this meeting is for you. Full details and registration options are available at vacuum-uk.org.

Just as RGAs offer broad appeal, so the RGA User Group looks to do the same.

Scientists in the newsroom

Have you ever squirmed when reading coverage of science news in the media? Rolled your eyes when you saw a headline summing up a sophisticated science result in one line? Do you ever come to the conclusion that some complex subject matter has been condensed to the point where it may collapse in on itself, forming a mini black hole that will trap the real scientific understanding forever? And most importantly, have you ever asked why things might be like this, and what you could do about it?

I had the chance to find out in 2005, when I was awarded a media fellowship from what is now known as the British Science Association. These fellowships were set up about 20 years ago with the aim of introducing career scientists and engineers to the way that the media work. The core of the fellowship is the opportunity to work as a science journalist in the national press, broadcast or Internet media for three to eight weeks. In my case, I spent a month working for the Times Higher Education Supplement in London and another week reporting for them from the British Science Festival. At the time I was in the final year of a PhD in shock and explosives physics at the University of Cambridge, so doing the fellowship meant quite a significant change of scene. However, I wanted to do it because I was curious about the inner workings of news stories, and fascinated by how different parts of society communicate with each other.

Learning the ropes

My time in the newsroom was fun because I was not there to observe, I was there to do. I was trusted with stories to research and people to interview, and I discovered how hard it is to balance your own interest in a subject with the time you have available to report on it. One of the biggest projects I worked on involved analysing academic salary data released under the Freedom of Information Act. That effort turned into a rewarding front-page story, but I learned an extra lesson when a letter arrived complaining about my choice of data displayed with the story. “Why didn’t you include my institution?” asked the letter-writer.

My first reaction was one of amazement: even though it was the week’s top story, I did not think anyone would read my article closely enough to spot that they had been excluded. Note to self: someone out there is paying attention. Then I had to work out how to say, politely, that “I could only fit a limited number of institutions into the space allowed, and I didn’t think yours was important enough to make that list”. If I ever do it again, I will make sure that the listed institutions come from a hierarchy based on published data, so I can give a better answer to that question.

The real benefits of the placement came from just being in the newsroom, hearing how stories are chosen and seeing the near-panic that dominated the hours before the publication was “put to bed”. The biggest single message I absorbed was that it is the editor’s job to produce a publication that will sell. Someone can write an amazingly well-researched and thorough story but if the editor judges that “the reader” is likely to ignore it, it will not go in.

In my experience, science journalists are intelligent people who are genuinely doing their best to convey the excitement and importance of science to people who are not necessarily already convinced. And they really do know a lot about how to get the maximum amount of accurate science into their stories without turning people off. But newspapers and websites are up against a weird kind of democracy: anyone who buys a paper or logs onto a site is free to stop reading at any time. If the first paragraph does not catch the reader’s attention, what comes next could be Pulitzer-prize-winning stuff but no one will ever know.

So if you are ever interviewed by a journalist, bear in mind that they are there to help you get your message out, because (be honest) you could not do it by yourself. What they write is not intended for you; it is intended for your next-door neighbour, who may well think that Wolfgang Pauli was the guy who won the gold medal on the pommel horse at the last Olympics. Science journalism is not perfect, but once you see what motivates it, you can see that there is a lot more that we as scientists can do to improve the message that the public receives about science.

Read all about it

If you are interested in taking on a fellowship, you will need to be adaptable and a good communicator. You will also need to be prepared to learn to do things that you might not be naturally good at. In my case, this included writing about other people’s research without filling the piece with quotes (because I wanted to use the researchers’ own words) and also structuring an article as a journalist would, rather than as a scientist would.

As for the timing of the fellowship, most of the other fellows in my year were postdocs or researchers (both academic and industrial), and I think they probably appreciated the fellowship more than I did because they had a few more years’ experience of how research works. The more established you are, the more you can make use of your know-how; in particular, your peers are more likely to ask your advice if you have built a reputation as someone who is willing to help fellow scientists navigate the media. It also helps to keep in regular contact with friends and journalists whose aims are the same as your own. Moving about a lot (as is common for a few years after finishing a PhD) can make those contacts harder to maintain.

The flip side is that media fellowships take up a significant chunk of fellows’ time — about 10% over the course of a year — and it may be easier to fit this in while studying for a PhD. Either way, you will need a sympathetic employer who is prepared to let you take the time off. If you are concerned about missing that time at work, remember that a month or two off will make no difference when you look back in 10 years’ time, but a month or two spent in someone else’s shoes will be memorable and useful for life.

Since the fellowship ended I have finished my PhD, shifted my research focus (I now apply what I learned about high-speed photography during my PhD to the study of ocean bubbles) and I am on my second postdoc position in my new field. In that time, I have helped other scientists in their interactions with the press and I have also become much better at publicizing science events that I have been involved in, including the science video website SciVee. But the main effect of the fellowship was more a change in how I see the world. I am far more aware that scientists need to take the media seriously, and now that I am settled in the field of ocean science, where communicating research results to the public is essential if we are to stop treating the oceans as though they are infinite, I am looking forward to making use of that new understanding.

The next round of fellowships will be in the summer of 2010, with applications due by March 2010. More details are available online at the British Science Association’s website (www.britishscienceassociation.org), including lots of information about the scheme and reports written by previous fellows about their experiences. Being a media fellow could be one of the best things that will happen to you in 2010. You are sure to view science reporting in a new light and what you learn will be invaluable if you ever find yourself on the other end of the microphone. Who knows, you might even have a ringside seat for the science scoop of the decade.

Plasmonics scores smoothness bull’s eye

A technique for producing extremely smooth patterns has doubled the distance that surface plasmons can travel on metal films, according to researchers in the US. The “template stripping” approach also simplifies how the films are made, and relies largely on inexpensive silicon wafers and adhesives, claims the team. The research could lead to a practical way of manufacturing new types of solar cells and other “plasmonic” devices that exploit interactions between light and electrons.

Surface plasmons propagate on the surface of a metal as collective oscillations of electrons — and they can interact strongly with light. When light strikes a flat metal surface at right angles it will not excite plasmons, but creating patterns on the surface allows this excitation, as long as the pattern dimensions are smaller than the wavelength of the light.

Unfortunately, plasmons are also scattered and absorbed by irregular bumps on a surface, reducing the effectiveness of roughly-hewn plasmonic devices. Techniques traditionally used to fabricate nanostructures — which can involve painstakingly carving out patterns with an ion beam — produce surfaces that are too uneven. Ions implanted as a side-effect of this technique also lead to plasmon absorption.

Serendipity strikes

Now David Norris and colleagues at the University of Minnesota have developed a method that deposits copper, gold or silver onto a patterned silicon template wafer. They then apply an adhesive to the imprinted metal, and pull the metal and adhesive together away from the silicon to create an extremely smooth yet patterned surface.

“This template stripping method is very well known in scanning tunneling microscopy and self-assembled monolayers,” Norris told physics world.com. Indeed, he admits that he hadn’t come across template stripping until attending a talk given as part of a PhD thesis defence, which mentioned that it could be used to make ultra-flat gold. “We kept thinking we would find an old paper where somebody had already done this,” he said. “What we found was, instead of just peeling it off, people in the plasmonic community would completely etch away the silicon.”

Reusable templates

Minnesota PhD students Prashant Nagpal and Nathan Lindquist turned silicon wafers into templates that they have been able to re-use up to 30 times. They made the templates with the same kind of ion beam techniques that proved problematic when carving metal. The template approach means that any plasmon-absorbing ions stay in the silicon wafer, and are not transferred to the metal films that are then deposited onto it.

Nagpal and Lindquist made silver bull’s eyes, gold pyramids, triangular grooves and nanohole arrays using this method. “The first time we saw them, we were pretty excited,” Norris said. “They were beautiful.”

To test how good its surfaces were at conveying plasmons, the team produced a 200 nm thick grooved silver film, and cut slits in it with ion beams. Shining light through these slits from the adhesive side caused plasmons to move across the metal, until they hit the grooves and scattered light.

Measuring the intensity of the scattered light across films with varying distances between grooves allowed Norris and his colleagues to calculate how far plasmons were propagating. They found that their propagation lengths were close to the theoretical maximum. The plasmons travelled for more than 10 µm, far in excess of the 4 and 5 µm lengths recorded in the best previous studies.

Niek van Hulst of the Institute of Photonic Science in Barcelona, Spain, points out that even this improved propagation length demonstrates the fundamental difficulties of trying to achieve long-range plasmon transport. He says that although other groups had already investigated the impact that template stripping can have on plasmons, the Minnesota researchers have made “a nice advance in fabrication methodology”.

Norris’s team will now seek to apply its approach to applications that exploit plasmonics. In particular gold and silver films can be used to improve molecular and biological sensing in a method known as surface-enhanced Raman spectroscopy. “Many groups have demonstrated it,” explained team member Sang-Hyun Oh, “but what’s missing is a reproducible technique. Our method has the chance to address that problem.”

This research appears in the latest edition of Science.

Film review: Eyes on the Skies

guidestar.jpg
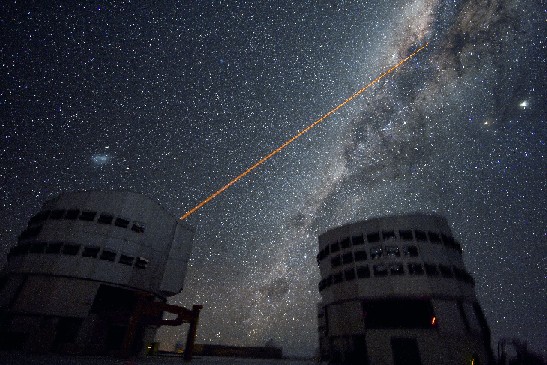
Image of the European Very Large Telescope credit ESO/Y Beletsky

If the telescope had never been invented, the known universe would consist of six planets, one moon, and a few thousand stars. It’s therefore fitting that one of the “official” products of the International Year of Astronomy 2009 (IYA2009 should be a film history of this astoundingly important device.

Unfortunately, Eyes on the Skies is not so much a film as an hour-long public relations special, with the sheer weight of official approval — it’s a joint production of IYA2009, the International Astronomical Union, the European Space Agency, and the European Southern Observatory — tending to smother its occasional flashes of character. True, there are a few exceptions, particularly in the first two chapters, which cover the telescope’s history from Galileo’s sketches to the 5 m Hale Telescope on Mount Palomar in California. We learn, for example, that legal disputes prevented anyone from earning a patent on the telescope, and that William Herschel’s biggest scope required four servants to operate its complicated system of ropes and pulleys. A little later, presenter Joe Liske of the European Southern Observatory — known here, rather cringe-makingly, as “Dr J” — does a fine job of explaining in simple terms why reflecting telescopes can be bigger than refractors.

Once we reach the modern era, however, the slick artists’ impressions take over. At this point, Eyes on the Skies becomes a visually-stunning laundry list of ambitious projects, and its determination not to leave any of them out detracts from the overall story. The film’s website suggests that it could be shown at “public events carried out by educators, science centres, planetariums, amateur astronomers etc.”, but even with this audience in mind, one suspects that its producers might have been better off just sticking microphones in front of a handful of astronomers and asking them about their work. Indeed, the diverse group of bloggers over at IYA2009’s own Cosmic Diary website would have been a good place to start. In their case, “official” status has not lessened their passion or creativity, and they are far better ambassadors for astronomy than this beautiful but bland production.

Ultracold trios tell us more about Efimov states

Physicists in Italy have gained two important insights into Efimov states — in which three or more atoms form bound states, even though pairs of the same atoms do not bind together.

Massimo Inguscio and colleagues at the University of Florence have made the first Efimov trimers that contain two different species of atoms. A separate team led by Inguscio has also made the first measurement of the energy spectrum of a trimer comprising three identical atoms.

In 1970 the Russian physicist Vitali Efimov calculated that three particles should form quantum states that are loosely bound together — despite the absence of bound states of any two pairs of particles in the system. This counterintuitive situation only occurs for particles that are bosons; that is, atoms that have integer values of intrinsic angular momentum, or spin.

Curiosities no more

Efimov states remained theoretical curiosities until the mid-1980s, when physicists began to discover “halo nuclei”. These comprise a compact nuclear core loosely bound to a halo of one or more neutrons (or protons). Conventional nuclear physics calculations say halo nuclei should not exist, so some physicists suggested that certain haloes may be Efimov states. But because halo nuclei are very short-lived and difficult to study, researchers have been unable to confirm this theory.

Then in 2006 researchers in Austria spotted the first experimental evidence for an Efimov trimer in an ultracold gas of atoms — confirming Efimov’s theory, and giving further credence to its application to halo nuclei. Two years later, the same team discovered the first Efimov quartet, suggesting that the theory also applies to four or more atoms.

Now Inguscio, Giovanni Barontoni, Francesco Minardi and others have spotted the first Efimov trimers made out of different atomic species in an ultracold gas. They looked at a mixture of potassium (K) and rubidium (Rb) atoms in a magnetic trap that is cooled to a few hundred nanokelvin. The mixture is exposed to a magnetic field that causes a short-range interaction between atoms of different species — but not between the same species.

Introducing KRbRb and KKRb

The team adjusted the strength of the “interspecies” interaction energy by changing the magnetic field and found that found that trimers are formed at certain energies. They know this because unlike individual atoms, trimers are not held by the trap and are lost to the experiment. By carefully measuring how many K and Rb atoms are lost in this process, the team concluded that two Efimov trimers were being formed: KRbRb and KKRb.

According to Barontoni, this first sighting of “heteronuclear atomic” trimers strengthens the idea that the Efimov effect is behind halo nuclei because such nuclei comprise two different types of particles: neutrons and a nuclear core.

Elswhere in Inguscio’s lab, Matteo Zaccanti, Giovanni Modugno and colleagues have found the best evidence yet that an Efimov trimer has a spectrum of different energy states — as predicted by theory.

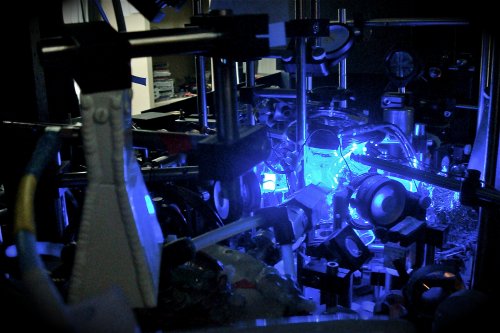
The team used laser cooling and trapping techniques followed by evaporative cooling to create a Bose Einstein condensate of potassium atoms held at just 100 nK. By changing an applied magnetic field, the team adjusted the interaction energy between the atoms and kept a close watch on how many atoms were lost from the trap. Their results show that trimers form at two distinct energies — which they say are two energy states of an Efimov trimer.

‘Important results’

Hanns-Christoph Nägerl at the University of Innsbruck described the two experiments as “very nice and very important results”. Nägerl, who was part of the team that first spotted Efimov trimers in 2006, added that the work provides important insights into how the Efimov effect could occur in halo nuclei, and how trimer energy levels could be structured.

Massimo Inguscio told physicsworld.com that the lab plans to create an optical lattice of crisscrossing laser beams in which each lattice contains just one Efimov trimer. In the current experiments the trimers decay rapidly because they interact with other atoms in the gas. However, trimers isolated in lattice sites could stick around long enough for the team to study them using a radio-frequency probe. This could, for example, allow the physicists to detect higher-order Efimov energy states.

Another avenue of exploration could be the creation of Efimov states from three different atomic species.

The research is published in Physical Review Letters and Nature Physics.

Copyright © 2026 by IOP Publishing Ltd and individual contributors