Superconductor switches on and off

A superconductor that can be switched on and off with an electric field has been made by physicists in Switzerland, France and Germany. The material could help make resistance-free electronic devices that are faster and more efficient that the transistors of today.

Most electronics devices are structures that contain interfaces between relatively simple materials such as silicon, some sort of metal and silicon oxide, which simply acts as a insulator. However, some researchers are keen to use more complex oxides — with properties such as superconductivity, ferromagnetism and ferroelectricity — which could result in new and more efficient types of devices.

This is like putting two slices of bread on top of each other and finding that a slice of ham appears in the middle

It used to be very difficult to make tiny devices using complex oxides, but thanks to recent progress in experimental techniques, scientists can now create atomically abrupt interfaces between these materials by growing them on top of each other in sandwich-like structures.

Ultrathin superconductor

Now, Andrea Caviglia of the University of Geneva and colleagues at the University of Paris-Sud 11 and the University of Augsburg, have shown that potentially useful electronic states can be found at the interface between two complex insulating oxides: lanthanum aluminate, LaAlO3, and strontium titanate, SrTiO3 (Nature 456 624). And that these states are very sensitive to external disturbances, such as electric fields.

Their work builds on experiments done last year when the team discovered that a thin superconducting layer forms between the two insulators when atomically thin layers of the materials are grown on top of each other (Science 317 1196). “This is like putting two slices of bread on top of each other and finding that a slice of ham appears in the middle,” quip the researchers.

The team has applied the same principle used in the CMOS field effect transistor to modulate the transport properties of this superconducting layer. In a CMOS field-effect transistor, an external voltage is employed to change a semiconducting channel’s resistance to an electrical current. “We report that we can switch the interface from a superconducting state to an insulating state just by applying an electric field to it,” the scientists told physicsworld.com. “In other words, you can drive the system from being a perfect conductor (which offers no resistance to electrical current) to being an insulator (which has a very high resistance to electrical current) just by applying a voltage.”

Faster and more efficient

A transistor made with a superconductor would carry current without any dissipation and should therefore be very efficient. Thanks to the lack of electrical resistance, the device would run faster than its semiconducting counterparts while using up much less power. Scientists have been trying to achieve such a result with high-temperature superconductors (which belong to same family as LaAlO3 and SrTiO3 because they have very similar crystal structures) for the last 20 years.

Although there are no immediate commercial applications for this research because of the very low device operation temperatures involved, the electric field effect could be applied to other materials, such as ferromagnets. “We can now imagine switching a magnetic system on and off just by applying a voltage, something that would have immediate applications in electronic devices,” said the team.

The researchers next want to apply their technique in the field of nanoelectronics. “We will realize nanoscale devices in which superconductivity can be dynamically defined using local electric fields,” they said.

First pictures of LHC magnet damage

By Michael Banks

Whilst trawling the web this morning I came across a few blog posts showing the first pictures of the damage caused by the magnet failure at CERN’s Large Hadron Collider (LHC) on 19 September.

The pictures were apparently shown during a presentation by the lab’s director general Robert Aymar on Friday at a meeting of the European Committee for Future Accelerators held at CERN.

The US/LHC blog posted a link to slides of Aymar’s talk. However, within an hour of the post (on 1 December) access to the talk had been restricted. Fortunately, particle physicist Stephanie Majewski from Brookhaven National Laboratory, who is at CERN for a year, posted the pictures from the talk on her

New thermometer could help redefine temperature

Physicists in Finland and Japan have invented a new type of electronic thermometer that relates temperature directly to the Boltzmann constant. Although not the first device to do so, the team say that their thermometer could easily be mass produced and therefore could be used as a highly accurate laboratory instrument as well as a calibration standard.

The current definition of the unit of absolute temperature is very messy indeed — the International Committee for Weights and Measures (CIPM) in Paris defines the Kelvin as 1/273.16 of the temperature difference between absolute zero and the triple point of pure water (roughly 0 °C) at a certain pressure. However, the CIPM would prefer to define the Kelvin, along with other SI units, in terms of fundamental constants — the Boltzmann constant kB, in the case of temperature.

As a result, teams of physicists around the world are dreaming up new techniques that relate temperature directly to kB. The latest is “single-junction thermometry” (SJT), which has been unveiled by Jukka Pekola and colleagues at the Helsinki University of Technology and NEC’s Nano Electronics Research Laboratories in Tsukuba (Phys. Rev. Lett. 101 206801).

A variation on Coulomb blockade

Their technique is a variation on Coulomb blockade thermometry (CBT), which was invented by Pekola a decade ago and is currently used in some commercial devices. CBT is based on the fact that the electrical conductance of an array of tunnel junctions — tiny bits of insulator sandwiched between two metals — changes with temperature.

While CBT works very well at temperatures above about 1K, small variations in the electronic properties of individual junctions results in an unacceptably large measurement uncertainty at very low temperatures.

Now, Pekola and colleagues have got around this problem by arranging a collection of tunnel junctions in a circuit such that the conductance depends on the properties of just one junction.

The tunnel junctions are created by first allowing a very thin layer of aluminium oxide to grow on the surface of micrometre-wide aluminium electrodes. Another electrode is then deposited on the oxide, creating metal-insulator-metal junctions through which electrons can tunnel.

Drop in conductance

Applying a voltage across the electrodes causes a current to flow through the junction. In principle, the size of the current depends on the number of electrons that can pile into the negative electrode — the more electrons available for tunnelling, the greater the conductance. At voltages above about 0.4 mV, however, this number is limited by a compromise between the Coulomb repulsion between electrons — which tends to reduce the number — and thermal energy of the electrons, which tends to boost the number. The upshot of this is that at these voltages the conductance does not vary with voltage.

At smaller voltages, however, the conductance drops off rapidly, until it falls to a minimum value at 0 V, before rising again as a negative voltage is applied. The dramatic drop in conductance occurs because at lower voltages, the junction behaves more like a capacitor, with the number of electrons that can pile into an electrode being proportional to the applied voltage as well as the thermal energy.

Works down to 150 mK

According to Pekola, the width of the dip (which can be measured by scanning the applied voltage and measuring the current through the junction) is directly proportional to the Boltzmann constant multiplied by the temperature. The team measured this width at several temperatures ranges (the lowest being 150–450 mK) and confirmed that the width is directly proportional to temperature.

As well as providing a way to express temperature in terms of the Boltzmann constant, Pekola says that the device is suitable for mass production and could therefore form the basis of a new thermometry system for use in low-temperature labs.

Sam Benz, a thermometry expert at NIST in the US, told physicsworld.com that the HUT-NEC team have done an “interesting experimental demonstration of a primary electronic-based thermometer that may prove useful at low temperatures”.

Pekola says that the team may try to commercialize the technology for use as an electronic thermometer, however there are several challenges that must be overcome. For example, he pointed out that their SJT devices are not optimized for any particular temperature range — something that would have to done to make them useful in the lab. For measuring temperatures lower than about 150 mK, for example, the junction electrodes would have to be made with a relatively large volume to ensure that the electrons are in thermal equilibrium with their surroundings.

Seeing is believing

njpblog.jpg
Ebb and Flow by P Mininni et al

By Matin Durrani

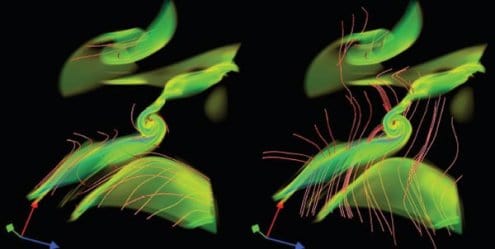
Two silent round flashes on a dark screen. That was the image witnessed by researchers crowded into the control room of the Large Hadron Collider (LHC) at the CERN particle-physics lab near Geneva on 10 September that heralded the successful passage of the first beam of protons around the 27 km collider. Later that day physicists watched as one of the LHC’s main experiments – the Compact Muon Solenoid – generated its first images from the debris of particles produced when the proton beam was deliberately steered into a tungsten collimator block.

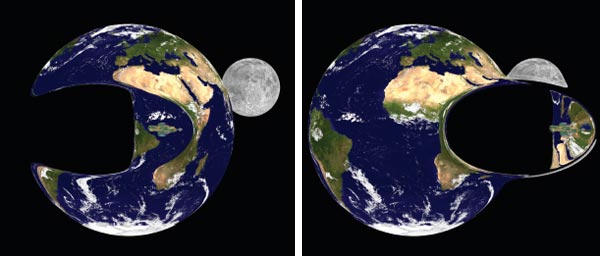
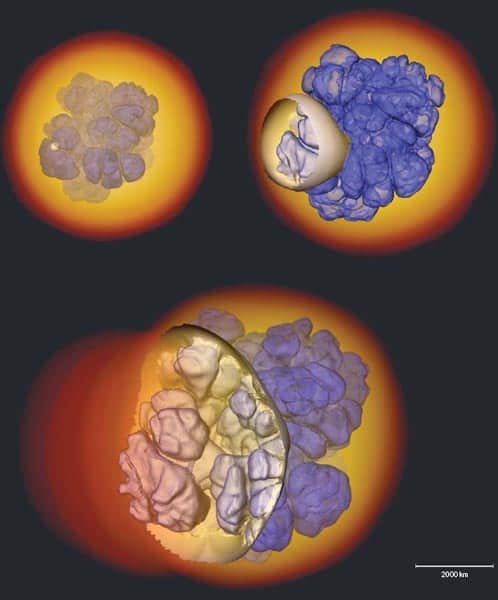
Particle physics has long been a rich source of iconic images – from the tracks in the bubble chambers of the 1950s to the particle collisions that signalled the detection of everything from the W-boson to the top quark. But visualization has a proud history in other areas of science too. Ever since Galileo turned his telescope to the heavens in 1609 and saw mountains on the Moon and spots on the Sun, researchers have sought to see beyond what is possible with the naked eye. Indeed, astronomers now claim to have directly observed extrasolar planets for the first time.

(more…)

Is a new force at work in the dark sector?

Dark matter — the elusive substance that makes up most of the matter in the universe — may be far more complex than physicists had previously thought. Indeed, it may even be influenced by a hitherto unknown “dark force” that acts exclusively on dark matter particles. That’s the claim of a team of US cosmologists, who believe that their new theory of dark matter could explain the recent intriguing and anomalous results of several high profile searches for the first direct evidence of dark matter.

Physicists believe that there is about five times more dark matter in the universe than normal matter — the latter being the familiar stuff that makes up planets and stars. While dark matter appears to interact via gravity and has a strong influence on the motion of massive objects such as galaxies, it does not interact with light and has proven very difficult to detect directly — let alone study in any detail.

In recent years, several different experiments have found unusual results that might be linked to dark matter. Researchers operating a balloon-borne cosmic-ray detector called ATIC published a paper last week detailing an unexpected excess of electrons between about 300–800 GeV. The results cannot be explained by standard models of cosmic ray origin and propagation in the galaxy and instead suggest a nearby and hitherto unknown “source” of high energy electrons.

Growing evidence of new physics?

Earlier this year it was revealed that the PAMELA satellite found an excess of positrons around 10–100 GeV, which is also unexpected for high energy cosmic rays interacting with the interstellar medium. And the INTEGRAL satellite discovered an unexpected excess of low-energy positrons at the galactic centre. While everyone isn’t sure yet whether these results are fully consistent with each other, they all seem to point to “new physics”.

One possibility is that these excess particles are caused by the annihilation of weakly interacting massive particles (WIMPs) — one of the leading candidates for dark matter. In theory, WIMPs can collide and annihilate each other, producing electron-positron pairs. However, the annihilation rate required to explain the observed excesses is far higher than expected from standard theories of dark matter.

Now, Douglas Finkbeiner at the Harvard-Smithsonian Center for Astrophysics and colleagues believe they may have a possible answer (arXiv:0810.0713). “If we believe dark matter annihilation may be the culprit for the ATIC and PAMELA excesses, we come straight to a couple of interesting conclusions,” explained Finkbeiner. “First, dark matter must annihilate to electrons or muons, either directly or indirectly, and second, it does so about 100 times more readily than expected. Both can be accomplished with a theory containing a new force in the dark sector.”

A new force and particle

According to Finkbeiner and his colleagues, their new proposed fundamental force is felt only by dark matter and mediated by a new particle, “phi”, much in the same way that another fundamental force — electromagnetism — is mediated by photons. Crucially, the force is attractive, bringing dark matter particles together much more effectively to annihilate at low speeds and leading to a greater annihilation rate than otherwise expected. Dark matter particles would collide and annihilate to produce phi particles, with each phi then decaying to produce the electrons, positrons and other particles observed by experiments.

What’s remarkable is that we found how easily the different elements supported each other and can explain a number of different anomalies simultaneously Neal Weiner, New York University

“This theory is partially a synthesis, but in bringing all the ideas together and realizing how simply they could fit together in a single framework, it is much more than just that,” says Neal Weiner, another member of the team at the Center for Cosmology and Particle Physics at New York University. “What’s remarkable is that we found how easily the different elements supported each other and can explain a number of different anomalies simultaneously.”

There are several possibilities to explain a dark matter signal and this is only one of them Dan Hooper, Fermilab

Others are more cautious. “The detections by ATIC and PAMELA are compelling but it is far too early to say that we have detected dark matter,” says Dan Hooper at Fermilab in Illinois. “Moreover, there are several possibilities to explain a dark matter signal and this is only one of them. There is no compelling reason why the universe has to be this way.”

Finkbeiner, however, is optimistic. “All we have given up is the relative simplicity of recycling the same old forces we already know about,” he says. “But we have no philosophical problem with this. Can we really expect to discover a whole new ‘dark sector’ of particles and not find any new forces at all?”

Call for better measurements

Hooper believes the only way to resolve the question ultimately is to have more precise measurements of the electron bump and more data to nail down what scientists are looking at here. Finkbeiner and Weiner agree, pointing out that further astrophysical signals, scattering of nuclei in underground experiments and news from particle accelerators could all help probe dark matter further.

“It will require many pieces, probably, to figure it out,” says Weiner. “We’re really just at the beginning of thinking about these things.”

A feast of visualization


Attention, President Obama

Richard Muller’s new book Physics for Future Presidents: The Science Behind the Headlines is both fascinating and frustrating. On the fascinating side is the wide variety of poorly appreciated, presidentially useful facts he includes. For example, did you know that petrol has 15 times the energy of TNT per unit mass, and that just one of the 9/11 aircraft carried the energy equivalent of almost 1 kilotonne of TNT? No wonder that the terrorists’ planes did so much damage to a particularly vulnerable part of New York’s infrastructure. And did you know that because growing corn requires so much energy and fertiliser, ethanol fuel produced from corn in the US reduces greenhouse-gas emissions by only 13% compared with petrol, whereas ethanol produced from sugar cane in Brazil reduces emissions by 90%?

Other facts are more fun but of less immediate presidential usefulness. In a section on space, Muller, a physicist at the University of California at Berkeley in the US, notes that if you plan to travel to a spot one light-year away, it makes a lot of sense to accelerate at 1g (the standard acceleration due to gravity at the Earth’s surface) up to the halfway point and then decelerate at about 1g for the rest of the way. The result is a pleasant near-1g of gravity in your spaceship throughout the whole journey, and a respectably relativistic average speed.

Frustratingly, however, Muller has a tendency to talk down to his readers. In his book The First Three Minutes, the Nobel laureate Steven Weinberg wrote that he pictured his reader as a smart lawyer — not a physicist with Weinberg’s training, but an intellectual peer. Muller, unfortunately, does not follow this model. At one point he criticizes another physicist for being patronizing (“a common tone that some physicists affect”). Yet three pages later, after pointing out that you can warm your bedroom with a 1 kW electric heater for a dollar a night, he notes helpfully that “it does add up. A dollar per night is $365 per year”.

Later, the author explains that the di in carbon dioxide is due to the molecule having two oxygen atoms per carbon atom. Furthermore, he seems to feel that future presidents do not need to be comfortable with the metric system that is used all over the world, so in the book we do physics in degrees Fahrenheit, pounds and feet. Perhaps he needed this approach to make his course for non-scientists at Berkeley (which forms the basis for this book, and shares its name) so popular, but even the UK has largely abandoned imperial units. You may also want to take a moment to check the author’s facts. For example, his estimate of 450 feet for the blast radius from a 1 kiloton nuclear weapon is less than the conventionally accepted value.

Such lapses are a pity, because there is valuable and fairly deep analysis in this book. For example, consider the linear hypothesis for how cancer deaths vary with radiation exposure. This hypothesis starts from what we know about cancer deaths due to high radiation levels and assumes that the risk of death from cancer is linearly proportional to the amount of radiation exposure, with no threshold below which radiation is harmless. On this basis, Muller calculates that the Chernobyl nuclear accident should have resulted in 4000 additional deaths from cancer.

This number of deaths is a terrible tragedy, comparable to 9/11. However, Muller points out that given that a fifth of all people die from cancer, the total additional cancer deaths due to Chernobyl are epidemiologically immeasurable against the background of hundreds of thousands of deaths that would have occurred naturally in the area he considered. The only cases that can be clearly attributed to Chernobyl are the cases of thyroid cancer, due to radioactive iodine.

Another possibility is that the body’s natural ability to repair cells makes low doses of radiation (below a certain threshold value) less lethal than the linear hypothesis indicates, or even completely safe. For now, however, epidemiological studies cannot help us to evaluate the linear hypothesis. There is not even full agreement on linear projections for Chernobyl. I found a 1996 study in the International Journal of Cancer that put the projection for Chernobyl at more than 15,000 cancer deaths in all of Europe through to 2065, against a background of several hundred million. A president who has to make decisions about the disposal of nuclear waste and the risks of nuclear terrorism has to determine policy in an atmosphere of scientific uncertainty. She or he should understand the issues at this depth.

Muller unfortunately does not dig as deeply when he discusses climate change. He starts by dismissing some of the arguments presented by former Vice-President Al Gore in the movie An Inconvenient Truth as cherry-picking or even distortion. He argues that loss of Antarctic ice contradicts the climate-model prediction of increased snowfall in that region. He also points out that hurricane damage in the US, when expressed in dollars adjusted for inflation, has not increased over the last century — unlike the chart in as-spent dollars that Gore shows in his film. On the other hand, Muller expresses support for the Intergovernmental Panel on Climate Change’s judgement that the 1 °F global warming in the last 50 years is very unlikely to stem from known natural causes alone. But then, frustratingly, he largely skips over the crucial questions of how severe the impacts of climate change are likely to be, and when and how vigorously we need to act. This is a critical linking step to policy decisions.

Personally, I think climate change could have a serious impact, and the time scale for action combines the qualities of a sprint and a marathon. It is a long-standing joke that when former President Bill Clinton went out to jog he would start slowly and then ease off — perhaps even stopping for a hamburger. On this issue we need to start quickly, and since we will need a rapidly growing supply of clean energy to reduce emissions while meeting growing demand, we actually need to speed up over time.

On specific solutions to the issues of energy and environment, there are some frustrating lacunae. The sections on wind turbines and solar energy, for example, fail to mention the problems that arise from the fact that the wind blows intermittently, and the Sun does not shine at night. The book also omits the fact that wind power, unlike solar energy, is already almost cost competitive with fossil-fuel energy sources.

When discussing coal, Muller fails to mention that carbon-sequestration schemes may have trouble finding suitable underground storage sites all over the world. Safety and public acceptance also pose questions. We know that carbon sequestration can cause small earthquakes. What will happen when one-third of a billion tonnes of carbon dioxide is buried near a power plant?

Although the book does present many of the complexities of nuclear power and nuclear weapons, it does not dig deeply enough into the risks of nuclear proliferation from the greatly expanded use of nuclear power. What would a world that burns two million kilograms of plutonium a year look like, when the Nagasaki bomb needed only six kilograms?

Meanwhile, as a nuclear-fusion researcher, I can confirm that Muller is right to say that fusion will not be putting electricity on the grid in 20 years, but he might be wrong to say that this is the key information a president needs to know on the subject. Overall, nuclear power presents very complicated questions, which require more depth and care than this book provides.

My own advice to aspiring future presidents (and to president-elect Obama) is that you should treat this book as a starting point for understanding how physics affects many issues of importance to society. But more importantly, you should appoint a presidential science advisor with great stature and perspective, and quickly put together a broad and respected Council of Advisors on Science and Technology. You provide policy goals, these thoughtful scientific leaders provide accurate scientific information, and your staff will help you with the analysis needed to bring these together. The outcome of this interaction, as a House Science Committee staff member once suggested to me, is good decisions.

Once a physicist: Ali Parsa

How did your career start out?

First I did civil engineering as an undergraduate at University College London, but after I graduated in 1987 I stayed on to do a PhD, which was mostly about the physics of fluids.

It was a great time of my life and I really enjoyed my work. My time was divided, however, as I had to finance myself through my studies. I had a full-time job getting the PhD as well as a full-time job building a business to make the money I needed to pay for it.

What was that business?

It was a media-promotions company. It did very well and in 1995 I won a Prince of Wales award for being one of the best young business people in the UK. After I finished my PhD in 1995, I sold the company and joined Credit Suisse First Boston as an investment banker. That was a lot of fun, although I’m not sure I enjoyed it as much as I had enjoyed doing my PhD. I stayed in investment banking for almost 10 years, moving to Merrill Lynch and then Goldman Sachs.

Did you ever consider a career in science or engineering?

Not really. I always wanted to go into research, but once I was doing my PhD I found that life in academia was a bit different from the life I wanted. Also, to do physics and engineering research in my field, you need high capital expenditure on equipment. This makes it difficult to be world-class in the UK.

How did you come to start Circle?

I had my first child quite late in life, when I was in my mid-thirties, and that made me reassess my life. I didn’t see my wife enough and we agreed that one of us would have to make a change. I always wanted to go back to being an entrepreneur and investor, so I quit my investment-banking job and in 2004, after being approached by a friend who wanted to build his own hospital, we created Circle.

What is Circle all about?

We looked at healthcare, and at the issues that are faced by current generations, and we saw that three things were happening that were making the current model for the delivery of healthcare unsustainable: the ageing population; the advent of technology in healthcare; and, finally, the fact that the consumers of healthcare have fundamentally changed their attitudes and expectations. We realized that it was time to re-engineer the delivery of healthcare.

Our solution was that healthcare should be a services organization that is run “bottom-up”. Currently, it is organized top-down, like the manufacturing industry, and doctors and nurses have very little say in how things are done. Instead, the system should be run by the doctors and nurses. We currently have 2000 doctors — mainly consultants — who are all owners of the business, making Circle the largest partnership of doctors in the UK. We help them to create and then tailor their services to their patients’ needs.

Does your physics background help you now?

Physics gives you a great way of looking at the world. No problem is ever too big or too small to be solved, and that view of the world really helps. I think the study of physics is all about problem solving, and that’s also what life is all about.

Seeing the quantum world

My interest in scientific visualization began when I was an undergraduate student at the University of Calgary and saw the film “Powers of 10” for the first time. The film begins and ends with the image of a man asleep at a picnic. In between the first and last scene, we zoom out from the picnic to the vast reaches of space, changing the distance scale by leaps of powers of 10. After reaching the size of the observable universe, at 1024 m, the view zooms back to the picnicker and into his hand, ultimately focusing down to the level of a single carbon nucleus, at the scale of 10–16 m.

Scenes from the film embedded themselves in my mind as vivid memories. I remember thinking about scaling in nature for weeks afterwards. For me, this unforgettable animation made clear the power of visualization in conveying abstract scientific concepts.

Visualization in physics has a long-standing tradition, particularly its application to quantum physics. In the early 20th century, the pioneers of quantum mechanics struggled even to explain their research to their colleagues and to convince them of its validity. Quantum concepts were strange and controversial, spurring hot debates between the likes of Niels Bohr and Albert Einstein. Scientific visualization, in the form of thought or “Gedanken” experiments, turned out to play a critical role in pushing quantum physics forward to maturity, as illustrated by Erwin Schrödinger’s influential semi-tragic story of the cat in a box. Werner Heisenberg’s “microscope” is another famous example.

Heisenberg’s “microscope” was first invoked in a paper from 1927 (Z. Phys. 43 172), to explain his eponymous uncertainty principle. Heisenberg considered the very simple set-up of a gamma-ray microscope that could accurately detect the position of an electron, at the expense of disturbing its momentum. Although unfeasible in practice, the choice of a gamma-ray microscopy was appropriate because only a short-wavelength electromagnetic field can resolve electronic motion within the atom.

Quantum short animations

Five years ago I returned to Calgary to form a new quantum-information group in the department of physics and astronomy to complement the existing quantum-computing group in the department of computer science. Early in the process, my group started attracting the interest of the wider university community and of funding agencies that were keen to learn about quantum information science and technology. My colleagues and I were faced with the long-standing challenge of communicating the essential elements of quantum physics to a more general audience. Inspired by the value of the Gedanken approach to explain difficult concepts, and enthralled by the rapidly developing power of animation, I started to believe that a combination of the two would be the best approach to explain the nature of the most challenging tasks in quantum information.

I began testing this approach with the help of my students. The first animation, done in collaboration with my assistant at the time, Rolf Horn, concerned quantum teleportation. We chose to make an animation of the famous teleportation of the polarization state of a single photon to another photon, as first demonstrated in 1997 by Anton Zeilinger and colleagues at the University of Innsbruck in Austria. The Innsbruck experiments were widely reported by the media, and an animation to explain this famous protocol and its experimental realization seemed like an excellent opportunity to try this new approach to the visualization of quantum-information technologies.

We first developed “amateur” versions of the animation, which we then showed to professional animators as a pitch for possible collaborations. The first of such collaborations came in 2003. After a few years creating animated quantum-information films, my portfolio was now such that it finally enabled me to obtain significant financial support for a state-of-the-art quantum-computing animation.

Quantum computing is a rapidly growing interdisciplinary endeavour dedicated to developing computers that will be able to solve tasks beyond the reach of classical computers, such as factorizing extremely large numbers. The stakes are high and the outcomes very promising, so funding is not as difficult to obtain as it is in other areas of science. With the help of researchers Andrew Greentree, Lloyd Hollenberg and Ashley Stephens from the University of Melbourne in Australia and Austin Fowler of the University of Waterloo in Canada, plus the skills of professional animators Andrew and Darran Edmundson of EDM Studio Inc. and audio expert Tim Kreger, we created the four-minute animation titled “Solid state quantum computer in silicon” in February 2007.

Quantum computer: the movie

In making the animation, we adapted the “Powers of 10” approach of zooming in and out to show a computer at different scales. We wanted to reveal how the computer would look to its user and how the computer’s components would appear if it were taken apart. We used a hybrid computer made of quantum and classical parts by introducing a “quantum chip” built into the “classical chip”. We were careful to show technical complexities such as the sophisticated electronics required for controlling the quantum chip plus the quantum bits (or qubits) and the quantum gates themselves. The multiscale approach uses zooming to show the interrelationships between these concepts.

Creating a visualization for science or technology requires managing the delicate balance between scientific accuracy and aesthetic appeal. Indeed, negotiations between scientists and animators can be more time-consuming and costly than the animation process itself. The whole team has to discuss and agree on visual representations and timing before the professional quality animations are done, otherwise valuable and time-consuming animations have to be discarded.

In quantum-information science, the qubit is the basic logical element and is analogous to the bit, or binary digit, of classical computers. The difference is that a bit can only assume the values of 0 and 1, but a qubit can assume the logical 0 state, the logical 1 state, or any superposition thereof. Physically, the qubit can be regarded as a spin-1/2 particle such as an electron, with an up state and a down state.

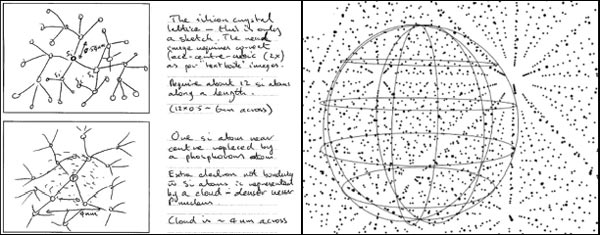
One of the challenges we faced involved depicting the “real” qubit and its environment while also showing its quantum-logical state. We chose to represent the qubit state as a point on a sphere, which is the standard in quantum information. The logical 0 state corresponds to the north pole and the logical 1 state to the south pole, with every other point on the sphere representing a superposition of these “polar states”.

For the type of silicon quantum computer in our animation, the physical realization of the qubit is the spin of the outermost electron of a phosphorous-31 atom that is embedded in a bulk silicon-28 medium. To make the qubit and its quantum state meaningful, we needed to show simultaneously the electron in the medium and the state of the electron spin.

The animation zooms into the bulk medium and shows the silicon lattice structure plus one phosphorous atom embedded in the medium. The phosphorous-31 atom looks like a sun in a lattice-like galaxy of silicon-28. To show the electron of the phosphorous atom, we used the standard portrayal of electron orbitals as clouds. The cloud is quite large and extends over the silicon lattice structure in every direction. The interaction between the electron cloud and the silicon lattice results in interference fringes in the cloud structure.

Depicting cloud interference is essential because of the importance of the overlap between the electron density and the nucleus. Magnetic fields extend throughout the quantum computer so that individual control of the electronic spin state, which serves as the qubit, requires precession of one atom’s electron while the others remain unchanged. This direct control is only possible by creating local electric fields via metal plates on the nearby surface of the silicon chip. The electric field distorts the electron cloud, as we show in our animation, and the distortion modifies the overlap of the electron cloud with the atomic nucleus. The visualization of the electron cloud and its distortion helps the viewer understand how individual electron spins can be controlled. The electron cloud conveys to viewers the distribution of the location of the electron orbiting the phosphorous-31, but the spin state has to be shown as well: quantum-information aspects have to be depicted alongside the physics. As discussed above, the spin state can be represented by a point on a sphere. We do this by placing a planet-like body near the phosphorous “sun” that shows its spin state.

The qubit is prepared and controlled by applying both global magnetic fields and local electric fields. We show the magnetic fields as broad faint lines in the solid-state medium and depict the precession of the electron’s spin state on the planet as a response to the application of these magnetic fields. The electric field is used to modify the “hyperfine splitting” of one atom so that its electronic spin qubit is individually addressable.

Meanwhile, we show the electric field as curved blue lines emanating from small metal structures on the surface. The electric field causes the electron cloud to change shape, and this shape change alters the cloud’s overlap with the phosphorous-31 nucleus, hence the hyperfine splitting. The precession of the electron spin is complicated by the presence of both a magnetic and an electric field, and we convey this complexity by showing the trajectory of the representation of the qubit spin on the “planetary sphere”.

Qubit control is just one step in quantum computing. In the animation we show two qubits and the application of the controlled-not, or exclusive-or, gate to the qubits, the readout of these qubits, and how the controlled-not gate would be performed using 28 qubits over a sequence of 45 steps, in a scene I call the “quantum error-correction dance”. For each step we need to make decisions about how to combine physical and informational entities in an aesthetic and meaningful way.

The power of visualization

Visualization of scientific knowledge is not easy or cheap, but it is rewarding and useful. Animated films are valuable tools for explaining difficult, abstract concepts such as quantum computing in the classroom. Unfortunately, at the time that it was created, our film was not widely released, but segments of it can now be viewed via an article in the December 2008 issue of New Journal of Physics (New J. Phys. 10 125005), and it is being used to great effect by the Australian Centre for Quantum Computer Technology partners, including in my classes at Calgary. The film has also been presented as part of quantum-information summer schools, including the Eighth Canadian Quantum Information Summer School in Montreal in 2008 and the International Summer School in Quantum Information Processing and Control at the National University of Ireland, Maynooth, in 2007. This animated film is an example of how visualization could be used in the future to help to effectively convey complicated scientific concepts and sophisticated emerging technologies.


Shifty constants

In my column in February, I discussed several fundamental constants, such as π and Planck’s constant, h, that, I thought, might not be expressed with maximum beauty and efficiency. I asked readers for other candidates and received dozens of replies. Many of you were particularly concerned about whether it would be better to define π as the ratio of the circumference of a circle to its radius, rather than its diameter.

In February I cited an article from 2001 called “π is wrong!” by University of Utah mathematician Bob Palais that was published in Mathematical Intelligencer (23 3), which identified formulas that would be simpler with such a redefined π. In response to my column, Palais wrote that he started thinking about π and possible simplifications when he noticed, to his bafflement, that his students would reach for their calculators to work out cos(π/2) or sin(π/2), when he had gone to the trouble to devise questions for which they did not have to do so.

But Palais noted that his sense of urgency was not widely shared. He mentioned an entry from August 2007 by the computer scientist Bill Gasarch on the blog Computational Complexity entitled “Is pi defined in the best way?”. It looks at two examples from mathematics. One concerns the expansion of the zeta function ζ(n) = Σr–n, which is a little, but not much, simpler if 2π rather than π is used. The other involves calculating the formulas for the volume and surface area of an n-dimensional sphere, for which it is only a matter of taste whether formulas with 2π are better.

A base affair

Indeed, most respondents seemed less aroused than intrigued that π, and other constants of mathematics and science, could be amended at all. Some proposed different mathematical structures that might be profitably changed, such as bases. Richard Hoptroff, a physicist who works for the software firm HexWax in London, wrote “Don’t you think the use of base 10 has passed its sell-by date? It’s a bit arbitrary now that we don’t need to count on our fingers any more. How about following the computing world’s example and switching to the far simpler 2?” Using base 2, he noted, would eliminate suspicious irrational behaviour such as thinking that 1101 is unlucky, or that 1010011010 is the number of the beast.

And Aasim Azooz of Mosul University in Iraq said he had wondered if the sacred time variable, t, which can only be defined in terms of two successive events, could be replaced with a variable such as entropy — and how such a substitution might change physics. But he confessed he had been too distracted by other events in his country to focus on the issue.

Those who preferred one version of a constant usually admitted it to be based on convenience. As Robert Olley from the University of Reading noted, “Even the difference between the two versions of Planck’s constant h and h depends on whether one is thinking physically in terms of frequency ν or mathematically in terms of angular momentum ω. Physics is not applied mathematics!”

Meanwhile, Igor Zolnerkevic, a former physics graduate student and now a science writer in Brazil, observed that a maximally efficient theory only requires two dimensional constants. He cited a paper by George Matsas from the Universidade Estadual Paulista in Brazil and colleagues, entitled “The number of dimensional fundamental constants” (arXiv:0711.4276), which has implications for what a brutally efficient approach to constants would look like, and suggests that certain constants are more fundamental than others.

But Matthew Thompson of the Naval Research Laboratory in Washington, DC pointed out that we rarely prefer such brutal efficiency, citing cases involving “constant pairs” where science needs only one constant but uses two. He mentioned the Nernst equation in electrochemistry R/F = k/E, where R is the gas constant, k is the Boltzmann constant, E is electric potential and F is the Faraday constant, i.e. the electric charge carried by a mole of electrons. “Why”, asked Thompson, “do you need F and R? We keep them since those formulas are a bit more efficient in real-world terms than their microscopic brethren.”

My colleague at Stony Brook Fred Goldhaber explained to me why convenience in constants fails to stir physicists. “Making the units more efficient may simplify people’s thinking,” he suggests. “It may simplify teaching. But it doesn’t make physics progress. It does not help us achieve a new level of understanding of the world. What physics are we doing today that we could not do with old non-SI units? And with computers to do the calculations, it no longer even matters how stupid the units are. What does matter is that people working on the same project agree on their choice of units, as shown by the Mars Climate Orbiter mission failure!”

The critical point

The subject of changing constants triggered several letters about units, and the issue generated much more passion than mathematical constants. I received half a dozen letters from metrologists, for instance, about the movement to tether the SI base unit, the kilogram, not to an artefact but to constants of nature, such as Planck’s constant or Avogadro’s number. In the words of a 2006 article by Ian Mills from Reading and colleagues (Metrologia 43 227), “In the 21st century, why should a piece of platinum–iridium alloy forged in the 19th century that sits in a vault in Sèvres restrict our knowledge of the values of h and me [the mass of the electron]?”

The passion seemed stimulated by two factors: the prospect of bringing additional precision to the kilogram over the long term; and the sense that an SI unit’s role is more completely fulfilled if it is tied to a true invariant of nature. But other respondents wondered whether such a shift really amounts to an achievement of new knowledge or understanding, or only to reshuffling our conventions. That is a discussion for another time.

Copyright © 2026 by IOP Publishing Ltd and individual contributors