European dreams

The idea of “European” science is a slightly abstract, worthy and probably rather dull notion to most physicists. People do physics because it is interesting and not because they want to help political leaders fulfil ambitious plans for improving the overall quality of research in Europe. If we want to collaborate with researchers from other countries, we will naturally try to look for the best people, who are often in the US, not Europe.

However, a major meeting in Munich last month, which brought together over 1700 scientists, science journalists and policy-makers from across Europe, sought to bring the idea of European science to life. Europe already has much to be proud of when it comes to research – the CERN particle-physics laboratory being the outstanding example. The European Union (EU) also has its massive Framework programme, which has traditionally funded huge multinational, collaborative but albeit massively bureaucratic applied-research projects.

The Munich meeting was organized by a group called Euroscience – a grass-roots organization that wants to build European science from the “bottom up”, rather than through grand projects decreed by European leaders. Held at the prestigious Deutsches Museum, the meeting highlighted the quality of European research, with scientific seminars on everything from quarks to nanoscience, coupled with discussion groups on broader issues like science journalism and peer review, as well as a string of outreach activities and careers events.

But the meeting, known as the Euroscience Open Forum, served to show that European science cannot succeed without plenty of cash: the conference cost €2.2m to organize, with a large chunk of the money actually provided by the EU itself. For a grass-roots outfit with just 2000 members, the Munich meeting would have been impossible without that central funding.

It seems that improving European science can only be done with serious money, which is why the EU’s plans for a European Research Council (ERC) are so significant. As reported in Physics World last month, the ERC – part of the €54bn Seventh Framework programme for R&D – will for the first time allow individual scientists to apply to the EU for grants to carry out basic research.

The budget is substantial – worth about €1bn a year – with grants initially being targeted at young scientists at postdoc level and beyond who want make a start as independent researchers. The first grants are set to be distributed some time next year. The ERC, which was a hot topic at one of the sessions in Munich, is a welcome sign that the EU is finally taking blue-sky research seriously. One big advantage of the council is that grants will be open to people of all nationalities, which means that Japanese or US scientists, for example, can apply, provided that they plan to move to a European institution.

However, the ERC will only succeed if it is easy and simple to apply for grants and if they are given, as intended, to support the best people and projects. The ERC must also become an independent outfit – it will initially start life next year as an offshoot of the European Commission, never the most transparent of bodies. The ERC is a genuinely exciting prospect that will help European science to thrive. It deserves to succeed.

Impedance matching

Clifford Swartz seems to be a paradox. He teaches physics and sings in a choir. He has written elementary textbooks and papers on high-energy particle physics. He is an agnostic who participates actively in his local church. Strangest of all, Swartz finds nothing strange in all of this. Indeed, he is completely at home combining these seemingly different activities in an effortless way.

For 29 years Swartz – my colleague as a professor at Stony Brook – was also the editor of The Physics Teacher, a publication that is aimed at those teaching introductory physics courses. A collection of his monthly editorials – wry and witty accounts of teaching physics at all educational levels – has recently been published as Cliff’s Nodes: Editorials from The Physics Teacher (Johns Hopkins University Press). With titles like “Physics, where the least action is” and “No-one kissed the physics teacher”, the columns instruct, amuse, plead, lecture, cajole, harangue, tell stories, relay facts and take up causes.

A node is an intersection point, and in these editorials Swartz links many apparently incompatible perspectives. Yet Swartz’s writing style blends them together seamlessly. Each column individually, and all taken together, offers valuable lessons about physics teaching.

Leading them out

Some of the columns address the content of physics lessons, discussing topics that can be converted into interesting classroom material, such as “blue” ice, plumb lines, materials that microwaves cannot warm, sounds produced by fizzy drinks bottles and so forth.

Other columns concern how to teach. Don’t treat students as little scientists, Swartz cautions. A physics teacher has to be part showman and has to lure students “into the tent” and supply further enticements to keep them there. “Physics instruction without demonstrations is like dinner without food,” Swartz writes. “Physics teachers are remembered for the afternoon everyone timed a ball dropping from the school roof, or the day the water spilled from the ripple tanks,” he notes elsewhere.

Yet content and execution cannot be separated. Swartz criticizes teaching methods that stress the need for students to memorize facts, formulas, and equations. But he also warns against patronizing students, expressing a dislike of methods that rely on hoopla, flash and dazzle, and the attempt to teach concepts without bothering to quantify them. Students visiting amusement parks and science museums, for example, should have to study what they will be doing in advance, arrive with real questions and follow up in the classroom, Swartz believes.

The word education, Swartz points out, comes from the Latin for “leading one out”. To lead students requires a firm grasp of where they stand, where you want them to go and how to attract them there. But the ground covered cannot be too great. Thus he advocates using familiar objects as physics props: Tinkertoys, nails, soap bubbles, rolling balls, toy cars, rubber bands and the like. With these simple elements – and inspired by curiosity and guided by quantification – students can be led into a great deal of physics. “If students can’t calculate the pressure exerted by the bed of nails, they’ve missed the point,” Swartz says.

Consider Swartz’s suggestions on what makes a good science project. Don’t try to make a giant leap beyond school work – no subatomic physics or string theory! Try studying a familiar but interesting phenomenon with more-complex-than-it-seems physics – rainbows, for instance. Not only is it an experimental challenge to keep a mist of rainbow-producing water from soaking the surroundings, but the physics is approachable, researchable and photographable, and the outcome pretty and satisfying, yielding a “high unlike anything else” response. When that happens, Swartz concludes, “No matter how the judging turns out, you’ve already won the science-project contest.”

Wonder and mystery, Swartz emphasizes time and again, are never far beneath the surface of familiar phenomena, easily accessible to students, and are essential to keeping their physics interests alive and fresh.

The critical point

One column in the book notes the giant leap that students must make between school and university classes, with Swartz urging that this discontinuity needs to be made smoother. He titles this particular column “Impedance matching”, referring to how when a signal crosses between two regions with vastly different loads, the load must be stepped down gradually or else the signal will be lost. (The horn of a trumpet, for example, does this when the signal – pressure pulses – made by the trumpeter’s lips travel down the bell into the open air, where the impedance is larger; if the bell were not there, most of the signal would not escape.)

Impedance matching is also an apt phrase for several other transitions that he talks about in physics education: between entertaining and instructing; curiosity and guided learning; and gaining pleasure from the world and coming to know it.

In fact Swartz’s columns taken as a whole might be described as impedance matching. It is a metaphor, after all, for the fact that the students remain human beings throughout their education – from having only a vague interest in the subject at the start to being specialists at the end. The transition is continuous and throughout requires teachers to appeal to, adapt and shape human traits. Swartz’s columns are about the importance of all the various small steps that need to take place in keeping students’ “signals” strong and stimulated.

Shelf life: Frank Close

What are the three best popular-science books?

I have chosen three books that have influenced me at different stages in my life. The Double Helix by James Watson shows scientists in competition, chasing fame and glory as well as seeking truth, and not always gloriously. It presents scientific research as an adventure and shows scientists as real people; few books do that.

Steven Weinberg’s The First Three Minutes was the first great popular book about modern physics and stimulated me to write The Cosmic Onion.

Bill Bryson writes great travel books, and that is how I regarded A Short History of Nearly Everything – it is his journey to find out how science has revealed the nature of nature. The first few pages took my breath away; I almost decided there was no point in me writing popular physics again as he had said everything so elegantly.

What science books are you currently reading?

Not Even Wrong by Peter Woit (see “String theory gets knotted”). It is a long overdue antidote to those infected by the superstring disease.

What else are you reading?

The proofs for The New Cosmic Onion – I decided to ignore my reaction to Bryson’s book!

Which popular-science book have you never read, but feel you ought to have tackled, and why?

I have been reading Douglas Hofstatder’s Gödel, Escher, Bach on-and-off for over 20 years. It is profound, and if ever I were stuck on a desert island, this is the book I would try to finish.

I keep seeing excellent recommendations of The Elegant Universe by Brian Greene. His TV series showed he has a nice turn of phrase and so I am sure his writing is also compelling. Why have I not read it? There is so much hype about superstrings, for which there is little or no evidence, that I cannot bring myself to read that genre. Perhaps I am worried that Brian Greene’s elegant prose will convert me and I will finally have to learn all that mathematics.

What advice would you offer physicists who want to write a popular-science book?

Read Bill Bryson and change your mind.

String theory gets knotted

“Not even wrong” was Wolfgang Pauli’s ultimate put-down for any theory he considered wide of the mark. Here it is adopted by Peter Woit – a mathematician at Columbia University – and aimed at the rampant industry of string theory that has mushroomed in the past 20 years, covering elementary particle physics, cosmology and even consciousness. While it is easy to imagine the irascible Pauli’s reaction to string theory, one wonders what he would have made of this book. Not Even Wrong emerged from Woit’s popular blog of the same name (www.math.columbia.edu/~woit/wordpress), and has already sparked arguments. Woit relates how his manuscript was rejected as too controversial by Cambridge University Press, before finding a high-powered publisher with the help of Roger Penrose.

Woit’s central claim is that not only is string theory wrong, but that it has also tainted the intellectual atmosphere and grabbed far more than its fair share of media coverage. With so many string theorists out there, trying to redress the balance is like spitting in the wind. The problem with the book is that it is really two books. “Woit I” – a brief history of particle physics – takes up the first 146 pages. Strings first appear on, wait for it, page 152, when we embark on the Great String Massacre of “Woit II”. Here the book finally gets into its stride, and becomes quite entertaining. But to get that point means traversing the long, rambling and inaccurate Woit I, and many readers will jump off before getting to the destination. This reviewer nearly did.

In Woit I, concepts and personalities zoom across the page at a baffling speed, with a level of detail that is unpredictable. Sometimes this is insufficient – on page 23 we are hit with the “strong interaction” and “synchrotron radiation” without being told what they are. Elsewhere we encounter, “Early work on current algebra during the 1960s had turned up a rather confusing problem which was dubbed an ‘anomaly’. The source of the difficulty was something that had been studied by Schwinger in 1951… [This] Schwinger term was causing the Hilbert space of the current algebra to not quite be a representation of the symmetry group of the model.” Got it? There is a lot more like that in Woit I.

This mayhem is not helped by errors and deficiencies: Ernest Rutherford discovered the nucleus at Manchester, not Cambridge, and using alpha particles (as stated correctly on page 19) not electrons (page 87). The ISABELLE experiment (by then called something else) at Brookhaven was cancelled while plans for the US Superconducting Supercollider were taking shape, not before, and it had no “competing collider” at CERN. Without further explanation, readers will be bemused to learn that neutrinos pass straight through the Earth but still pose a radiation problem when generated in new muon colliders. The picture of the global particle-physics scene painted in Woit I is also slanted towards the US: there is plenty about neutrino experiments based at Fermilab, but no mention of major projects elsewhere. I could go on.

Emerging from the fog of Woit I is the saintly figure of Hermann Weyl, who single-handedly did much to improve the mathematical footing of physics in the early 20th century. Indeed, aside from damning string theory, Woit’s major theme is how physics and mathematics are intertwined disciplines, dancing closely together but not always in step.

Finally arriving at Woit II, any remaining readers are rewarded, though ironically Woit himself says just the opposite: “Readers who like their science always to be inspirational are advised that now may be the time to stop reading this book.” The author relates vividly how the theoretical-physics community appears mesmerized by the brilliance of Edward Witten. While himself being impressed by Witten’s intellect, Woit depicts him as a Pied Piper of Princeton, luring gullible theorists off to dark destinations. Witten is the counterpart for the latter half of the 20th century to Weyl in the first half, but in Woit’s eyes he does not achieve the intellectual honesty of Weyl – even if Weyl was having an affair with Frau Schrödinger!

The ultimate judge of any physical theory should be comparison with experiment, and Woit duly underlines string theory’s miserable score on this count: “Not a single experimental prediction has been made, nor are there any prospects for this to change soon.” He adds a pithy remark by Feynman: “String theorists don’t make predictions, they make excuses.” While most string theorists are honest, Woit uncovers cases of dishonesty and outright fraud, such as the episode in 2002 involving the brothers Bogdanov, a string-theory version of the infamous Sokal hoax.

While in previous epochs theoretical physicists had to scamper to keep pace with mathematicians like Weyl or David Hilbert, the situation is now reversed. Problems related to field theory appear high on the mathematical agenda, with heavyweights such as Roger Penrose, Michael Atiyah and Alain Connes contributing. Long may the subtle interplay of mathematics and physics continue, Woit argues, provided it is done outside “the now-ossified ideology” of supersymmetry and string theory. On the jacket, Penrose calls Not Even Wrong “compulsive reading”. Penrose is not like other people – he is extremely bright and can churn out industrial-strength mathematics. Maybe his assessment is correct for Woit II, but not when it is prefaced by the disappointing Woit I.

The sound of silence

Our atmosphere is filled with sounds that we cannot hear. The Earth hums; volcanoes howl, pop and whistle; storms roar menacingly; and meteors scream before exploding high above the ground. We are oblivious to this perpetual symphony because it takes place at frequencies below the lower limit of human hearing, otherwise known as infrasound.

The human ear is sensitive to sounds with frequencies between about 20 and 20,000 Hz. These mid-range waves lose energy rapidly, which means we can only hear sounds coming from our immediate surroundings. But sounds exist both above and below the audible range – ultrasound, for example, can have frequencies of several megahertz. Ultrasound decays very quickly and cannot be detected very far from its source, which makes it useful for biological imaging. But with frequencies as low as a few millihertz, infrasound can travel distances of several thousand kilometres.

It was the eruption of the Indonesian volcano Krakatoa in 1883 that showed scientists that what we can hear is just a narrow slice of the full acoustic spectrum. This eruption generated the loudest recorded sound in history, and was distinctly heard some 4800 km away on the island of Mauritius. However, had barometers – which are sensitive to very gradual changes in air pressure – not recorded the cataclysmic event, most of the rest of the world would only have found out about it by word of mouth.

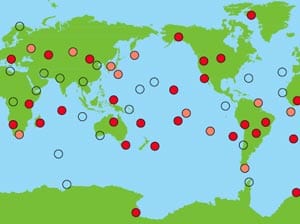
A global network of barometers is now allowing researchers to tune into the unheard world of infrasound in great detail. Similar to the way that radio waves have extended our vision of the universe at lower wavelengths, infrasound allows us to explore the acoustic properties of the atmosphere in a new way. As well as allow us to eavesdrop on a storm or a meteor exploding 1000 km away, or perhaps a large volcanic eruption on the other side of the planet, researchers hope that the Global Infrasound Network will advance our understanding of the Earth’s atmosphere and interior (figure 1). Furthermore, it will significantly improve our ability to monitor for tests of nuclear weapons.

The subsonic world

Sound can be described simply as the vibration of a material. Atmospheric sound, for instance, is the rhythmic back and forth movement of air. Although a source of sound might initially disturb only a small volume of air, once set in motion that air will continue to oscillate like a spring until the energy of motion is lost. As a general rule, the smaller the volume of air initially disturbed, the higher the frequency of the sound produced. So in order to produce infrasound, a source must be able to move a large volume of air.

Some large mammals, such as elephants, rhinoceros and whales, are known to use infrasound at frequencies just below 20 Hz to communicate with each other over distances of many kilometres. Man-made infrasound at frequencies between about 0.1 and 10 Hz is also produced by large chemical or nuclear explosions, rockets and supersonic aircraft. But the main source of infrasound is the Earth itself, which generates acoustic waves at much lower frequencies from volcanic eruptions, tornadoes, avalanches, earthquakes, meteors, aurora, storms and atmospheric turbulence. Infrasound also comes directly from the Earth’s solid interior, producing a constant vibration or “hum” with a frequency of just a few millihertz (see “The mystery of the Earth’s low-frequency hum”).

It is possible to physically feel intense infrasound at frequencies above about 1 Hz, for example by standing at the foot of a runway when a large jet aircraft flies overhead. Infrasound can also induce a sense of uneasiness – in 2003, for instance, UK researchers found that they could induce sadness and anxiety in an audience by pumping acoustic waves with a frequency of 17 Hz into a concert hall.

Dynamic atmosphere

To make sense of the infrasonic world, we need to know precisely how infrasound propagates through the atmosphere. As sound is a mechanical wave, it is similar to the compressional seismic waves that travel through the Earth’s interior. But the way infrasonic waves propagate differs significantly from seismic waves due to the rapidly changing “velocity structure” of the atmosphere. As with any other wave phenomenon, infrasound changes direction or refracts due to changes in the velocity of the medium it passes through. (This explains why ultrasound can produce such sharp images of inside the body.)

In the atmosphere the velocity of infrasound is directly proportional to the square root of the absolute temperature of the air, and it is also affected by the direction of the wind. However, both the temperature and wind direction also depend on altitude, geographic location, time of day and time of year, which complicates things considerably. For instance, infrasound refracts back to the Earth’s surface from within both the stratosphere (which exists at an altitude of 20-50 km) and the thermosphere (altitudes above 85 km) due to the increase in temperature with increasing altitude in these layers. In the lowest 10 km of the atmosphere (the troposphere) the temperature decreases with increasing altitude – but infrasound can still be refracted back to the ground from this layer due to strong winds.

In order to study infrasonic phenomena remotely we need to take into account this dynamic structure of the atmosphere. In 2000 geophysicist Doug Drob at the Naval Research Laboratory in the US developed a way to do this based on numerical weather-prediction models and measurements from balloon-borne experiments. His models are proving to be particularly useful for determining how infrasound propagates, as they incorporate changes in atmospheric structure over time at small spatial scales. Previously we had to rely on long-term averages of atmospheric conditions for this purpose, and the models did not include regional scale variations in atmospheric properties.

Detecting infrasound is most commonly done using “aneroid microbarometers”, which consist of an evacuated chamber that deforms under slight changes in the external air pressure. The devices are calibrated so that these deformations can be converted electronically to show these changes in the external air pressure in the form of a spectrum. However, our ability to detect infrasound waves with such instruments is limited by noise due to atmospheric turbulence.

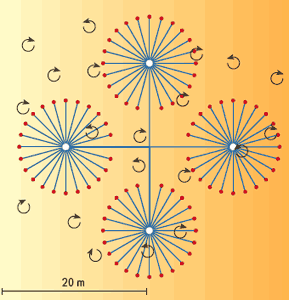
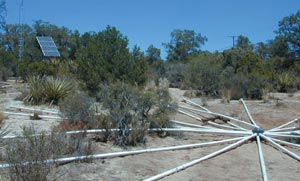
Most noise in the frequency band of interest to the infrasound community – about 0.01-10 Hz – is essentially unchanged or “coherent” over distances less than several metres, while infrasonic signals can be coherent over distances greater than 100 m. The ratio of signal to noise can therefore be increased by ensuring that infrasound is sampled via sound inlets distributed over an area tens of metres across. The signals from each inlet are then combined in a microbarometer via an array of pipes to determine the average change in the local air pressure (figure 2).

Subsonic network

Although we have known of infrasound since the late 1800s, the modern era of infrasound began with the advent of the nuclear age. This is because atmospheric explosions of nuclear weapons generate infrasonic waves with large amplitudes, offering a way to monitor nuclear proliferation. This interest increased in 1996 when the Comprehensive Nuclear Test Ban Treaty, which banned all nuclear tests, was introduced. In particular, the treaty called for a global network of sensors to continuously monitor the atmosphere for infrasonic signals from atmospheric explosions, in addition to the seismic and hydro-acoustic networks that were already in place to monitor blasts in the Earth’s interior and oceans.

Today, over half of this network – which is designed to provide uniform coverage of the Earth’s atmosphere using 60 infrasound stations optimized for frequencies between 0.1 and 1.0 Hz – is complete. Each station in the Global Infrasound Network will comprise between four and eight microbarometers equipped with a noise-reducing filter, which will provide an infrasonic aperture of between 1 and 3 km. The use of arrays of sensors, rather than single instruments, allows more faint infrasound signals to be detected and provides an estimate of the speed and direction of the incident waves.

As well as monitoring for nuclear tests, the infrasound network is proving extremely useful for basic research into natural phenomena – many of which pose serious hazards. On 30 June 1908, for example, an explosion over the Tunguska region of Siberia registered on barometers in the UK several thousand kilometres away. Although scientists still debate the exact cause of the event – which scorched and felled trees in an area about the size of Washington, DC – there is agreement that it was due to the explosion of a comet or a meteor several kilometres above the Earth’s surface. Tunguska was a blistering example of how the Earth’s surface can be devastated locally by a large explosion above ground, and of the importance of infrasound in providing evidence for such events. The Global Infrasound Network will allow researchers to study, among other things, how often these large explosions occur, in order to get a better estimate of the threat they pose.

Indeed, numerous large meteors have been recorded recently by infrasound stations. In 2001, for example, a meteor exploded 30 km above the Pacific between infrasound stations in California and Hawaii (figure 3). Researchers in the US, Europe and Australia were able to use data from these and other stations to pin down the location of the explosion and, combined with knowledge of atmospheric conditions, estimate its size. However, in general such estimates are still quite uncertain.

Infrasound can also be used for monitoring volcanoes, both for basic research and for hazard mitigation. It is well known that volcanoes can be monitored by seismometers, since movements within and beneath the volcano produce elastic waves within the Earth. More recently we have discovered that volcanoes radiate energy in all directions, including upwards into the atmosphere. Although we have monitored volcanoes for centuries to safeguard people living nearby, the fact that volcanoes erupt material upwards poses a serious threat to passing aircraft. This threat can be difficult to either assess or predict, since not all volcanic-ash releases are marked by clear seismic activity and not all erupted material can be tracked via satellites. As eruptions are inherently acoustic in nature, however, infrasound monitoring might complement existing volcano-monitoring technologies.

In addition to monitoring volcanoes for ash releases, or developing better statistics on meteor impacts, infrasound can be used to track storms as they circulate and generate low-frequency infrasound waves. An area of particular interest is how to establish the acoustic signature of storms over the Atlantic ocean while they are in the earliest stages of formation. This may provide an early-warning system for tropical storms or hurricanes before they hit land, although it remains to be seen how useful infrasound is in this regard.

Light work

There is still room for improvement in the design of infrasonic detectors, in particular to make them more sensitive to faint signals. In the last few years, a group at the University of California in San Diego led by Mark Zumberge and Jon Berger has developed a new detection system based on optical fibres. The “optical fibre infrasound sensor” or OFIS consists of a flexible tube surrounded by fibre-optic cables that measure the changes in the tube’s diameter as it expands and contracts with varying external pressure from infrasound waves. Two types of fibre-optic cable are used: one is relatively strong and insensitive to the flexing of the tube, while the other has a greater sensitivity to such variations. Using interferometry, differences in the strain in the two cables can be measured precisely and then converted into average variations in atmospheric pressure along the entire length of the flexible tube.

The OFIS gets round some of the drawbacks of reducing noise mechanically using filters because it does not require sound waves to travel through a system of pipes. Instead, changes in air pressure due to atmospheric turbulence that are much smaller than the length of the tube are averaged away, reducing the level of noise in the recording and allowing the sensors to detect faint signals. Furthermore, the sensitivity to infrasound of each OFIS tube depends on the angle at which the signal travels across it, which means that several tubes oriented in different directions can provide information about the direction of the infrasonic source.

Another novel infrasound detection system currently being developed by researchers at the University of Mississippi and the Southern Methodist University in the US is the “distributed sensor”. Comprising a grid of sensors that each sample the infrasonic pressure field independently, this system is able to both reduce noise and provide directional information about an infrasonic source by optimally integrating the signals from all the sensors electronically. Although this is the same principle used in a standard microbarometer array, the distributed sensor is much smaller and therefore offers the potential for cramming a larger number of elements into a smaller area.

Seismic shift

As the Global Infrasound Network nears completion in the next few years, the challenge now is to learn how to best exploit this huge asset. In monitoring the atmosphere continuously, the network offers an unprecedented opportunity to improve our understanding of both man-made and natural atmospheric phenomena on a global scale. Key issues to be addressed are how sound propagates through our unsteady atmosphere, and how clear measurements of distant events can be made despite noise due to atmospheric turbulence. Our expertise increases with each new source of infrasound we discover, whether it be huge electrical discharges in the upper atmosphere known as sprites, turbulence from air flowing over a mountain range or continuous noise from the oceans.

Several decades ago the seismic community was struggling with similar issues when it developed the first global seismic network. These included how to manage the large volume of data produced and how to extract the best information about the structure of the Earth and the physics of seismic sources. Although there was much excitement about the potential uses of the new network, researchers could hardly have imagined the enormous progress made in our understanding of the inner workings of our planet such as earthquakes since the first data became available.

Those of us in the infrasound community see a clear parallel with our new network. There is a palpable excitement about what we will learn about the Earth’s outermost shell – the atmosphere – using the new infrasound network. In two or three decades we will surely look back at these years and reflect on how little we imagined we could do with the data. Just as the global seismic network has been used for fundamental research and hazard reduction, we expect the infrasound network to provide a similar insight into how our atmosphere works.

The mystery of the Earth’s low-frequency hum

The atmosphere is awash with infrasonic noise from turbulence, storms and aurora at frequencies ranging from about 0.01-10 Hz. But about 10 years ago researchers discovered another type of persistent noise at even lower frequencies of 3-7 mHz. This noise, which was picked up by seismometers in the global seismic network, is now known as the Earth’s “hum” – and its origin has been the subject of heated debate.


The seismometers used to detect the hum were designed for studying the elastic waves produced by large earthquakes deep in the Earth’s interior, and are particularly sensitive to vibrations between 0.3 and 10 mHz. When an earthquake with a magnitude of about 6.5 or more on the Richter scale takes place, the entire planet vibrates at frequencies that depend on its shape and internal composition – much like a bell rings with a distinctive pitch. These vibrations, which are called the Earth’s normal modes, decay with time because the planet is not a perfectly elastic body. In 1988 however, based on 10 years’ of data, Japanese researchers found that the modes were also present during “quiet” periods when there were no significant earthquakes.

The source of this low-frequency hum intrigued many seismologists. It was initially thought to be generated by the combined effect of very small earthquakes that occur all the time around the world. But this possibility was soon ruled out because the source of the hum had to be much nearer the Earth’s surface to explain the particular fundamental modes that were being observed. Furthermore, the amplitude of the hum varied seasonally, making it unlikely that it had anything at all to do with tectonic plates.

Then in 1999 researchers turned their attentions back to the atmosphere, hypothesizing that the hum was due to atmospheric turbulence pounding incessantly on the Earth’s surface. In an attempt to investigate this possibility, in 2003 one of the present authors (BR) turned to “array analysis” in order to discriminate between sources that were distributed around the world and those that were more localized, both in time and in space. It so happens that there are two large regional arrays of seismometers deployed at just the right scale for such an analysis: one in the US operated by the Berkeley Seismological Laboratory and the other in Japan.

By pointing these arrays in different directions, and by summing the resulting seismic traces so as to enhance the signal coming from elastic “Rayleigh” waves, in 2004 we found that the strongest hum signal came from the oceans. Moreover, it came predominantly from the North Pacific during the northern-hemisphere winter and from the southern Atlantic and Pacific during the northern-hemisphere summer, following seasonal fluctuations in wave height as measured by satellite telemetry. Earlier this year we were able to identify particularly strong individual hum events and relate them to specific storms propagating across the North Pacific and hitting the western coast of North America.

An interesting aspect of our analysis, however, was that we were able to show that the origin of the hum was similar to that of the much stronger “micro-seismic noise”. This signal is present in all seismic measurements at frequencies between 0.1 and 1 Hz, and has long been known to come from non-linear interactions between ocean waves near the coast. The Earth’s hum is now thought to be generated in the oceans by a cascade of processes, which begins with the generation of ocean waves (typically with a period of 0.1 Hz) that are then converted into longer-period “infra-gravity” waves via storm activity. Because ocean storms travel predominantly from west to east, this conversion occurs primarily near the east coast of ocean basins. The long infra-gravity waves then propagate in all directions, interacting with the complex topography of the seafloor near coasts around the ocean basins to generate the elastic waves of the Earth’s hum. Although faint, the ubiquitous nature of the hum provides hope that it can be used in conjunction with earthquake signals to study the structure of the Earth’s upper mantle.

At a Glance: Infrasound

  • Unlike audible sound, infrasound can travel thousands of kilometres through the atmosphere and is used by some animals as a form of communication
  • The main sources of infrasound are geophysical, such as earthquakes and volcanoes, but nuclear explosions also produce large infrasonic waves
  • Infrasound can be detected using barometers that are sensitive changes in air pressure, but such measurements are challenging to make due to atmospheric turbulence
  • A global network of infrasound sensors is currently being assembled that will allow the atmosphere to be studied in unprecedented detail, and possibly reduce the risk posed by certain natural hazards

More about: Infrasound

A Bedard and T Georges 2000 Atmospheric infrasound Physics Today March pp32-37
M Hedlin et al. 2002 Listening to the secret sounds of Earth’s atmosphere EOS 83 564-565
Inframatics organization: www.inframatics.org
University of Hawaii Infrasound Laboratory: www.isla.hawaii.edu


World’s “bluest” sky revealed

Standards labs like the NPL are interested in colorimetry — the science of measuring colour — because of its many useful applications. Brewers, for example, can judge the quality of their beer from its colour, while environmental scientists can monitor climate change by looking at the amount of green in satellite pictures. NPL decided to get involved to ensure that Expedia’s competition made use of, and adhered to, international standards of colour measurement. The collaboration has also helped to make the public more aware of what the laboratory does.

The challenge for the NPL scientists, led by physicist Nigel Fox of the lab’s optical-radiation group, was to adapt a typical spectrometer so that it would be robust enough and simple enough to be carried in a small suitcase around the world. The equipment consisted of a Hamamatsu spectrometer, a fibre optic cable to feed light into the device, and a tripod. Light striking the spectrometer’s grating was focused by a mirror onto a sensor (figure 1).

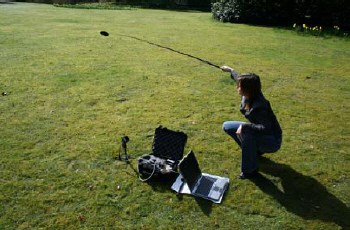
At each destination on her trip, Hohnbaum was asked to point the portable spectrometer at the sky to measure the spectrum of light at that location (figure 2). All measurements were taken at 10 a.m. local time and in the same direction relative to the Sun. She also had to ensure the spectrometer was properly callibrated at each destination by shining a special LED torch onto the device from a fixed distance. Hohnbaum then sent the data to the NPL via e-mail before heading off to her next destination.

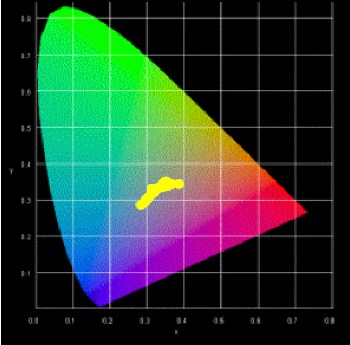
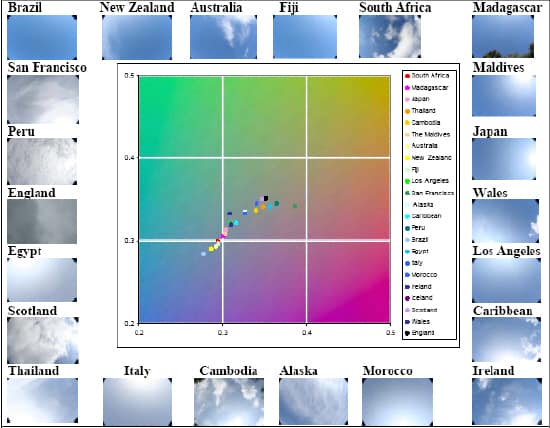
Back at the NPL, Fox and co-workers analysed the “spectral power distribution” at each destination, which is essentially of a plot of intensity versus wavelength. This spectrum was then converted into a set of three numbers known as “colorimetric co-ordinates”, which show how much red, green and blue light would have to be mixed to recreate a particular overall colour. Two of these co-ordinates — by convention, these are always the red and green — were then plotted on a standard “chromaticity diagram” (figure 3).

The data from Rio de Janeiro were found to be closest to the bluest part of this diagram — hence Brazil was deemed to have the bluest sky. Bay of Islands in New Zealand came in second, followed by Ayers Rock in Australia, while Cornwall in England came bottom (figure 4). NPL says that its measurements, which can be traced to the SI system of units, could provide a new standard for measuring the colour of the sky.

Photon06 Exhibition Show Guide

Click here to open the Show Guide for the Photon06 exhibition that was published with the August 2006 issue of Physics World (1.6 MB pdf file).

Photon06 is the largest optics event in the UK and will take place on 4–7 September 2006 at the University of Manchester. The event brings together those who have an interest in the technology of optics, whether as professional researchers in universities and other laboratories, as research students, those working in industry, and others from government bodies, such as the UK Department of Trade and Industry and the Research Councils. About 500 scientists, engineers and others whose profession is optical technology are expected to attend. The technical exhibition at Photon06 is designed to complement the conference programme and to demonstrate the wealth-creating potential and economic standing of physics-based industries. It will feature exhibitors from all the industry sectors addressed by the conference sessions and will offer a valuable hands-on source of new and different products, information and services.

Exhibition
Event information about the technical exhibition, which offers access to the latest equipment and services available from leading optics and photonics companies

Exhibitors
Updated contact details and company listings for all the exhibition stand holders

Cedip Infrared Elliot Scientific
Hamamatsu Horiba Jobin Yvon
Lambda Photometrics LOT Oriel
Marks-Clerk Newport
Ocean Optics Thorlabs

Photon06 Exhibition Show Guide (1.6 MB pdf file)


Refining the fine-structure constant

Alpha — one of the fundamental constants of physics — determines the strength of interactions between charged particles and electromagnetic fields. It equals e2/c h-bar — where e is the charge on the electron, h-bar is the Planck constant divided by 2π, and c is the speed of light — and is about 1/137. As a dimensionless number, it is even more fundamental than other constants such as the strength of gravity, the speed of light or e itself.

Most attempts to calculate alpha involve measuring the magnetic moment of the electron, g, which relates the size of the electron’s magnetism to its intrinsic spin. A value for alpha can then be obtained by inserting this value of g into equations from quantum electrodynamics (QED) — the theory that describes the electromagnetic interactions between electrically charged particles and the virtual particles of empty space. If such interactions did not exist, g should be 2, but precise measurements over the years have shown that it differs slightly from this value, as predicted by QED itself.

Until now, the best measurement of g had an uncertainty of 4 parts per trillion. Now, Gerald Gabrielse and colleagues at Harvard University have increased this precision by a factor of almost six to 0.76 parts per trillion (Phys. Rev. Lett. 97 030801). By inserting this new value of g into new and improved QED equations, the Harvard physicists, with colleagues from Cornell University and RIKEN in Japan have determined a new value for alpha that is ten times more accurate than the next most accurate value (Phys. Rev. Lett. 97 030802).

Gabrielse and colleagues measured g by studying the motion of a single electron held inside a trap made of charged electrodes and magnetic coils. The combined electric and magnetic forces keep the electron moving in a circular “cyclotron” orbit. On top of this planar motion, the electron also wobbles vertically up and down in the direction of the magnetic field. This set-up allowed the researchers to cleverly tweak the electron’s motion and measure its energy levels with great precision. The value of g was determined by observing transitions between the lowest spin and cyclotron energy levels of the electron.

Gabrielse thinks a better value of alpha could help in plans to redefine the kilogram that do not rely on using an actual weight kept in a vault in Paris.

A cool solution to waste disposal

The leader of the German-based group, Claus Rolfs of Ruhr University in Bochum, is an astrophysicist and made the discovery about alpha decay after replicating the fusion reactions that take place in the centre of stars. Using the university’s particle accelerator he fired protons and deuterons (nuclei containing a proton and a neutron) at various light nuclei. He noticed that the rate of fusion reactions was significantly greater when the nuclei were encased in metals than when they were inserted into insulators. He also observed that the effect is enhanced at lower temperatures (J. Phys. G: Nucl. Part. Phys. 32 489).

Rolfs believed this effect could be explained in simple terms by assuming that the free electrons in a metal act like the electrons in a plasma, as described in a model by Dutch physicist Peter Debye. The lower the temperature of the metal, the closer the free electrons get to the radioactive nuclei. These electrons accelerate positively charged particles towards the nuclei, thereby increasing the probability of fusion reactions.

But Rolfs realized that the reverse reaction might also occur and that free electrons could enhance the ejection of positively charged particles from a nucleus. This would reduce the half-lives of α-decay or β+-decay, and increase half-lives for processes involving electrons (which are repelled by the free electrons within the metal), i.e. β–-decay and electron capture.

The group has investigated this hypothesis by embedding a number of radioactive nuclei inside metals and then cooling the metal to a few degrees kelvin. As expected, they observed a longer half-life for the electron capture of beryllium-7 and shorter half-lives for β+-decay in sodium-22 (Eur. Phys. J. A 28 251) and α-decay in polonium-210. They are now investigating the α-decay of radium-226, a hazardous component of spent nuclear fuel with a half-life of 1600 years. Rolfs calculates that this half-life could be reduced to as little as a year and at the very least to 100 years, and believes that the half-lives of all other hazardous alpha emitters within nuclear waste could be shortened by similar amounts.

“This means that nuclear waste could probably be dealt with entirely within the lifetimes of the people that produce it,” he says. “We would not have to put it underground and let our great-great-grandchildren pay the price for our high standard of living.”

Rolfs admits that much engineering research needs to be done to convert his idea into practice, but he believes there are probably no insurmountable technical barriers. Other physicists, however, think that the basic idea may be flawed. According to Nick Stone, a nuclear physicist recently retired from Oxford University, physicists have already carried out experiments in which they cooled alpha emitters to 4 K and below, but found no significant changes in their half-lives.

Meanwhile, Hubert Flocard, director of the CSNSM nuclear-physics lab near Paris, believes that Rolfs’ model contradicts standard solid-state physics, although he admits that he cannot explain the group’s data himself. Rolfs concedes that he needs a more sophisticated theory, but stands by his results. “Nature decides what is right,” he says.

Rydberg atom mirror makes its debut

Rydberg atoms are unusual in that they contain an electron that has been excited to such a high energy level that it orbits a very long way from the nucleus. Since the outer electron is so loosely bound, Rydberg atoms are highly sensitive to external perturbations, such as electric fields. In the present study, for example, hydrogen atoms were used in which the electron had been excited by a laser beam so that its principal quantum number, n, was 27. The electron in one of these atoms can be as far as 37 nm from the nucleus.

Vliegen and Merkt began by using a laser to split up ammonia (NH3) in a quartz capillary tube. As the gas left the tube, it underwent a supersonic expansion so that the hydrogen atoms were travelling at a speed of 720 ms-1. The atoms then entered the gap between four metallic electrodes, where there is a rapidly changing electric field. As they did so, the atoms were excited by two ultraviolet laser beams to create Rydberg states.

By applying a sequence of voltages to the four electrodes, Vliegen and Merkt found that they could stop the Rydberg atoms in a time of 4.8 microseconds just 1.9 mm away from the position where the atoms were excited by the laser beams. They were then able to reflect the atoms back from the middle of the plates to their original positions with accelerations of 2 x 10⁸ ms-2. And since the atoms are focused about six microseconds after being excited, Vliegen claims that their mirror also works as a cylindrical lens.

There could be some interesting applications of the new work. According to Vliegen, the new mirror could be used to perform interferometry experiments with Rydberg atoms. He even thinks the mirror could help prevent antihydrogen Rydberg atoms generated at the CERN “antimatter factory” from colliding with the walls of the experiment chamber and annihilating there.

Copyright © 2026 by IOP Publishing Ltd and individual contributors