Commemorating 60 years of the bomb

The simulation, which mimicked the look and feel of the Trinity explosion, was watched by over 100 spectators. It was organized by the San Francisco-based Simnuke Project as part of a memorial to the atomic age. Other events include a nuclear-related art show that runs at the Rx gallery in the city until 10 August. Members of the project also plan to plant 60 trees — one for every year since 1945 — near the Los Alamos laboratory in New Mexico, where the first atomic weapons were built.

“Bringing together the events of 60 years ago into the present can be a tool for protest and healing,” says project director Camron Asadi. “By creating a close connection with the destructive nature and history of nuclear weapons, we aim to make peace the higher option.”

Is bubble fusion back?

Sonoluminescence describes the process whereby bubbles in a liquid emit tiny flashes of light when they are forced to expand and collapse by sound waves. Some physicists believe that the pressures and temperatures inside the collapsing bubbles could be high enough to initiate nuclear reactions. If achieved, such fusion could lead to a new clean energy source.

In 2002, and again last year, Rusi Taleyarkhan and colleagues published controversial results describing how they had used high-energy neutrons to create bubbles of gas in a beaker of acetone in which the hydrogen atoms had been replaced by deuterium (D). Taleyarkhan, formerly of Oak Ridge National Laboratory and now at Purdue, claimed that the temperature inside the collapsing bubbles was more than a million degrees Kelvin — high enough for two deuterium nuclei to undergo a fusion reaction. DD fusion reactions can produce a helium-3 nucleus plus a neutron, or a tritium nucleus and a proton.

However, on both occasions these results were questioned by other researchers in the field. Now, Xu and Butt have performed the experiment again using the same test chamber designed by Taleyarkhan but with radioactive californium-252 as the source of neutrons (Nuclear Engineering and Design 235 1317). This isotope emits neutrons continually, rather than in pulses like previous sources.

Xu and Butt exposed their beaker of acetone to the neutron source and then bombarded the liquid with ultrasound. The sound waves create tiny bubbles in the liquid, which then expand before imploding. As before, the duo say they have seen tritium as well as neutrons with the characteristic energy (in the 2.5 MeV range) for DD fusion reactions. When ordinary, undeuterated acetone is used, fusion products are not observed, they say.

Aaron Galonsky of Michigan State University, who was sceptical of Taleyarkhan’s original results, is sceptical again. He explains that the pulses of neutrons the Purdue team see could be coming from the enormous neutron source, which emits over 2 million neutrons per second. Many of the pulses might not be from neutrons at all but from the 2.2 MeV gamma rays resulting from thermalization and capture of source neutrons by the hydrogen in the paraffin walls of the chamber. Xu and Butt give no explanation for these pulses or indeed the neutron pulses they observe in ordinary acetone, he adds.

Seth Putterman and co-workers at UCLA are also involved in efforts to generate fusion reactions in sonoluminescence but so far they have been unable to reproduce the Purdue group’s earlier results. However, the Defense Advanced Research Projects Agency (DARPA) in the US has recently funded Taleyarkhan and Putterman to collaborate and exchange information on bubble fusion.

Prizes reward high-energy physics

Wahl was the spokesperson for the NA31 Collaboration, which saw the first evidence for direct CP violation in the decays of neutral K mesons. CP violation is thought to be the reason why the universe is made of matter, even though equal amounts of matter and antimatter should have been created in the Big Bang. CP violation means that the laws of physics change slightly when particles are replaced by their antiparticles and all three directions in space are reversed. Indirect CP violation was first seen in 1964, and the experiment led to James Cronin and Val Fitch sharing the Nobel Prize in 1980.

De Naurois is recognized for his work on two gamma-ray experiments: CELESTE and HESS. The CELESTE telescope in the French Pyrénées detects gamma rays in the 50 GeV range by measuring “Cerenkov radiation” (short flashes of blue light that are produced when gamma rays are absorbed in the air). The HESS telescope in Namibia gathers Cerenkov radiation with four telescopes, which it then uses to create images of astronomical objects. De Naurois developed a new method to analyse Cerenkov images of atmospheric “showers”, which allowed HESS to detect new gamma-ray sources near the centre of our galaxy.

Zaldarriaga is rewarded for his theoretical contributions to cosmology that are important for theories of fundamental interactions. His contributions include devising a new method for calculating fluctuations in the cosmic microwave background (CMB) — the radiation left over from the Big Bang — which has helped put constraints on various cosmological models. He has also worked on the polarization of the CMB and gravitational lensing.

Barney and Kalmus have been recognized for communicating results of particle physics experiments to the public. The prizes will be awarded at the EPS High Energy Physics meeting in Portugal next week.

New exoplanet defies theory

More than a hundred extra-solar planets have been found in recent years but most have been discovered in single-star systems. However, more than 60% of the stars in our galaxy are found in binary and multiple star systems. Maciej Konacki of the California Institute of Technology used the 10-metre Keck I telescope in Hawaii to make this latest discovery.

The new planet orbits the main star of a triple-star system called HD 188753 every 3.35 days. Two of the stars form a binary system that orbits around the third primary star at an average distance of 12.3 astronomical units, where one astronomical unit (AU) is the average distance between the Sun and the Earth. The new planet has a mass similar to the mass of Jupiter but orbits the primary star at a distance of just 0.05 AU, which explains why it is much hotter than its namesake in the Solar System. A viewer on the planet would see three “suns” in the sky: one would be yellow because it is very similar to our own Sun, one would be orange and the other would be red.

However, astronomers are puzzled by the fact that the planet is so close to the parent star. According to orbital migration theory, which is currently the leading model of planetary formation, the gravitational pull of the other two stars should have stripped away the protoplanetary disk from the parent star. This disk contains the gas and condensed matter from which planets are thought to form.

“How that planet formed in such a complicated setting is very puzzling,” says Konacki. “Planets from complicated stellar systems will put our theories of planet formation to a strict test.”

Understanding the Boxing Day earthquake

Earthquakes occur because pressure builds up as the continental plates that make up the Earth’s crust move relative to one another. The magnitude 9 earthquake of 26 December 2004 occurred at the fault line where the India and Burma plates meet. It was the fourth largest earthquake since 1900.

Christophe Vigny of the Ecole Normale Supérieure (ENS) in Paris and colleagues in Malaysia, Thailand, Indonesia and the Netherlands compiled data from GPS sites positioned at distances between 400 and 3000 kilometres from the epicentre of the earthquake, which was off the west coast of northern Sumatra. They measured the distance each GPS station moved in response to the earthquake and then used this displacement to test different models of earthquakes.

The team found small but significant jumps of between 5 and 10 millimetres at stations as far as 3000 kilometres from the epicentre. However, sites that were nearer — but still at more than 400 kilometres away — showed large displacements: 27 centimetres in Phuket in Thailand, 17 centimetres on Langkawi Island in Malaysia and 15 centimetres in Sampali in Indonesia.

According to Vigny and co-workers the data are best explained by a model in which the rupture was 1000 kilometres long and spread rapidly northwards from its origin. This is revealed by GPS stations in northern Thailand that reached their final positions less than 10 minutes after the earthquake occurred. This rules out the possibility that the earthquake was caused by a slow “aseismic” rupture. Moreover, the GPS data show that the centre of the deformation caused by the earthquake is located at least 200 kilometres north of its epicentre.

“We observed the arrival times of surface waves using kinematic processing of the GPS data, which is something that has never been done before,” Vigny told PhysicsWeb. “This opens up a new field in seismology because seismographs do not normally measure static displacements.”

The team is continuing to take data from the GPS stations on a daily basis to quantify post-seismic deformation. It will use these measurements to monitor changes in the Earth’s crust, which will continue for years to come, and perhaps predict when future earthquakes might occur.

Fingernails store personal information

“I don’t like carrying around a large number of cards, money and papers,” says Hayasaki. “I think that a key application will be personal authentication. Data stored in a fingernail can be used with biometrics, such as fingerprint authentication and intravenous authentication of the finger.”

The team’s approach is simple: use a femtosecond (10-15 seconds) laser system to write the data into the nail and a fluorescence microscope to read it out. The key to reading the data out is that the nail’s fluorescence increases at the point irradiated by the femtosecond pulses. Initial experiments were carried out on a small piece of human fingernail measuring 2 x 2 x 0.4 cubic millimetres. The writing system comprises a Ti:Sapphire oscillator and Ti:Sapphire amplifier. Pulses of less than 100 femtoseconds at 800 nanometres are then passed through a microscope and focused to three set depths (40, 60 and 80 microns) using an objective lens.

Each “bit” of information has a diameter of 3.1 microns and is written by a single femtosecond pulse. A motorised stage moves the nail to create a bit spacing of 5 microns across the nail and a depth of 20 microns between recording layers.

An optical microscope containing a filtered xenon arc lamp excites the fluorescence and reads out the data stored at the various depths. “We regulate the focus with the movement of the microscope objective,” explains Hayasaki. “The distance between the planes is set to prevent cross-talk between data stored at different depths.” The same fluorescence signal is seen 172 days after recording.

Although the initial experiments have concentrated on small pieces of nail, the team is now developing a system that can write data to a fingernail which is still attached to a finger. “We will develop a femtosecond laser processing system that can record the data at the desired points with compensation for the movement of a finger,” adds Hayasaki.

Bottoms down for quarks

Quarks are the fundamental building blocks of protons, neutrons and other hadrons, and they come in six different “flavours”: up, down, charm, strange, top and bottom. Moreover, they are arranged in three generations: the first generation consists of the lightest (up and down) quarks, the second generation contains the charm and strange quarks, and the third generation contains the heaviest top and bottom quarks.

The KEK accelerator collides beams of electrons and positrons to produce pairs of B mesons, which contain bottom quarks and antiquarks. From a sample of about 390 million such events, the Belle detector registered 35 in which a B meson decayed into either a rho or an omega meson (which contain up and down quarks) plus a photon, and 30 events where a B meson disintegrated into two K mesons (one of which contained a down quark). These few events thus confirmed the first ever sighting of a bottom quark decaying into a down quark (figures 1 and 2).

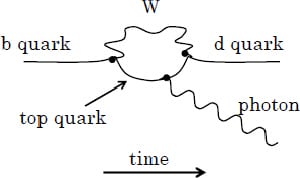
The rarity of this decay is due to the generation structure of the Standard Model, which suppresses the decays of quarks from the third generation into those from the first — even though the latter are lighter than the third-generation quarks. In particular, the Standard Model predicts that a bottom quark transforms into a down quark via a two-step “penguin” process — so-called because its Feynman diagram is thought to look like a penguin (figure 3).

However, theories such as supersymmetry — an extension of the Standard Model in which every fundamental particle has a massive “super” partner — predict that this type of decay proceeds via a different process. The Belle observation therefore allows researchers to constrain physics beyond the Standard Model. Assuming that the standard theory does hold, however, the result provides a novel measurement of one of the parameters of the “CKM” matrix, which describes how quarks change flavour.

Also announced at the Sweden conference this week was the discovery of a massive new meson called the Y(4260) by physicists at the BaBar experiment at the Stanford Linear Accelerator Center. This particle, thought to consist of a charm-anticharm quark, does not decay as expected and adds to a growing number of “exotic” mesons recently discovered in particle physics labs, including KEK. These include the Y(3490), which may be related to the Y(4260), and the X(3872), which appears to be made of four quarks.

Engaging view of emergence

Abstract physics illustration

In person, Bob Laughlin is a thoroughly engaging character with the twinkling eyes of a cheeky rogue and a razor-sharp mind. In this book he sets out to convince us that the age of reductionism is over, and that the age of emergence is upon us. He argues that complex organizational structures emerge from simple rules, that this leads to “stable inevitability in the way certain things are”, as well as to “unpredictability, in the sense of small events causing great and qualitative changes in larger ones”. Every reader will surely agree with this statement of the emergent credo.

However, all “new ages” tend to fray around the edges and resemble each other after a while. I am not, therefore, convinced that the age of reductionism is quite so moribund, nor that the age of emergence is really so very different. Differences in ostensible philosophy should not be mistaken for contradictions in practice. Reductionism and emergence are complementary ways of looking at physical reality, and the true beauty of physics is the synergy between them. I persist in thinking that there are some basic scientific questions that will yield only to a reductionist approach, whereas many others – like the author’s example of why parking spaces only seem to be available when you do not need them – are clearly emergent phenomena.

Though Laughlin, who shared the 1998 Nobel prize for his work on fractionally charged particles, would probably regard me as a dyed-in-the-wool reductionist, I am not conscious of pursuing an anti-emergence agenda. Indeed, his repetitive antireductionist line gets a bit wearing after a while. His polemic is salted with plenty of amusing anecdotes and hiking yarns, but their relevance is not always obvious, and my interest in hearing about his all-expenses-paid junkets palled after a while.

Moreover, some of his bald assertions are rather shocking, even misleading to my taste. What is one to make of his statement that “the laws of electron motion beget the laws of thermodynamics”? We know that thermodynamics is a very general property of physical systems, from black holes to the many different forms of microscopic interaction. And does the “hierarchical society of physical laws” really “render the most fundamental laws…irrelevant”? Is it really the case that “all important laws are serendipitous discoveries, not deductions”? How is one to understand his statement that gauge symmetry is incompatible with relativity?

I was also left wondering why Laughlin says so little about quarks, after arguing several years ago that he could derive them as emergent phenomena. He tends to dismiss the Standard Model of particle physics as shelf after shelf of particle masses and couplings that are not basic and cannot be calculated, and then throws in for good measure some damnation by association with nuclear weapons.

Also, it is rather cavalier of him to dismiss Big Bang cosmology as unfalsifiable “notwithstanding widely cited supporting ‘evidence’ [his quotes] such as isotopic abundances…and the cosmic microwave background anisotropy”. Nevertheless, the Standard Model works. Indeed, with its reductionist extensions, it offers our only hope of understanding how the universe on the large scale got to be the way it is today, with all its matter, light elements and structures.

Despite these occasional maddening diatribes, Laughlin’s quality as an insightful physicist shines through. Some theorists might be shocked by his assertion that relativity is “caused by things, not the cause of things”. However, this is apparent, for example, when one goes beyond the specific formulation of string theory in the critical dimension: you must have just the right amount of other stuff sitting on your string if you want to recover the concept of an ambient space-time. Just as the author says, there must be something beyond the fabric of space-time, and understanding its nature may require elements of both the reductionist and emergent approaches.

Some physicists will root for Laughlin when he tilts at the windmills of nanophysics (most of which he describes as “deeply unimportant”) and nanotechnology, and many will chuckle when he asserts that engineers gain power by preventing people from finding out what they know. However, we are all in the same boat, so why rock it unnecessarily?

Fundamentally, we are all in the business of figuring out how the natural world works, and even the author denies that microscopic law is “wrong or has no purpose”. Not even the arch-reductionist Steven Weinberg would claim that the discovery of the “ultimate theory” would mean the end of physics, let alone emergent sciences such as solid-state physics or biology. Here he and Laughlin would find common ground, and I think every reader would agree with the author’s penultimate panegyric that “we are surrounded by mysterious physical miracles, and the continuing, unfinished task of science is to unravel them”.

His concept of “antitheories” – bodies of thought that stop inquiry and thus impede discovery – is also very thought-provoking. If you read this book, you may be enthusiastic or infuriated, quite possibly both on the same page. It is certainly not an antibook, since it will certainly provoke your thoughts. I could only wish that Laughlin had been somewhat less anti some of his colleagues working on the unfinished task of science in ways different from his own.

Lessons from graduate school

Five months ago I asked readers to send me their thoughts about “the most important thing they learned in graduate school” (“Surviving graduate school”). I received about three dozen replies, which included maxims, lists of maxims and stories. Some people addressed the question from the perspective of advisors, others from that of students.

As I suspected, your responses had less to do with theories, techniques and information, and more to do with navigating the “phase transition” from undergraduate to fully fledged researcher. It is a challenging period, where the textbook ceases to be central to the learning process. The focus shifts instead to the laboratory, where one must act as part of a community in a rapidly changing environment.

Robert H Austin of Princeton University, for instance, observed that despite all of the electricity and magnetism courses that students may have taken, they usually cannot tell you what it means, say, for a coaxial cable to be 50 Ω. “They usually take an ohm meter, discover that the DC impedance is infinite and not 50 Ω, and declare the cable ‘bad’,” he said.

Austin’s view was that textbook-centred learning tends to shape an undergraduate’s view of physics itself. “They regard all physics as mathematics and do not believe in the physical reality of the world,” he explained. “When students start lab work, they typically have not seen the miracle of data revealing something new. So they are extremely sceptical when an experiment reveals things not in the textbooks, and struggle mightily to prove that the experiment must be wrong.”

Choosing an advisor

Others cited more specific lessons that they had learned, such as the importance of carefully choosing an advisor. “Everything else is a piece of cake,” concluded Peter Griswold. “Choose your supervisor with the same level of care as you do your area of research,” counselled Dominic Lloyd-Lucas.

Robert W Cahn of the University of Cambridge, whose memoirs of his experiences as a graduate student at the Cavendish are about to be published, urged: “Keep clear of advisors who regard a graduate student as a technician who simply is supposed to do what he is told (even if he isn’t told properly).”

Even advisors who are inspiring, knowledgeable and helpful can be difficult. Michael Duff recalled his days as a PhD student under the supervision of the Nobel laureate Abdus Salam at Imperial College, London. “Salam travelled a lot – he would set you a problem and then disappear. When he returned you would try to describe your progress and he would say: ‘No, no, no, that’s old hat – what you should be looking at is this.’ So after a while we wised up and tried to avoid him, but the one place you couldn’t avoid him was the men’s room, so if you were unlucky, that’s where you were given your research project. The challenge was to finish the problem before Salam decided he had a more interesting one.”

Choosing a project

Another popular response from readers concerned projects and instruments. Many wrote how easy it was to get lured into unworkable projects. Some were tempted by flashy projects that embodied buzzwords heard in lectures – only to find out that these projects were boring, time-consuming and unproductive. Others admitted to being seduced by “the fun of messing around with expensive equipment that churned out streams of data”, or by “enjoying the mechanics of manipulating, analysing and plotting the results by computer”.

Other axioms included: “work fast” (Colin Pykett); “change one thing at a time” (Geoff Hunt); “tenacity” (Tamzin Lafford); “look at the wider picture as well as the daily issues” (Steve Hoath); “if a job is worth doing, it’s worth doing well (enough for the purpose in hand, to do it any better is a waste of time)” (Pykett and others, quoting a famous lab saying).

“A month or two in the lab can save you several hours in the library,” quipped James Faller of the National Institute of Standards and Technology in Boulder, Colorado. “Don’t treat a component as a black box. It will probably pay you to understand what is going on inside the box,” warned Brian Tyres. “Assume nothing and believe no-one,” said Thomas Morgan. “It is surprising what you can achieve if you don’t mind who takes the credit” (Tyres, again, quoting the late General Alexander).

The critical point

All of these remarks suggest that what is most important about the PhD training process is learning successfully how to act in the complex and constantly changing lab environment. This point was eloquently made by Heather Williams at Manchester Royal Infirmary.

Williams’ PhD was an interdisciplinary project in medical imaging. For a while she found it difficult to carry out, until she began to realize that it required “understanding and accommodating everyone” as much as it involved “time at the image-analysis workstation, the clinic or the radiochemistry lab”. Success meant “stretching your brain around logistics and politics, as well as theories; developing in character, as well as knowledge”. Williams concluded: “What you achieve is as much about who you become as about what you do.”

Physics and the hunt for black gold

In 1924 geologist Ludger Mintrop predicted that the rock beneath a patch of land in Orchard, Texas, should contain a geological feature known as a salt dome – a block of salt that often traps hydrocarbons. The prediction was significant because Mintrop made it by sending sound waves into the Earth and recording the reflections – the first time that anyone had ever tried to use sound to look for reserves of oil or gas. He was vindicated through subsequent drilling, and the basis of his technique is still used by energy companies to find new reserves of oil and gas without first having to drill expensive holes in the ground.

However, energy companies need to develop better exploratory techniques if they are to exploit existing reservoirs to the full and find new sources of oil and gas. There is still plenty of oil left in the ground, with the industry meeting the current demand of 29 billion barrels per year. But production from existing fields is in decline and the volume of newly discovered reserves peaked in the year 2000.

Some of the increase in global energy demand that is predicted to take place over the next few decades will probably be met by new and existing forms of renewable energy and, perhaps, by nuclear energy. But not all of it. Much must continue to be satisfied through oil, gas and other fossil fuels. To guarantee this supply, the energy industry must make seismic exploration more efficient and develop other exploratory probes, such as low-frequency electromagnetic signals.

Sounding out reserves

Today’s oil and gas reserves formed over millions of years, after dead micro-organisms settled on the seabed and were then compacted by subsequent layers of sand and silt. The resulting high temperatures and pressures broke the organisms into their constituent hydrocarbons, which rose up through the “matrix” of sedimentary rocks back towards the surface. These hydrocarbons then accumulated along faults in the Earth’s layers or beneath traps such as salt domes.

Detecting these reserves involves generating a sound wave from points on the surface (or close to the surface) and then recording the multiple reflections that occur as the wave bounces off boundaries between different types of rock beneath the surface. Assuming that the velocity of sound below ground can be determined, the time of arrival of each reflected wave provides a measure of the depth of the respective boundary, and the amplitude of the wave gives some indication of the changing subsurface rock type. Together, these two types of data can generate an image of the Earth’s subsurface that shows the location of faults and traps, and therefore of potential hydrocarbon supplies.

Although this seismic technique is simple in principle, in practice it poses a number of major problems. These arise in part from the sheer scale of the exploratory operations, with highly sensitive measurements being carried out over huge areas and over extended periods of time, often in challenging environments. In offshore exploration, for example, a single seismic vessel tows almost 10,000 detectors that are spread over an area of 10 km2 (figure 1), making several billion measurements over the course of a few months. Conducting this experiment in the North Sea, one of the most hostile marine environments known, involves dealing with force 8 gales and 15 m high waves. On land, the challenges can be just as difficult. For example, Apache, the oil company that I work for, recently evaluated 1000 km2 of desert in Egypt using nearly three million individual detectors and enough connecting cable to circle the Earth twice.

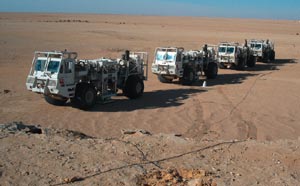
A major challenge is the need to generate sound waves that are strong enough to be detected after they have been reflected from subtle changes in rock characteristics up to 8 km below the Earth’s surface. While explosives are still used in some onshore experiments, most companies tend to use hydraulics to shake a large mass in a controlled way, generating a broad spectrum of frequencies that can propagate through the Earth (figure 2). Offshore, explosives have long since given way to environmentally friendly compressed-air guns that generate high-pressure “pops” in the water.

Another major challenge is to ensure that the detectors are sensitive enough to register the extremely low-energy reflected sound waves. Offshore, hydrophones are used. These devices are usually built from piezoelectric materials, which generate a current when subject to mechanical strain. Each hydrophone is capable of detecting pressure changes equivalent to changing the depth of water by less than the thickness of a piece of paper.

Onshore, the traditional detector of choice is the coiled geophone, in which a magnet inside a coil moves in response to the sound vibrations and generates a current in the coil. Recently, however, companies have started to use sensors based on microelectromechanical systems (MEMS) to make measurements on land, as well as on the ocean floor. At the heart of a MEMS geophone lies a small piece of a silicon chip that moves with respect to the silicon slice from which the chip has been etched. Such a sensor is considerably smaller and therefore lighter than a traditional geophone, which is a significant benefit when thousands of such devices have to be moved around during the course of an exploration. In addition, the frequency response of these MEMS devices is essentially flat for all the frequencies that are of interest in seismic exploration.

The other significant challenge in oil and gas exploration is the huge amount of data processing involved. Indeed, the seismic exploration industry has become one of the biggest users of computing capacity in the world, only just behind the military and the weather-prediction industry. It is interesting to note that the microchip manufacturer Texas Instruments was originally formed as a subsidiary to a seismic company – Geophysical Services International – to provide instruments in support of geophysical data acquisition and processing. As data-processing technology becomes more sophisticated, this stage of work can take several months, despite massive computing capability.

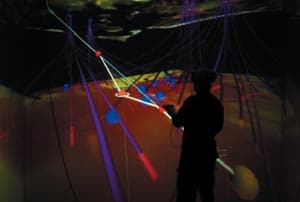
Interpreting all of these data has led to the development of 3D imaging techniques specific to the oil and gas industries. It is not unusual to hear geophysicists in oil companies talk about “immersion” in virtual-reality simulations of subsurface geology (figure 3). These simulations can, for example, allow researchers to plot the optimum course of a well through the Earth, a complex task because of the great number and variety of features in the rock. The course of a well often has to travel horizontally as well as vertically, and sometimes even has to travel back towards the surface before reaching the intended target, which is often many kilometres from where the well meets the surface.

Maximizing results

Traditional basic seismic techniques have only been used to identify subsurface structures that may contain oil (or gas), but they cannot tell researchers whether or not oil is definitely present. That is because the reflected waves convey only limited information. For instance the amplitude of the waves cannot tell you directly about the absolute density of the rock from which they have been reflected but only about how the product of rock density and wave speed changes across each rock boundary.

As a result, companies must drill a hole if they are to be sure of having found oil. Often these holes turn out to be “dry”, which is unfortunate given the huge amounts of money involved. The cost of drilling a deep-water well can often exceed $50m, since drilling rigs are expensive to build and maintain, and it can take months or even years to drill a well. In areas where there are no existing oil wells, the success rate for such drilling may be below 50%, so any information that can reduce the risk of failure is welcome. However, as technology has advanced, geophysicists have been able to deploy greater numbers of detectors and therefore generate ever-sharper images. With seismic sources and detectors spread out over a surface, researchers can now examine the same point in the Earth using sound waves that have been reflected over a range of angles. This allows them to calculate, among other things, the position of the reflecting surface with much greater accuracy and therefore target their wells more effectively.

As well as locating oil and gas reserves in the first place, energy companies are also now using seismic data to monitor how the distribution of hydrocarbons varies within a reserve over time. This allows them to optimize the production of subsequent wells so that they can extract the last drop of oil from the underlying reservoir. Recently BP deployed a permanent seismic experiment on the floor of the North Sea around the Valhall field, from which it will obtain data every few months. Such repeated experiments are often referred to as “4D seismic”, in contrast to the static 3D image that is usually obtained. Until recently 4D was used mainly by major oil companies, but it is now also being exploited by smaller independent firms.

Another recent improvement to the traditional seismic technique has been to measure the shear or “S” waves produced when a sound wave bounces off a surface. These are transverse waves that result from vibrations of atoms in the rock that are at right angles to the direction of wave propagation. Such waves are generated in addition to what we normally think of as sound waves – the compressional or “P” waves generated by atoms vibrating along the direction of wave propagation. The two types of wave behave differently in fluid, which means it is sometimes possible to determine the presence of oil and gas by comparing the arrival times and amplitudes of reflected P and S waves.

Exploration companies have long known about the virtues of measuring both P and S sound waves. But doing so requires more than a single sensor on the surface, which has historically made such seismic experiments more expensive. Today, however, these extra costs have been reduced significantly (on land at least) by using MEMS technology to build the sensors, and in some cases the benefits of the technology may outweigh the small additional expense.

Beyond seismic techniques

While seismic data have been the staple of oil and gas exploration for many years, there are some useful geological properties such as porosity, permeability and density that are impossible to measure directly using sound. Some of these properties can instead be studied by measuring resistivity, because layers of rock saturated with hydrocarbons are often more resistive than the surrounding material. Doing so involves taking a “log”, whereby geophysicists send a tool down the well and make continuous resistivity measurements as the tool is lifted out of the hole. By providing a cross section of the different rock strata, these measurements can pin down the precise location of potential hydrocarbon layers.

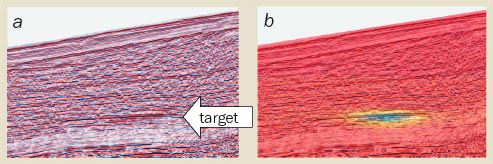
Being able to carry out these measurements without first having to drill a hole would reduce the risk of ending up with dry holes, but developing such non-invasive techniques has proved challenging. One such technique, called marine active source electromagnetic sounding, involves towing a high-energy electric-dipole antenna from a boat and allowing it travel close to the sea floor. The antenna transmits a low-frequency electromagnetic signal – from a few tenths of a hertz to a few hertz – to an array of receivers anchored to the seafloor. By moving the antenna and recording the changing signal at each receiver, researchers can build up a 3D plot of the local electric field. The position of any resistive layers below the sea floor, which could potentially be layers of hydrocarbons, can then be estimated from the effect that these layers have on the shape of the field (see figure 4).

This technique has been used for over 20 years by academics to study geological features such as mid-ocean ridges, but it has not been used extensively by the energy industry. This is partly because the approach has been limited to deep waters. Since the air above the water also acts as a resistive layer, its presence will interfere with the measurements of subsurface geology if the surface of the water is relatively close to the seabed. However, research is being carried out in both universities and industry that could extend the technique to shallow waters. This research includes trying to measure the interfering signal from the surface, and studying the effects of changing the frequency of the transmitted signal.

Research is also being carried out to extend the technique for use on land. In particular, Anton Ziolkowski and colleagues at Edinburgh University have developed a technique that involves placing an antenna on or close to the Earth’s surface and measuring the signal at several points on the surface. However, this is currently time-consuming, because the antenna and detectors need to be moved between each set of measurements.

In addition to improving the electromagnetic techniques themselves, the energy industry is also trying to simplify the analyses of the data collected from these techniques. Such data are currently interpreted using a combination of forward modelling – building a model of the Earth and then calculating how this model should respond to electromagnetic signals – and geophysical inversion – which involves trying to determine the resistivity of the Earth directly from the data collected. Although these techniques can provide accurate measurements of resistivity below the sea floor, the huge computational power needed for geophysical inversion limits the speed of data interpretation. The industry is now working towards faster imaging techniques using sophisticated computational routines that have become familiar in seismic data processing over the last few decades.

A collective approach

The oil and gas industry is unusual in being able to transform scientific data into a successful “bottom line” with great speed. From the initial decision to explore in a new area, it is sometimes possible to acquire seismic data, process the data, interpret the results and subsequently drill a well in a matter of months. The commercial utility of these data has meant that energy companies have historically developed many physics-based technologies themselves. But in the last few decades, hydrocarbon exploration has become an industry in itself, and energy companies have slowly divested themselves of their development groups.

Most fundamental geophysical research and development is now performed within exploration service companies – such as the multinationals Schlumberger and Haliburton, as well as in many smaller firms – or in universities. Often exploration companies will work together with academic groups in large collaborations sponsored by the oil and gas producers. These collaborations are likely to become more widespread as technology becomes ever-more critical to the health of the oil and gas industries. Without such technology, the world will struggle to satisfy its rapidly increasing appetite for energy.

Further reading

J Brum 2005 Realizing the value of visualization centers E&P January pp40-49
S E Johansen et al. 2005 Subsurface hydrocarbons detected by electromagnetic sounding First Break March pp31-36
P Kearey 2002 An Introduction to Geophysical Exploration (Oxford, Blackwell)
P Roberts 2004 The End of Oil: On the Edge of a Perilous New World (Boston, Houghton Mifflin) M J Tompkins 2004 Marine controlled source electromagnetic imaging for hydrocarbon exploration: interpreting subsurface electrical properties First Break August pp45-51
D Yergin 1993 The Prize: The Epic Quest for Oil, Money and Power (New York, Simon and Schuster)


Copyright © 2026 by IOP Publishing Ltd and individual contributors