A liquid can co-exist with its solid or gas form: water, for instance, can exist alongside ice in some situations and steam in others. However, recent research has suggested that different liquid phases might also be able to co-exist. These phases have the same chemical composition, but different atomic or molecular structures, and are known as “polymorphs”.
Katayama and colleagues found that molten phosphorus shows an abrupt structural change between two stable disordered states at a temperature of about 1000 degrees centigrade and a pressure of around 1 gigapascal. In situ X-ray diffraction experiments at the SPring-8 synchrotron radiation source showed that the change is reversible and that the two structures coexist during the transformation (Science306 848). The team believes that the material switches between a dense molecular form containing tetrahedral phosphorus molecules (P4) at low pressures, and a polymer form with a much lower density at higher pressures.
“Such a transition is extremely rare in pure materials and has only ever been confirmed in helium-3 at low temperatures, but this is due to a quantum effect,” Katayama told PhysicsWeb. “A first-order transition between low-density and high-density amorphous ice is also well known, but the amorphous state is not thermodynamically stable.”
Meanwhile, Kurita and Tanaka used phase-contrast optical microscopy to show that the simple molecular fluid triphenyl phosphite can transform into a “glacial” phase at temperatures above 480 degrees centigrade. Although the transformation between the two liquids took place quite slowly (see figure), the Tokyo team believes that there is a critical point at which it occurs (Science306 845). This point could depend on the build up of long-range correlations between the molecules.
“Our findings suggest that a liquid-liquid transition is not just specific to some unusual liquids, but may, in principle, exist in any liquid,” said Tanaka.
Sunspots are produced by magnetic activity inside the Sun. Observations of sunspots began in 1610 — soon after the telescope was invented — but no other data exists from before this time. Last year, Solanki and co-workers used the concentration of beryllium-10 in polar ice as a proxy for historic levels of solar activity but their reconstructions only went back as far as 850 AD. Now carbon-dating has enabled them to go back 11,400 years in time.
Carbon-14, like beryllium-10, is produced when cosmic rays interact with particles in the Earth’s atmosphere. The radioisotope is then converted into carbon dioxide and is stored in tree rings as they form. The Sun’s magnetic field can deflect cosmic rays away from the Earth, so a stronger field leads to less carbon-14, and vice versa. Using carbon-14 data Solanki and colleagues found that there has been a sharp increase in the number of sunspots since the beginning of the 20th century. The new results agree with their previous findings based on beryllium-10 (figure 1).
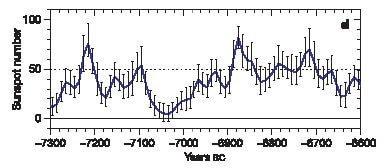
The calculations also showed that there have been three prominent periods of high sunspot number — with the average number exceeding 50 — in the last 11,400 years. These occurred mainly before 6000 BC (figure 2). However, the present value of about 75 sunspots is the highest ever recorded in the last 8000 years. According to the team, this period of unusually high activity has lasted for an abnormally long time and should end within 50 years.
Despite the high level of solar activity we are currently witnessing, Solanki and colleagues say that man-made factors are responsible for current global warming. Climate models have shown that solar activity can only account for 30% at most of the global warming experienced since 1970.
Mohanty and colleagues use standard electron lithography and surface nanomachining techniques to produce their beams, which are typically 8 microns long, 300 nanometres wide and 200 nanometres thick. To test a single device, they clamp a beam at both ends and then drive a megahertz frequency current through it, which causes the beam to vibrate at its resonant frequency.
When driven strongly enough, the beam switches between two different positions that can be used to represent “0” and “1” respectively. The two states can be seen as a hysteresis effect when the amplitude of the vibrations is plotted as a function of frequency (see figure).
The device has a resonant frequency of 23.57 megahertz, which means that information can be read more than 20 millions times per second, compared with the few hundred kilohertz rates that are possible in conventional computer hard drives. Nanomechanical memory elements could therefore overcome the superparamagnetic limits that apply to magnetic memories. Moreover, they could be packed together at densities that exceed the present maximum value of 100 gigabits per square inch.
“Another advantage of our memory element is its angstrom-sized ‘range of motion’, which allows it to operate using only femtowatts of power — compared to the milliwatts or microwatts of power that are needed for read-write functions in conventional machines,” Mohanty told PhysicsWeb. The team now hopes to make even smaller beams that will operate at gigahertz frequencies. It also plans to make nanomechanical structures from single-crystal diamond rather than silicon for better performance.
Crystalline silicon has better characteristics than its amorphous counterpart for applications in high-speed electronics, but existing plasma synthesis techniques almost always produce the amorphous variety. Moreover, the nanoparticles produced with these methods either contain large numbers of defects or vary in size by a large amount.
The new technique developed by Uwe Kortshagen and colleagues has none of these disadvantages and produces virtually defect-free crystalline nanoparticles with a narrow range of sizes.
Kortshagen and co-workers begin by injecting a dilute mixture of 5% silane (SiH4) in 95% helium and argon into a narrow quartz tube about 23 centimetres long. They then apply around 200 watts of power at a frequency of 13.56 megahertz to a ring-like electrode that is about 10 centimetres away from the ground electrode. The resulting plasma is unstable and is made up of a filament of bright plasma globules. Existing approaches to plasma synthesis use stable, uniform plasmas.
The high-energy electrons in the plasma decompose the silane gas into its constituents and the silicon atoms released in this way then recombine to form silicon particles. Transmission electron microscopy reveals that the nanoparticles are all between 20 and 80 nanometres in size and are predominantly cubic-shaped.
“At present, we do not completely understand what causes the well-defined shape of our particles, or why they form crystals,” Kortshagen told PhysicsWeb. “However, we believe that the filamented plasma plays an important role in that it heats the particles to temperatures that are several hundreds of degrees hotter than the surrounding gas. The atoms in a particle can then readjust themselves, which allows it to find an energetically favourable shape.”
The team now hopes to extend its process to other commercially important materials, such as gallium arsenide and gallium nitride.
Geim and colleagues made the films by mechanically peeling layers of graphene — two-dimensional sheets of carbon atoms — from the surface of a thick crystal of graphite, and then used a combination of optical, electron-beam and atomic-force microscopy to separate out the thinnest films. This allowed them to produce films that measured tens of microns across but were only a few nanometres thick.
Using standard lithography and etching techniques, the UK-Russia team then processed the films to make field-effect transistors. Electrons in the device were able to travel ballistically — that is, without being scattered — from the source to the drain electrode at room temperature.
“The ballistic transistor is a holy grail for electronic engineers because it is very very fast,” says Geim. “Graphene shows ballistic electronic transport at submicron distances, which is more than enough to make ballistic transistors.” Although the team has not demonstrated that its transistors are fast, they have shown that they are ballistic.
Inspired by recent breakthroughs made with carbon nanotubes — which can be considered as rolled up graphene sheets — the team is now exploring other possible applications for the films, including ultrasensitive gas sensors. “Graphene is a truly wonderful material,” says Geim.
General relativity predicts that massive bodies, like planets and stars, actually distort the fabric of space and time by their presence and also when they move. In particular the theory predicts that large rotating bodies, such as the Earth, will “drag” space-time with them as they turn about their axis.
“The Lense-Thiring effect we have measured is tiny, about two meters per year,” Ciufolini told PhysicsWeb. “However, frame-dragging effects could be huge around a spinning black hole and they may have important dynamical consequences on the accretion disk of matter by rotating black holes and rotating neutron stars.”
Ciufolini and Pavlis analyzed how the orbits of two small satellites, LAGEOS and LAGEOS 2, changed as a result of frame dragging by the Earth. The surfaces of these satellites, which orbit at a distance of about 5900 kilometres, are covered with retro-reflectors that can bounce laser beams from Earth back to the exact position they were sent. By measuring the time it takes for a laser beam to come back from one of the satellites, its position can be calculated with a precision of just a few millimetres. Ciufolini and Pavlis analysed 11 years’ worth of data — a total of about 100 million laser ranging observations — to obtain their results.
However, the Earth’s gravity field is not uniform because of variations in the distribution of mass, and this lack of uniformity has a much bigger effect on the motion of the satellites than the Lense–Thirring effect. To remove these variations — which are purely Newtonian in origin — from their calculations Ciufolini and Pavlis relied on preliminary data from the Gravity Recovery and Climate Experiment (GRACE) mission. This mission consists of a pair of satellites that are making detailed measurements of the Earth’s gravity field.
Ciufolini and Pavlis say the total uncertainty in their measurements is plus or minus 10% if they allow for unknown sources of error, and they hope to improve on this accuracy with a new satellite called Weber-sat. Meanwhile results with an accuracy of 1% are expected when the Gravity Probe B mission publishes its first results in early 2006.
“The work of Ciufolini and Pavlis is a relatively straight-forward test of frame-dragging, although it depends on error analyses that are difficult to verify,” says John Ries of the University of Texas. “I would say I am cautiously optimistic about the results. However, a big danger in this experiment is that the analysts already know the answer they expect to get — agreement with general relativity — so there is a real possibility of a bias towards that result.”
Seok-Hwan Chung and co-workers measure the change in the magnetic susceptibility of the nanoparticles in an alternating magnetic field. The susceptibility depends on the length of time it takes for the magnetic spins of the nanoparticles to “relax” to their original alignment after the magnetic field is removed.
There are two types of magnetic relaxation: in Brownian relaxation the particles rotate in solution due to their thermal energy, while in Néel relaxation the internal dipole moments of the particles rotate. Néel relaxation generally occurs for particles smaller than about 10 nanometres across, while Brownian relaxation dominates for larger particles. Sensing techniques that measure Néel relaxation times already exist, but they are not able to distinguish between different targets with similar properties.
Brownian relaxation shows up as a peak when magnetic susceptibility is plotted as a function of frequency. According to theory, this peak should move to lower frequencies if the radius of the nanoparticles is increased by, for example, binding target molecules to them.
To test this, Chung and colleagues coated magnetite (Fe3O4) nanoparticles with a protein called avidin. The magnetite core was between 10 and 40 nanometres across, while the coating was about 30 nanometres thick. They found a peak in the magnetic susceptibility versus frequency curve at 210 Hz, which shifted to just 120 Hz when biotin — a protein that specifically interacts with avidin — was added (see figure).
According to the Argonne team, this shift is caused by the increase of 10 nanometres or so in the hydrodynamic radius of nanoparticles caused by the biotin binding to the avidin coating. The method can thus be used to detect different target molecules because each leads to a characteristic decrease in the frequency of the peak. The work will lead to the development of small, portable biosensors, says Chung. The group is now working to improve the sensitivity of its technique.
All high-temperature superconductors consist of parallel planes of copper oxide, with other elements sandwiched in between these layers. The copper atoms lie on a square lattice and the charge is carried by “holes” sitting on oxygen sites. Previous X-ray scattering measurements on yttrium barium copper oxide (YBCO) superconductors revealed spectra containing diffuse features that were attributed to the formation of stripes in the copper oxide planes. Many physicists believe that these stripes serve as channels along which the super-current can flow.
Jörg Stempfer from the Max Planck Institute for Solid-State Research in Stuttgart and co-workers have now found that these features have their origins in oxygen defects instead (Phys. Rev. Lett.93 157007). The German team performed its measurements on single crystals of YBCO doped with calcium at the HASYLAB synchrotron radiation source at the DESY Research Centre in Germany and the Advanced Photon Source (APS) at the Argonne National Laboratory in the US. With energies of around 100 keV, the X-rays were able to penetrate thick samples and probe the bulk properties of the samples.
Stempfer and colleagues observed an ordered superstructure with a periodicity of four unit cells in materials that contained oxygen defects, or vacancies, but not in samples that did not contain oxygen defects. Moreover, the formation of the superstructure depended on the oxygen concentration, but not on the charge carrier concentration, which suggests that stripes are not responsible for the diffuse features observed in the X-ray spectra.
Meanwhile in similar experiments Zahirul Islam, who is based at the APS at Argonne, and colleagues have observed “nanodomains” of displaced copper, barium and oxygen atoms in YBCO crystals. According to the US team, the presence of these domains indicates that an ordered pattern of oxygen vacancies forms, leading to the same superstructure seen by Stempfer and colleagues (Phys. Rev. Lett.93 157008). Such oxygen ordered superstructures were first predicted by Didier de Fontaine and co-workers at the University of California at Berkeley in 1990.
The defects lead to strains in the crystal, which make it inherently inhomogeneous, whereas many model of high-temperature superconductors assume that they are homogeneous. The results from both groups are likely to upset supporters of “stripe theory” but could help explain the origin of several, as yet unexplained, spectral features observed in experiments performed by other teams.
Earlier this year I asked readers to send me their shortlists of great equations. I also asked them to explain why their nominations belonged on the list and why, if at all, the topic matters (Physics World May 2004). I received about 120 responses – including single candidates as well as lists – proposing about 50 different equations. They ranged from obvious classics to “overlooked” candidates, personal favourites and equations invented by the respondents themselves.
Several people inquired about the difference between formulae, theorems and equations – and which I meant. Generally, I think of a formula as something that obeys the rules of a syntax. In this sense, E=mc2 is a formula, but so is E=mc3. A theorem, in contrast, is a conclusion derived from more basic principles – Pythagoras’s theorem being a good example. An equation proper is generally a formula that states observed facts and is thus empirically true. The equation that describes the Balmer series of lines in the visible spectrum is a good example, as are chemical equations that embody observations about reactions seen in a laboratory.
However, these distinctions are not really so neat. Many classic physics equations – including E=mc2 and Schrödinger’s equation – were not conclusions drawn from statements about observations. Rather, they were conclusions based on reasoning from other equations and information; they are therefore more like theorems. And theorems can be equation-like for their strong empirical content and value.
It thus makes sense to classify both kinds as equations, which is exactly what respondent David Walton from the University of Manchester did. He distinguished between equations (such as F=ma) that comprise axiomatic models that “define the interrelationships between various observables for all circumstances” and equations that are approximate models (such as Hooke’s law), which define “the interrelationships between the various observables over a defined range and within a defined accuracy”. I therefore interpreted the term “equation” loosely.
Simplicity
Respondents had many different criteria for greatness in equations. Half a dozen people were so impressed with simplicity that they proposed 1+1=2.
“I know that other equations have done more, express greater power [and have a] broader understanding of the universe,” wrote Richard Harrison from Calgary in Canada, “but there’s something to be said for the beauty of the simplest things of their kind.” He then recalled how 1+1=2 was the first equation he taught his son. “I remember [him] holding up the index finger of each hand as he learned the expression, and the moment of wonder when he saw that the two fingers, separated by his whole body, could be joined in a single concept in his mind.”
Neil Blackie also voted for 1+1=2. “For this equation to come into being there had to be the invention of a method for representing a physical reality, quantities had to be given names and symbols,” he argued. “There had to be a system to show how these quantities could be grouped together or taken apart. The writing down of this equation gave us the ability to present ideas, to discuss concepts, which led to an ever-expanding sphere of knowledge.”
Other simple equations that were proposed included v=H0d, which Edwin Hubble composed in 1929 to describe the fact that the galaxies are moving away from us at a speed, v, that is proportional to their distance, d, where H0 is the Hubble constant.
Balagoj Petrusev, an undergraduate student at the Institute of Physics in Skopje, Macedonia, suggested the Hamiltonian variational principle in the form δS=0. A proper selection of the form of S articulates “a universal principle that stands true in classical mechanics, classical electrodynamics, relativistic mechanics, non-relativistic quantum mechanics and so on”. In fact, Andy Hone from the University of Kent wrote a eulogy to this equation in Physics World last month (September p64).
The unifying power of a great equation is not as simple a criterion as it sounds. A great equation does more than set out a fundamental property of the universe, delivering information like a signpost, but works hard to wrest something from nature. As Michael Berry from Bristol University once said of the Dirac equation for the electron: “Any great physical theory gives back more than is put into it, in the sense that as well as solving the problem that inspired its construction, it explains more and predicts new things” (Physics World February 1998 p38).
Great equations change the way we perceive the world. They reorchestrate the world–transforming and reintegrating our perception by redefining what belongs together with what. Light and waves. Energy and mass. Probability and position. And they do so in a way that often seems unexpected and even strange.
For this reason, several respondents proposed equations that linked two or more disparate concepts, concrete and abstract things, the visible and the invisible. They included Boltzmann’s equation S=k InW. It relates entropy, S, which emerged as a concept during the development of thermodynamics early in the 19th century, and a purely abstract quantity, W, that emerged from the statistical treatment of systems with many degrees of freedom.
Bragg’s equation, nλ=2dsinθ, wrote another respondent, “links diffraction spots (visible reality) with the underlying crystal structure (invisible reality) and can be easily visualized with a standard textbook picture.”
One of the most frequently mentioned equations was Euler’s equation, eiπ+1=0. Respondents called it “the most profound mathematical statement ever written”; “uncanny and sublime”; “filled with cosmic beauty”; and “mind-blowing”. Another asked: “What could be more mystical than an imaginary number interacting with real numbers to produce nothing?” The equation contains nine basic concepts of mathematics – once and only once – in a single expression. These are: e (the base of natural logarithms); the exponent operation; π; plus (or minus, depending on how you write it); multiplication; imaginary numbers; equals; one; and zero.
Practicality
Many respondents were impressed by equations that have a practical influence on human life. These included: the compound-interest equation, the implications of which from the Renaissance to the present are “obvious, staggering and unwelcome”; income-tax formulae; the simple ratio a/b=c/d, which is basic to construction, surveying and so forth; simple electrical equations, such as V=IR; basic mechanical equations, such as work done = force × distance; Shannon’s capacity equation, which relates to the modern world through the Internet and digital communication; and, last but not least, Pythagoras’s theorem.
Roger Bailey nominated the “sunrise equation” cos(time) = –tan(lat) × tan(dec), which identifies the time of sunrise or sunset as a function of latitude and solar declination. This, he pointed out, is “fundamental to our sense of time” and it “fits on a T-shirt”.
Engineer John Wilcher suggested the ideal-gas law, PV=nRT, pointing out that “the relation of pressure, volume and temperature is relevant to almost everything we do”, including common but often overlooked uses such as car tyres, angioplasty procedures and oil drilling.
Meanwhile, Iain Christison, an emeritus professor of animal agriculture at the University of Saskatchewan, Canada, suggested EM=H+P – metabolized energy equals heat plus product. It describes the fact that “all of the useful energy consumed by animals, including people, is released as heat or stored as product”. The equation, he added, “carries within it an intricate balance of cause and effect that influences all of us with every mouthful and with every step”.
Historical relevance
Some respondents proposed equations that played key roles in the history of science. For example, Alan Denham proposed the Balmer series
The long history of this equation stretches from Fraunhofer’s studies of the spectrum of sunlight in 1814, to Kirchhoff ’s suggestion in 1859 that each atomic species has a unique spectrum, to Angstrom’s publication of the wavelengths of a thousand Fraunhofer lines in 1868, to schoolteacher Johann Balmer, who in 1885 noticed that the frequencies of light emitted by hydrogen atoms were mathematically related. The equation’s history was continued by Lyman’s observations in the ultraviolet region and by others in the infrared, by Rydberg (who gave his name to the constant R in the equation), and by Bohr, whose work in 1913 explained the equation. “As soon as I saw Balmer’s formula the whole thing was immediately clear to me,” Bohr once said.
“Thus this century-long story,” Denham wrote, “involving the theoretical and practical investigation of science by some of its most distinguished practitioners, would be incomplete without giving due honour to the contribution of a secondary-schoolmaster who spotted that the published scientific data conformed to a pattern that none of the scientists of his day were aware of.”
Maxwell’s equations
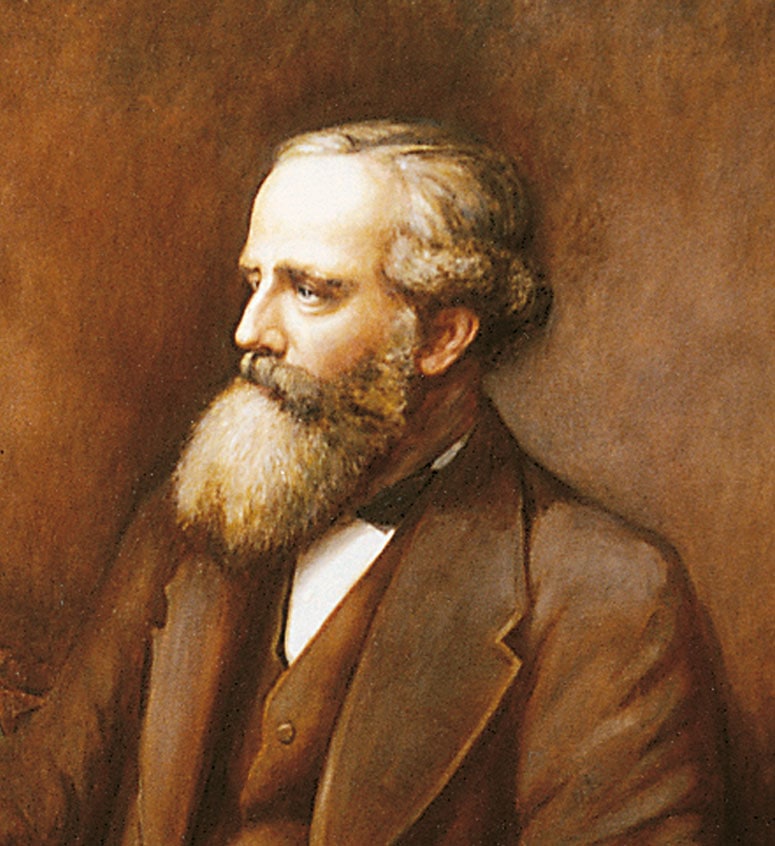
The responses suggested that there is no single criterion for greatness, and that a truly great equation ranks high in each of the above criteria. However, most votes were given to Euler’s equation and to Maxwell’s equations, which describe how an electromagnetic field varies in space and time. Although Maxwell’s equations are relatively simple, they daringly reorganize our perception of nature, unifying electricity and magnetism and linking geometry, topology and physics. They are essential to understanding the surrounding world. And as the first field equations, they not only showed scientists a new way of approaching physics but also took them on the first step towards a unification of the fundamental forces of nature. A firm called Ocean Optics in Florida even sells T-shirts with Maxwell’s equations on.
Tony Watkins recalled how he learned the equations during his second year as an undergraduate at Southampton University almost 20 years ago. “I still vividly remember the day I was introduced to Maxwell’s equations in vector notation,” he wrote. “That these four equations should describe so much was extraordinary…For the first time I understood what people meant when they talked about elegance and beauty in mathematics or physics. It was spine-tingling and a turning point in my undergraduate career. After a year of rapidly dwindling interest in physics (and rapidly decreasing results!), my passion was reignited by four lines of symbols.” He even renamed his next bicycle Maxwell in honour of the great man, having previously ridden on his Carnot Cycle. Sadly for him, he never got round to learning tensors to see Maxwell’s equations expressed even more simply.
The critical point
Nobody accepted my invitation to discuss why greatness in equations matters, which leaves me free to address the topic myself. Debating the issue has drawbacks, for it can foster the idea that equations are independent tools rather than embedded in networks of other equations, practices and information. Nevertheless, it helps us to recollect, among other things, what Richard Harrison called that “moment of wonder” that was apparent in his son’s contemplation of 1+1=2.
As adults, we lose that wonder. We come to think of equations as just another set of tools that lie about ready-at-hand in the world. We lose our appreciation for their origin, thinking that they are not really of human origin: on the eighth day, God created equations as the blueprint for His recent work. As Galileo wrote – disingenuously, polemically – the Book of Nature is written in mathematical symbols. That’s untrue, of course. We write, and continually rewrite, the book of nature.
As the philosopher Immanuel Kant once wrote: “When we discover that two or more heterogeneous empirical laws of nature can be unified under one principle that comprises them both, the discovery does give rise to a noticeable pleasure…even an admiration that does not cease when we have become fairly familiar with its object”. This delight is more than having our expectations fulfilled or surprised, more than about the domination and control of nature, more than a biological product. The pleasure, Kant continued, is a feature of the exercise of the human intellect. “Even the commonest experience would be impossible without it,” he wrote, which is why we “gradually come to mix it with mere cognition and no longer take any special notice of it.”
In reawakening that sense of wonder, debating what makes equations great therefore re-educates us about the fundamental nature of science, and knowledge, itself.
The 20 greatest equations
The following equations are listed in order of the number of people who proposed them. The first two received about 25 mentions each out of a total of about 120; the rest received between two and 10 each. Equations are given, where appropriate, in their most common form.
Maxwell’s equations:
∇⋅D = ρ
∇⋅B = 0
∇ × E = –∂B/∂t
∇ × H = ∂D/∂t + J
where D is the displacement field, E is the electric field, B is the magnetic-flux density; H is the magnetic-field strength, ρ is the free charge density and J is the free current density.
Euler’s equation: eiπ+1 = 0
Newton’s second law: F = ma
Pythagoras’s theorem: a2 = b2 + c2
Schrödinger’s equation: HΨ = EΨ
E = mc2
Boltzmann equation: S = kInW
1 + 1 = 2
Principle of least action: δS = 0
De Broglie’s equation: p = h/λ
Fourier transformation
Einstein’s field equations for general relativity: Gμν = 8πGTμν
Earthquakes occur because pressure builds up as sections of the Earth’s crust move relative to one another. These sections, known as continental plates, meet at “fault lines” and the resulting movement of mass can lead to changes in the local gravity.
Imanishi and co-workers made gravity observations at three locations, Esashi, Matsushiro and Kyoto, located approximately 373, 771 and 1040 kilometres away — as measured in a straight line — from the epicentre of the Tokachi-oki earthquake (figure 1). Tokachi-oki was a “thrust fault event” that occurred where the Pacific plate subducts beneath the North American plate. Thrust earthquakes are ideal for studying seismic gravity changes because they vertically displace adjacent blocks of mass and produce permanent changes in the gravity field around the epicentre.
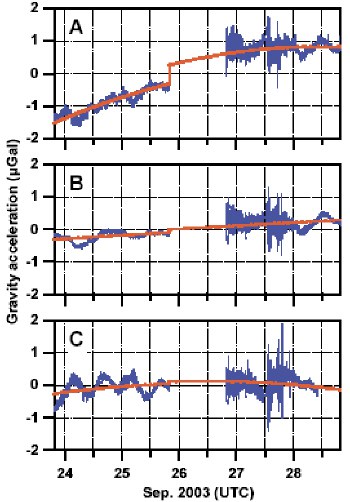
Gravimeters are sensitive to both vertical displacements of the surface and density variations beneath the surface. Imanishi’s team looked at how the gravity measured by their instruments changed before and after the earthquake and found a positive offset in the data (figure 2). A change of 0.575 microgals was recorded at Esashi, with smaller changes being seen at the other two stations. However, the Earth’s gravity is about 9.8 x 10⁸ microgals, so the largest relative change recorded was just 1 part in two billion.
To achieve this level of precision the geophysicists had to allow for tidal effects caused by the Moon and Sun, as well as for the rotation of the Earth itself. They also discarded measurements obtained immediately after the earthquake because the high-frequency seismic signals saturated the gravimeters and rendered the data unusable. Finally, the team filtered out spikes caused by aftershocks and eliminated any drift in the instruments.
The data could now be used to “ground truth” data from satellites such as the Challenging Minisatellite Payload (CHAMP) and the Gravity Recovery and Climate Experiment (GRACE).