The old adage “seeing is believing” is as relevant today as it was 2000 years ago for the famous doubting Thomas. What we mean by seeing, however, has changed. Science would not have come as far as it has if researchers had relied solely on their eyes to study the world. But we have become used to extending our vision with all sorts of techniques, from gamma-ray astronomy to ultrasound. The resulting images or, even better, movies can enhance understanding, inspire new theories and focus discussion. And in industry, this progress can be directed to optimize a wide range of processes, from the design of jet engines to the growth of carrots.
One of the best ways to capture these images is to use tomography, which allows us to see the inside of an object without inserting probes or sensors. Tomography is an imaging technique that uses a physical phenomena, such as X-rays or a magnetic field, to produce a picture of a slice through an object. It is best known in medical applications, where the spectacular details provided by computer-assisted tomography (CAT) scanners have become valuable and widespread diagnostic tools. The aim of industrial-process tomography is to transfer similar technology to the pipes and vessels in processing plants.
Inside industry
Industrial-process tomography began in the 1930s when much attention was paid to resistivity sounding. This technique involved passing currents through the ground to determine the location of mineral deposits and geological structures, and geophysical exploration remains an important application of tomography today. But it was not until about 50 years later that people began to investigate low-cost methods to image the flows in pipes and vessels found in manufacturing. This work was pioneered by researchers at the University of Manchester Institute of Science and Technology (UMIST) in the UK and the Morgantown Energy Technology Center in the US.
The challenge of tomography is to construct an image of the contents of a target, such as a pipe, using only measurements taken from the outside. From an image of the mixture of oil, gas and water flowing in a pipeline from the North Sea, for example, we can determine how much of each component is present. Metering such multiphase flows can be incredibly difficult because each element might be travelling with a different velocity. The flows can also be turbulent, which means there is little hope of solving the necessary equations.
Tomography offers opportunities in both metering such flows and understanding their dominant physics. There is financial incentive too – global oil production is about 75 million barrels per day, which amounts to approximately $2.25bn. Just keeping track of how much is produced is a difficult task. Furthermore, in some oil wells the water that is also extracted through pipelines must be treated before it can be disposed of. Images of the proportional flow rates inside these pipes can therefore provide a crucial indicator of potential environmental damage.
Indeed, at any stage from the oil well to the consumption of petroleum spirit in a car, an increase in efficiency of just 1% would reduce costs enormously, while easing the demand on oil reserves. Hugh McCann and co-workers at UMIST are currently using tomography to map the key chemical species inside an internal combustion engine, with the aims of reducing emissions and developing more efficient engines.
But it is not just the oil industry where process tomography has applications. A uniform and consistent product is often essential for commercial success, and images from the inside of mixing vessels can determine when the contents are of even quality. On food production lines, for example, defects in fruit can be automatically detected. Tomography can also be used to improve product safety by, for example, allowing researchers to inspect jet engines or nuclear reactors for internal flaws and cracks that are not evident from their surfaces. Potentially harmful leaks from waste pipes can also be located, enabling repairs to be carried out quickly.
These applications of tomography are all well and good, but how do we actually go about achieving them? Medical imaging is very well developed, so it might appear that we can just take medical tomographs and position them round industrial vessels. But there are many barriers that prevent this simple transfer of technology. The first is skin. Humans are covered by a skin that is translucent, whereas the skin of an industrial vessel is often stainless steel or thick plastic. It is the basic physical properties of these materials that restrict our ability to take a peek inside, and which determine the imaging methods that we can use.
Ironically, it is common practice to use high-energy radiation such as X-rays and gamma rays to probe inside a human patient, where it is accepted that the gain in diagnostic information outweighs the minimal health risk. In a factory environment, however, there are strict regulations that control the use of high-energy radiation, and this adds considerable cost to the installation of X-ray or gamma-ray instruments. Although high-energy instruments are used – such as X-ray photography for imaging the concentrations of seasoning in potato-crisp factories – they are not common.
Seeing with sound
Ultrasound tomography is also well known in medical applications, particularly the wonderful pictures of babies inside the womb. Ultrasound is very safe, and the high-quality images that it produces are possible because body tissue – being largely composed of water – gives just the right amount of reflection and transmission at ultrasound frequencies. Many industrial processes also involve material that is suspended in water. In processing minerals from a mine, for example, crushed ore is suspended in water, and many food products, such as yoghurt, are ultrasound-friendly colloids or dispersions. Why, then, is ultrasound not used more?
The answer is simple. There is no need to image processes that contain a homogeneous liquid because these can be dealt with using traditional, non-tomographic instrumentation. The situation is much more interesting when there is a mixture of solids that are suspended in a liquid (a slurry). Slurries are a very convenient method of transport and form the basis of many mineral-processing plants.
Malcolm Povey in the department of food science at the University of Leeds in the UK has done much to promote the use of ultrasound in food processing, and has developed techniques to study the formation of creams and the stability of colloids. These techniques have also been exploited commercially and involve measuring the horizontal velocity and attenuation of ultrasound waves in a suspension as a function of height.
Ultrasound reflections are also used by the oil industry to image gas bubbles in a liquid. Like much of the research into industrial-process tomography, the details are commercially sensitive but the method basically involves placing transducers round a pipe. One transducer is activated to generate a signal, and the time it takes the signal to be reflected off all the other transducers is recorded. This then activates another transducer and the process is repeated, which enables the length of the signal’s flight path to be calculated. By combining all the signals, the location of air-water interfaces can be determined.
This technique works well when the number of bubbles, or interfaces, is small. But in practice there are always a great number of them, including bubbles that are too small to be seen optically. These multiple interfaces produce a much larger scattering radius for ultrasound and cause havoc with reflected-ultrasound tomography. Similarly, imaging of dense slurries and multiphase flows is not yet within practical reach because of the many interfaces of these systems. Capacitative vision
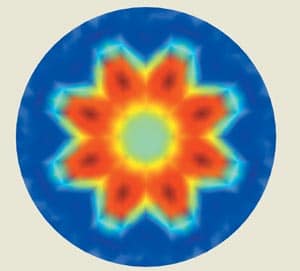
By far the best way to image industrial processes is to exploit our understanding of electromagnetism. Several electromagnetic approaches exist that are faster, cheaper and smaller than their X-ray and gamma-ray counterparts. Moreover, they do not involve ionizing radiation. To understand how these techniques work, suppose that solid particles, such as custard powder, grain or coal dust, are blown along a plastic pipe. An electrostatic field can be used to interrogate the contents of the pipe because it will be perturbed by the dielectric properties of the particles (figure 1). This is the basis for electrical-capacitance tomography, a technique brought to the fore in the mid-1980s by Maurice Beck at UMIST and Andrzej Plaskowski of Micromath in Poland.
In electrical-capacitance tomography a pipe is surrounded by a number of plate electrodes, which are contained inside an earthed shield so that only the contents of the pipe influence the measurements. The relative permittivity of the gas – which is directly related to the capacitance between the plates – can be taken as 1, while that of the solid may be 2 or more. The capacitance measured between every pair of plate electrodes in a pipe that is initially filled with air will change when a solid is introduced to the pipe. In fact, we can use Maxwell’s equations to calculate the capacitances for known configurations of air and solid, and, with the right mathematical techniques, it is possible to work in reverse. In other words, once we know the capacitances, we can work out where the solid is within the pipe.
This is known as an inverse problem, and is the central and most challenging step in tomography (see figure 2). The difficulty can be summarized as follows. Add or subtract some solid from the pipe and the capacitances change comparatively little. But a small error in a capacitance measurement could correspond to a large change in the image of the solid in the cross section. Furthermore, two small pieces of solid that are close together might be indistinguishable from a single larger piece, and resolving this problem requires taking measurements in quick succession over a long period of time.
Tomography itself can only get us so far, and to obtain better pictures we need to apply a bit of intelligence and think about what we know about the image before we consider the measurements. For example, there might only be two possible values of the permittivity, corresponding to air and solid. Or perhaps there is just one interface in the pipe, with solid at the bottom and air above. Considerations such as these allow modelling skills to be utilized to the full, which is usually tackled by multidisciplinary teams that have expertise in process engineering, physics and mathematical modelling. The more a priori knowledge we can include, the better the image we can derive.
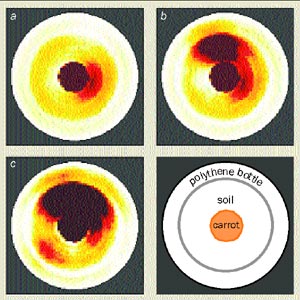
The proof of the pudding is, of course, in the eating, and electrical-capacitance tomography has been put to work in some important process operations. High imaging rates have been used to image gas bubbles in a liquid, while Henri Tapp and co-workers at the Institute of Food Research in the UK were able to distinguish the distribution of water in the soil surrounding a carrot (figure 3). Water has a very strong permittivity contrast to soil, which makes electrical-capacitance tomography an ideal detection system. As more salts are dissolved in the water, however, its conductivity increases and currents begin to flow. These currents make it more difficult to use an electrostatic field to interrogate the system.
Impedance tomography
The physical properties of industrial processes vary considerably, and there are many situations where components conduct electrical current and cannot therefore be imaged using electrical-capacitance methods. But all is not lost. In these cases it is possible to probe the interior of a vessel by injecting currents and then measuring the voltages at its walls with electrodes. This technique is called electrical-impedance tomography, which is basically the inverse problem of determining the conductivity or permittivity of an interior from exterior measurements.
Electrical-impedance tomography is used by geophysicists to map mineral deposits and probe oil wells, and by medical physicists to image the heart and lungs. Researchers at Sheffield University in the UK and Rensslaer Polytechnic Institute in the US have been particularly active in this area since the early 1980s, and the technique has benefited from collaborations between groups working in different fields – particularly in medical and process tomography. Marko Vauhkonen and Jari Kaipio at the University of Kuopio in Finland lead a team that has transferred its skills in medical imaging to industrial applications, sometimes working with the current author.
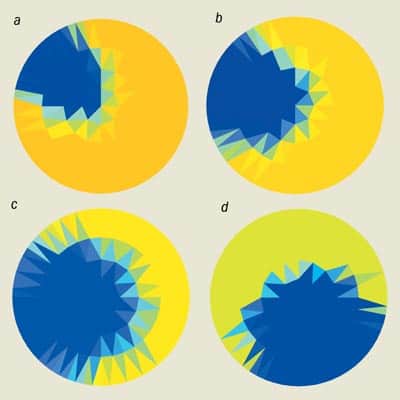
Several studies using electrical-impedance tomography have been completed on mixing vessels – common pieces of equipment in process industries that consume a lot of power. By imaging a blob of saline as it is stirred and dispersed within a mixing tank, the rotation and spread of the saline region can be clearly seen (figure 4). This allows the performance of the mixer and the progress of the mixing to be judged.
Newer on the industrial scene is magnetic-induction tomography, which has the advantage over electrical capacitance and impedance tomography in that it does not require electrodes. Instead a magnetic field is induced within an object, where it is perturbed by small “eddy” currents. The magnetic flux is measured by external coils, from which the conductivity inside the object can be calculated. Tony Peyton at Lancaster University in the UK has developed many interesting ideas based on magnetic induction, including monitoring the flow and crystallization of molten steel during continuous casting. Along with Tapp, he is also developing a scanner for measuring body composition that combines induction tomography with an optical imaging technique called photonic scanning. This is an impressive example of sensor fusion, and the technique could be used to measure the fat composition of meat products at all stages in production, from livestock to pork pies.
A matter of cost
Industrial-process tomographs seldom produce the fine detail that is seen in medical images. While such detail would be welcomed with great enthusiasm for some aspects of processing, such as the nano-production of particles designed for drug delivery, even coarse images are a remarkable improvement on the blunt-instrument approach of bulk measurements. A low-resolution image of the distribution of contents within a vessel can still be very informative, but more importantly the image is not the final product. Monitoring and controlling a process should be undertaken automatically, which can be achieved by linking tomographic images to process-control software. High-resolution images would provide so much data that they would be difficult to handle. Ideally, tomography would provide control variables that are derived either from the image or from the signals used to form an image. In other words, the image stage could be short-circuited.
But there is a much more important reason why industrial images have lower resolution than those in medicine – cost. Tell a plant manager that they will be able to reduce their operating costs while increasing productivity and consistency and they will be interested. But mention what the necessary tomographic instrument and control system will cost and that interest will disappear. For process tomography to be widely accepted by industry it is essential that installation and operating costs are minimal. And they can be. Whereas medical scanners are known to be expensive but essential for patients’ needs, it is not so well known that industrial tomography systems are designed to be low cost.
An example of a low-cost industrial tomograph might be an electrical-impedance system that consists of a handful of electrodes. Once these were fitted, an informative image could be constructed from about 100 measurements. This contrasts with medical scanners that might use 100 x 106 X-ray intensities to form a detailed image of the human body. The key question is, can we learn enough through just a few measurements to justify low-resolution tomography? There are those of us who say yes, and we are developing and demonstrating instruments and software. But like the basic concept of tomography, further progress is very much a matter of “watch this space”.