Russia’s first lunar mission in decades ended in failure on Saturday when the craft crashed into the Moon. The Russian space agency Roscosmos said it lost contact with the Luna 25 spacecraft as it was entering a pre-landing orbit. The agency said it would now investigate the reasons behind the crash.
Launched from the Vostochny Cosmodrome on 10 August, Luna 25 was Russia’s first lunar landing in almost half a century, the last being Luna 24, which landed on the Moon on 18 August 1976 and successfully returned lunar samples back to Earth.
Luna 25 was planning to land in the South Pole region of the Moon where it would have studied the lunar surface with its eight instruments that included cameras and spectrometers.
On Friday, however, Roscosmos declared an “emergency situation” as the craft was entering a pre-landing orbit. “The apparatus moved into an unpredictable orbit and ceased to exist as a result of a collision with the surface of the Moon,” Roscosmos noted in a statement.
Roscosmos said that an “inter-departmental commission” has now been set up to investigate the reasons behind the crash.
“We are reminded that landing on any celestial object is anything but easy and straightforward,” noted former NASA head of science Thomas Zurbuchen on X, formerly known as Twitter. “Just because others managed to do it decades ago, does not guarantee success today.”
Russia’s landing attempt comes just days before India will try to put a lander and rover on the Moon. The Chandrayaan-3 mission consists of the Vikram lander that contains a six-wheeled rover named Pragyaan, and is currently scheduled for touch down on Wednesday.
Researchers from Sandia National Laboratories (SNL) and Texas A&M University in the US have observed cracks in a metal becoming shorter. The unexpected finding – cracks normally grow longer – upends theories of fracture in metals and could help in the design of materials that “heal” their own internal damage.
When metals repeatedly undergo stresses and strains, microscopic cracks begin to form. These cracks are a type of fatigue damage, and over time, they grow and spread until they eventually cause the structure to fail – often unpredictably.
Such growth had been assumed to be irreversible, but researchers led by SNL materials scientist and engineer Brad Boyce found that this isn’t necessarily true. In their study, they used a specially modified electron microscope that allowed them to strain nanoscale samples of platinum repeatedly while observing what happens inside them. As expected, they saw nanoscale fatigue cracks appearing early on in the experiment. Unexpectedly, however, they also saw the ends of cracks fusing back together roughly 40 minutes later.
“Cracks were only ever expected to get bigger, not smaller,” Boyce says. “Even some of the basic equations we use to describe crack growth preclude the possibility of such healing processes.”
Crack flank cold welding
The SNL team wasn’t purposefully looking for this effect when the experiment began, but after observing it, members identified the damage reversal process, or “self-healing”, as a form of cold welding that occurs at the flanks of cracks. This effect is induced by a combination of local stress and grain boundary migration, and Michael Demkowicz, a professor of materials science and engineering at Texas A&M, predicted in 2013 that it was possible.
“When the microstructure of the material changes, it can push together the opposing forces of a crack,” Demkowicz explains. “If those faces are clean, they can bond and ‘heal’ via cold welding.”
While researchers have fabricated self-healing materials before, these have mainly been made of plastic, not metal. Demkowicz, however, calculated that under certain conditions, metals should be able to weld shut cracks created by fatigue damage. “It proved difficult to come up with an experiment that could test my prediction, but the SNL researchers, who were in fact working on understanding general damage evolution, serendipitously ended up observing the process that I’d theorized.”
In the near term, Demkowicz tells Physics World that the team’s findings will help improve theories of fractures in metals. In the longer term, they might lead to new strategies for designing metals that resist damage.
For this study, which is detailed in Nature, the researchers performed their measurements in a vacuum, so it is unclear whether the crack healing can also occur in air. The researchers would now like to find out if this is possible.
“What a relief,” said Susannah Glickman. A PhD student at Columbia University in New York, she had just successfully defended her dissertation on the history of quantum computing, and had morphed into Dr Susannah Glickman. Her thesis, as she wrote in the introduction, explored “how quantum computing went from the theoretical fringes to a brick and mortar set of institutions”.
I’m guessing, but I imagine hers is the first PhD in the history of quantum computing. Most historians who study technology generally investigate the origin and development of something in the past, be it telephones, engines or medical devices. But Glickman’s thesis – entitled “Histories, Tech, and a New Central Planning” – explores how and why the US invested tens of billions of dollars, launched various federal policies and programmes, and indeed created entire industries devoted to a technology whose applications lay entirely in the future.
As an undergraduate at Reed College in Portland, Oregon, Glickman did a joint degree in mathematics and anthropology. For her undergraduate project in 2015 she worked with a maths professor writing algorithms for quantum computers. But she was baffled that anyone would want to write algorithms for devices that did not yet exist – and may never even do so. When she posed that question to her supervisor, he couldn’t give her a satisfactory answer.
Turning speculation into solutions
Glickman began her PhD at Columbia in 2016, still brooding about the fact that an entirely speculative technology could inspire such a huge industrial infrastructure and such far-reaching federal programmes and initiatives – the “central planning” of her title. The answer, she discovered during the course of her thesis, comes in two parts.
The narrative that investing in technology is good for the national interests has been a success for many decades
The first is the notion – strongly promoted by scientists and politicians alike – that the development of all technology follows a “natural course” and any nation that ignores this fact will endanger its global power and security. As Glickman describes in her dissertation, this narrative was used to push America’s development of semiconductors, which in the 1970s were said to be vital to keep the US ahead in the Cold War. Later, in the 1980s, they were needed to staunch the country’s decline relative to Japan, and in the 1990s it was to support encryption devices.
The narrative that investing in technology is good for the national interests had, in other words, a long track record of success. Hardly surprising, then, that those with a vested interest in quantum computers used the familiarity and persuasiveness of this narrative to give these devices the hard sell too. In doing so, they had to challenge the more neo-liberal idea that any technology should be left to develop at its own pace.
Glickman’s template for this process is the semiconductor industry’s use of Moore’s law, which is named in honour of Gordon Moore. As the co-founder of tech giant Intel, he famously predicted in 1965 that the density of transistors on a microprocessor would double every year (a figure later revised to every two years). Clever public relations extrapolated what was essentially a rule of thumb into an iron “law” demonstrating the inevitability of smaller and smaller computer chips. Woe to the US, it seemed, if it did not invest heavily in the technology. The resulting massive investments, Glickman showed, made that extrapolation self-fulfilling. Her dissertation treated the development of quantum computing as the same basic process, but on steroids.
Tech investigator Susannah Glickman says that studying quantum computing has made her a different kind of historian. (Courtesy: Susannah Glickman)
The second part of Glickman’s answer has to do with the extraordinary claims of what quantum computers would do in the future. Such devices, their backers said, would solve hitherto insoluble problems like protein folding and optimizing nitrogen fixation. They would crack most encryption methods, and would develop uncrackable ones. Richard Feynman, John Wheeler and other prominent physicists who spoke about quantum computing’s potential seemed to ratify the promises, helping to convince federal administrators to take them seriously. Quantum computing, writes Glickman, was held up as “revolutionary, era-defining”.
Glickman’s dissertation does not take a stand on whether these narratives or promises are true or false. Rather, her aim is to describe their role in creating the political, economic and industrial environment in which a massive infrastructure, political programmes and planning, and plentiful funding sprang up around a still-speculative technology.
In her research, Glickman was startled by how obsessed quantum computer advocates are with its history, often saving boxes of photographs, stacks of notes, and caches of e-mails. “I knew the historians would come knocking,” said one of her interview subjects. From my experience, that’s in sharp contrast to other kinds of scientists, who keep only reprints, trash all their e-mails, and view history as last year’s journals. But quantum computing practitioners were, Glickman writes, if anything “too excited about documenting their own histories,” for such documentation can distort and disguise history, obscure ambiguities, erase dead ends, and encourage over-the-top claims.
One promoter of quantum computers told Glickman a holy-grail-like story about how the history of technology began with fire and has culminated with quantum computing. Another related a metaphysical tale of how just as the quantum world is the ultimate reality and the classical world derivative, so quantum computing is the natural way and classical computing its imperfect predecessor.
The critical point
Glickman’s PhD was not a straightforward story about technology developing in its own special ether, but as much about US history, political economy, industrial competition, philosophies and myths
Glickman’s PhD was also unusual in that the committee before whom she had to defend it consisted of an anthropologist and three historians who specialized in US history, political theory and business. This diversity was due to the fact that her dissertation was not a straightforward story about technology developing in its own special ether, but was as much about US history, political economy, industrial competition, philosophies and myths. “I had to adapt to the subject matter,” she told me. “Studying quantum computing made me a different kind of historian.”
Glickman is now an assistant professor in the history department at Stony Brook University, where she is working on an interdisciplinary project lying at the intersection of liberal arts and quantum and AI technologies. But the thoroughness of Glickman’s PhD made me wonder whether most historians haven’t been overlooking these features in past technologies. Her dissertation on the history of a future technology suggests that historians of past technologies will have to become different too.
A thermal imaging system that uses machine learning to disentangle the information contained in infrared images has been unveiled by researchers at Purdue University in the US. Dubbed HADAR, the system could allow passive thermal imagers to create images that appear as if they were taken in broad daylight – according Zubin Jacob and colleagues.
Our ability to detect and classify images in low-visibility and night-time conditions has been transformed by technologies such as sonar, radar and LiDAR. These systems involve sending out a signal (sound, radio, light etc.) signal and detecting reflections. However, this makes it difficult for multiple versions of the same system to be used in close proximity without interference occurring. This makes these technologies unsuitable for some emerging technologies like self-driving vehicles.
Thermal imaging offers a possible solution to this problem, since it can passively observe night-time scenes using the infrared radiation emitted by objects. However, images taken by conventional infrared cameras tend not to have fine features and instead appear blurry. This makes such cameras unsuitable as replacements for technologies like LiDAR.
Scattered radiation
“The key reason for ‘blurry’ thermal images is that thermal imaging collects both direct emission of the targets and the scattered thermal radiation of other environmental objects,” Jacob explains. “Direct emission is usually 10 times stronger than the scattered signal, but the former is textureless while the latter carries the textures.”
As an example of this effect in the visible range, picture a light bulb. While the bright light it emits when turned on does not contain any discernible details of textures on the bulb’s surface, these details will appear when the bulb is illuminated by another light source.
In the new study, Jacob’s team developed a far more advanced approach to thermal imaging. Called heat-assisted detection and ranging or HADAR, it is precise enough to pick up geometric textures in weak, scattered infrared signals.
Hyperspectral imaging
“We achieve this goal using thermal physics and machine learning, combined with spectral resolution in thermal images,” Jacob explains. “HADAR uses hyperspectral thermal imaging which takes thermal images of the scene for hundreds of different colours in the thermal infrared.”
In our own eyes, colours in the visible spectrum are processed by a combination of red, green, and blue photoreceptors. In comparison, HADAR builds up infrared images based on three key attributes of the objects it observes. These are an object’s temperature (T); emissivity (e) – which varies with material composition; and texture (X), which generates unique patterns of thermal radiation.
All of these values can be gleaned from the infrared light emitted by a scene, but are initially mixed together in the cluttered raw data. But using machine learning, the team’s “TeX vision” approach can disentangle the three key attributes to recover the weak geometric features in infrared signals that are typically blurred out.
TeX colours
This is done using an algorithm that assigns different “colours” to different parts of the scene. Since different materials can be identified by a combination of their T, e, and X values, Jacob’s team could build up a semantic library of suitable colours.
“The semantic library comes with a colour for each semantic label, for example, blue for water, green for tree, and yellow for sand,” Jacob explains. “Colours for materials are purely determined according to their daily visual appearance, to mimic daylight optical imaging.” With this approach, HADAR could image low-visibility and night-time scenes as they appear in broad daylight.
The researchers acknowledge there is still some way to go before HADAR becomes widely available, especially since the hyperspectral thermal imagers currently available are bulky, slow, and expensive. Yet through further research, they are hopeful that these challenges could be addressed in the next few years – leading to high-speed, compact and lightweight thermal imagers for HADAR.
If achieved, the technology could open up new opportunities in a wide array of useful applications. “We think HADAR can be useful for autonomous navigation, robotics, smart healthcare monitoring, especially at night,” says Jacob. “Many wild animals are only active at night where regular cameras do not work, we think HADAR may be useful for wildlife monitoring as well.”
In an amazing experiment done at the University of California, Berkeley, researchers have reconstructed music from listeners’ brain activity. Robert Knight and colleagues had 29 people listen to Pink Floyd’s “Another Brick in the Wall, Part 1” while measuring their brain activity. The subjects were participating in a study of epilepsy and already had arrays of electrodes implanted in their brains.
The researchers focused on areas of the brain that are known to be involved in our perception of music. An artificial intelligence (AI) system was trained to recognize how people’s brains responded to different elements of the music such as rhythm and pitch. Then another AI system used this information to reconstruct a recognizable version of the Pink Floyd song.
Writing about the research in Scientific American, Lucy Tu points out that the study could help scientists develop systems that convert brain waves into speech, which would be a boon to people who have lost the ability to speak. As to why the team chose that particular song, Tu reports that the researchers are big fans of Pink Floyd.
Art in space
That Pink Floyd song was released in 1979, but two years earlier two very special phonographic discs were launched into space on board NASA’s Voyager spacecraft. As well as holding encoded audio recordings and images of life on Earth, the disc was etched with instructions for playing the recording and basic information about the location of Earth and the solar system.
Now, the Canada-based physicist Samuel Peralta plans to do a similar thing for visual art by launching the Lunar Codex project. The idea is to load a Nanofiche with images of about 30,000 works of art and send the Nanofiche to the Moon.
So what exactly is a Nanofiche? It is a proprietary storage system that uses a sharply focussed laser to etch images onto a nickel-based substrate. These analogue images are expected to last billions of years in outer space; tens of millions of years on the surface of the Moon; and tens of thousands of years on Earth.
It’s not clear to me how colour images are going to be stored on a Nanofiche, which is a black-and-white technology as far as I can tell. But if you want to investigate this further, a good place to start is this article in The Guardian by Dorothy Dunn.
Brain–machine interfaces (BMIs) provide direct electrical communication between the brain and external electronic systems. As such, BMIs offer potential to restore impaired functionality in patients with paralysis or neurological disorders, by using brain activity alone to directly control prostheses or computer programs, for example, or to modulate nerve or muscle function.
Improvements in function and performance are needed, however. Today, most conventional BMIs measure neural activity at the brain’s surface, which provides limited spatial resolution. The ability to record single neuron activity from deep-brain regions could dramatically improve future BMI technology.
Measurement of single neurons in deep-brain regions is currently achieved by surgically implanting probes into the brain. This is far from ideal, as surgery can damage brain tissue, as well as cause inflammation and scarring, which rapidly degrade device performance. Clearly, there’s a need for a less invasive and longer-lasting approach.
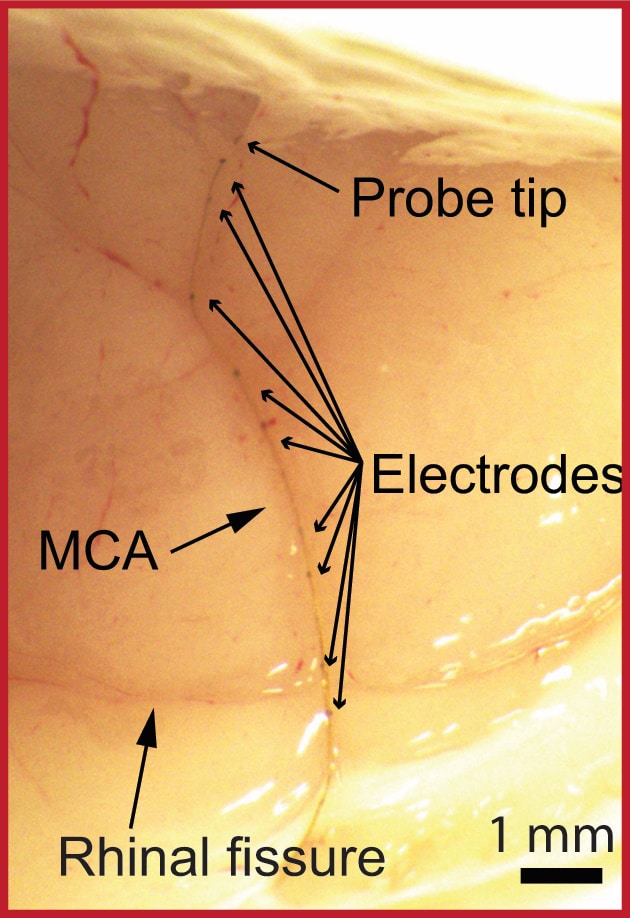
Researchers at Stanford University and Harvard University have developed such a device: an ultrasmall and ultra-flexible micro-endovascular (MEV) neural probe that can be that can be implanted into sub-100-µm-scale blood vessels in the brains of rodents without requiring open-skull surgery. Instead, the device uses the brain’s vascular system as a probe delivery route, inserting the MEV probes via flexible microcatheters.
First author Anqi Zhang of Stanford University. (Courtesy: Anqi Zhang)
After inserting the microcatheter into the targeted vessel, the probes are injected into deeper vasculature by saline flow. The probes advance smoothly within the microcatheter into the vessels and remain extended without buckling. The researchers explain that the device’s mesh-like structure relaxes and unfolds after injection, allowing the electrodes to adhere against the inner vessel walls in a similar manner to the deployment of a vascular stent. Once in place, the probe can record neuronal signals across the blood vessel wall without damaging the brain or vasculature.
Anqi Zhang of Stanford University and Charles Lieber, formerly at Harvard University, explain that “the metabolically active central nervous system requires a dense vascular network, so the average neuron is less than 20 µm from the nearest blood vessel. This vasculature thus offers recording probes access to any brain region without damaging the recorded neural circuits.”
Measuring individual neurons
For their study, reported in Science, the researchers created probes containing sixteen 80 µm-long platinum electrodes, distributed over a length of 1 cm to examine multiple brain regions. They initially tested the ability of the MEV probes to record activity in the brains of anaesthetized rats, reporting well-defined signals across the 16 channels.
In vivo recording recording Micro-endovascular probe in the middle cerebral artery of a rat brain. (Courtesy: Anqi Zhang, Stanford University)
The team then induced local seizures in the animals by intracortical injection of penicillin to create epilepsy models. The probes accurately recorded bilateral spikes and spike-wave complexes associated with seizure activity following the injection. Simultaneous recording from all 16 channels demonstrated the ability of the MEV probes to locate and track the seizure foci.
To study any short-term effects of the MEV probes, the researchers used laser Doppler flowmetry to monitor cerebral blood flow before and immediately after probe injection. They found that probe implantation did not substantially impact cerebral blood flow. Investigation of chronic effects showed that none of the rats experienced any neurologic deficits, the integrity of the blood–brain barrier was well preserved, there was no increase in vessel wall thickness, and no significant immune response.
“These observations not only demonstrate the minimal invasiveness of the MEV probes, but also indicate major advantages in chronic electrophysiology recording, as the accumulation of glial scar tissue near the brain electrodes is known to cause electrode failure in clinically relevant chronic settings,” the team explains.
The researchers point out that their probes can be selectively implanted into small vessel branches that are not accessible to any existing microcatheters, thus enabling neural recording across vessel walls at single-cell resolution. Zhang tells Physics World that the team plans to improve the probe design and materials to enable better navigation into different vessel branches. In the long term, the researchers hope to use the probes to study the brain and treat brain diseases, and achieve clinical translation for applications in neurology and interventional radiology.
Writing in an accompanying commentary in Science, Brian Timko of Tufts University School of Engineering says that this ability to achieve non-invasive, single-neuron recordings is important for studies of deep-brain regions such as the medial temporal lobe, where activity is not spatially clustered and therefore only identifiable at the single-neuron level. He suggests that future studies could answer long-standing questions about how memories are stored and retrieved.
Timko notes that these endothelial probes represent a general platform that in the future could be broadened to incorporate localized stimulation devices. Such stimulation elements might also be used to electroporate the blood vessel wall, enabling localized drug delivery across the blood–brain barrier. He envisions that future development of endovascular probes might ultimately form the foundation for machine interfaces throughout the body.
A new study of data from the European Space Agency’s Gaia space mission claims to have found evidence of gravity acting contrary to the predictions of Newton and Einstein, but not everyone agrees that this is the smoking gun for a theory of modified gravity.
Observations of galaxies and galaxy clusters show that the gravitational forces binding these structures together are greater than those expected from the matter they contain. This has led physicists to predict the existence of dark matter, which is a hypothetical material that is invisible but interacts with normal matter via gravity. While dark matter has never been observed directly, it is included in the standard model of cosmology.
Modified Newtonian dynamics, or MOND for short, was developed in 1983 by Mordehai Milgrom of the Weizmann Institute in Israel as an alternative to models of dark matter. MOND seeks to explain the apparent extra gravity binding together galaxies and galaxy clusters by modifying the physics of gravity. In particular, MOND describes how gravity operates differently at very low accelerations.
Despite occasional successes for MOND, such as describing the motion of stars around galaxies, the evolution of open star clusters, and the survival of dwarf galaxies, MOND is not seen as a mainstream model. However, supporters of MOND point out that dark matter has yet to be observed directly, and that dark-matter models are ever changing as their predictions are excluded by experiments and observations. Proponents of dark matter, on the other hand, argue that MOND cannot yet explain many of the things that dark matter models can.
Binary tests
Stars separated by large distances in binary systems have long been considered objects that could put MOND to the test. This is because accelerations in such “wide binaries” are small enough that MOND is relevant, but dark matter is not expected to affect such systems.
Now, with Data Release 3 (DR3) from the Gaia astrometric mission, astronomers finally have the data to put MOND to the test in these binary systems. In a new paper published in The Astrophysical Journal, Kyu-Hyun Chae of Sejong University in South Korea has used statistics to analyse data describing the orbital motions of 26,500 wide-binary star systems, all located within 650 light-years of Earth. In particular, Chae calculated the gravitational accelerations of the stars around one another.
“A binary system is gravitationally bound, so it always experiences an internal gravitational acceleration in its orbit,” Chae tells Physics World.
Elliptical orbits
If the stars had perfectly circular orbits around one another, their gravitational acceleration would remain constant. In reality, they have elliptical orbits, meaning that their separation from one another and hence their gravitational acceleration changes. The binary stars in the study can range in separation from between 200 AU to 30,000 AU – where 1 AU is the distance from the Earth to the Sun.
The measured gravitational acceleration is exceptionally tiny. At separations of less than 1000 AU, the gravitational acceleration is greater than 10 nm/s2 and gravity is observed to act as predicted by Newtonian physics. However, at separations of more than 2000 AU, where the gravitational acceleration is on the order of 1 nm/s2, Chae says that his analysis reveals discrepancies in the acceleration, with its value being greater than what the models of Newton and Einstein predict. At more than 5000 AU, where the gravitational acceleration is less than 0.1 nm/s2, the difference is clearly seen.
Furthermore, Chae says that when one takes into account the external field effect – an integral part of MOND that describes how a much larger gravitational field, in this case that of the Milky Way galaxy as a whole, can affect a smaller gravitational system such as a binary star – the gravitational acceleration at wide separations is boosted by a factor of 1.4. This matches a prediction of a specific model of MOND called AQUAL, which was developed by Milgrom and the late physicist Jacob Bekenstein of the Hebrew University of Jerusalem.
“It is truly remarkable that when the external field effect is taken into account, the boost factor is about 1.4,” says Chae. “To me, this cannot be a coincidence.”
Mixed reactions
Reaction to Chae’s results has been mixed. Stacy McGaugh of Case Western Reserve University in the US, who is one of the world’s leading proponents of MOND, tells Physics World that he thinks, “we should be excited about the possibility of binary stars to provide a fresh and potentially decisive test. Chae shows a very clean result that is formally highly significant, so we should take it seriously.”
Nevertheless, McGaugh also urges caution about drawing conclusions so soon, citing other researchers who have made similar measurements similar to Chae’s but found no evidence for MOND. One of those is Indranil Banik of the UK’s University of St Andrews, who earlier this year led a team that analysed wide binaries from Gaia DR3 in search of MOND’s influence, but did not find any evidence for it.
“I disagree very much with the results of Chae,” Banik told Physics World.
Data analysis
Banik’s objections are related to the way the data have been analysed by Chae, and the lack of a strict cut-off on the uncertainty in the relative velocity of the stars in a binary system. In particular, Banik says that in his own work he quantified uncertainties in the measurements of the velocities of the stars and he only considered binary systems where those velocities are accurately known. “The failure to do so is the main problem with what Chae did,” says Banik. “So I am afraid there is no MOND signal in local wide binaries.”
Confirmation one way or the other could potentially come from follow-up work using different instruments. While Gaia DR3 provides the best quality data for a statistical analysis of many thousands of binaries, large observatories could follow-up on individual binary systems and measure their line-of-sight velocities and take deep images to confirm their separation.
Chae, for his part, is unperturbed by the criticism, and thinks that dark matter’s days are numbered.
“The evidence is already conclusive,” he argues. “There is no longer a need for a large amount of dark matter.”
When the materials scientist Ross Colman and colleagues read a preprint claiming that a material called LK-99 is a superconductor at room temperature and ambient pressure, they set out to replicate the result in their lab. But unlike other scientists doing the same thing, Colman’s group decided to share their work with the public in real time.
In this episode of the Physics World Weekly podcast, Colman – who is at Czechia’s Charles University – talks about the challenges of trying to reproduce someone else’s research and why the team was unable to replicate the observation of room temperature superconductivity.
Also in this episode, Australia’s chief scientist Cathy Foley talks about that country’s A$1bn national quantum strategy. Foley explains why international collaborations will play an important role in the development of quantum technologies and talks about her role as editor-in-chief of the journal Superconductor Science and Technology.
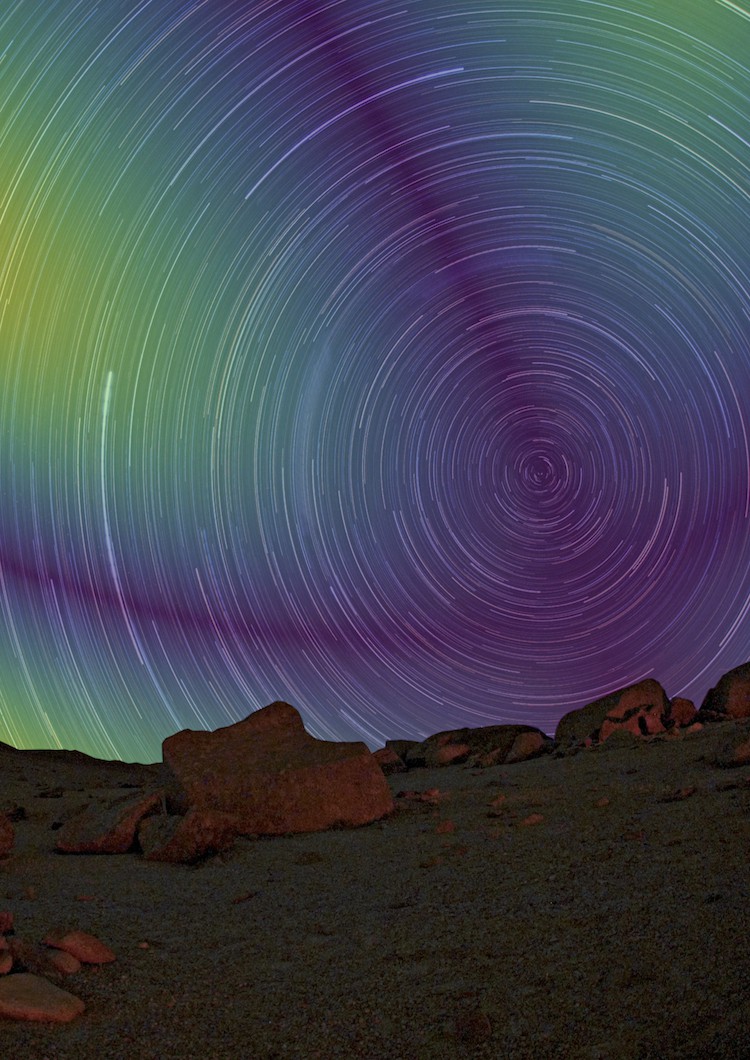
Overlay of a star-trail photograph, in which stars (white arcs) appear to rotate around the north celestial pole, and a numerical simulation of time-invariant polarization lines (dark lines) as measured by a polarimetric camera during daytime. Courtesy: Thomas Kronland-Martinet (CNRS/Aix-Marseille University), and ESO/B Tafreshi (twanight.org)
Can you tell which way is north just by looking at the daytime sky, without using a compass or GPS or even knowing the position of the Sun? Thanks to a new optical method, the answer could soon be “yes”. Developed by researchers at Aix-Marseille University in France, the method works by analysing the polarization patterns in scattered daylight. As well as aiding the development of alternative navigation techniques, it could help us understand how animals use physical phenomena to migrate.
At present, there are three main ways of identifying True North. One is to use the positions of the stars, as navigators have done throughout human history. Another is to rely on magnetic compasses. The third, most recent, method involves global navigation satellite systems such as GPS. However, each method has its drawbacks. Stars are only visible at night and in good weather. Magnetic compasses are easily affected by magnetic interference, including from natural sources such as iron-bearing rocks. And satellite navigation systems are vulnerable to jamming and hacking.
In recent years, researchers have turned to insects and migrating birds for fresh ideas about how to navigate using sparse magnetic and visual cues. Cataglyphis ants are known to use celestial polarization, for example, while migrating birds calibrate their internal magnetic compass by observing the rotation of stars around the celestial pole. Some birds may also use polarization to navigate during the day.
Skylight polarization
The new method, which the researchers have dubbed SkyPole, relies on skylight polarization, which occurs when particles in the atmosphere scatter light. Unlike colour or intensity, skylight polarization is invisible to the human eye, and it produces a distinct pattern that depends on the Sun’s position with respect to an observer on the Earth’s surface.
Since the Earth rotates around a north–south axis, an observer in the northern hemisphere will, over the course of a day, see the Sun trace out a path around the north celestial pole – that is, the point in the sky that corresponds to the intersection between the Earth’s rotational axis and the celestial sphere. Patterns in the degree of daylight polarization will therefore rotate around this pole during the day, just as constellations revolve around the North Star at night.
By collecting images of polarization patterns over time with a polarimetric camera, the researchers were able to pinpoint the north celestial pole at the intersection of “polarization invariances” – that is, the polarization measured between two distinct time periods.
“Contrary to previous studies, we do not compute the Sun’s position in our method, but directly use the skylight pattern as a navigational cue,” Kronland-Martinet explains. “More precisely, we consider time variation of the skylight polarization, which allows us to easily calculate the celestial pole’s position without having to process complex trigonometry calculus. What is more, we need no other information than polarization images, making our method very simple.”
According to the researchers, SkyPole could be used to calibrate compasses for inertial navigation systems that are subject to drift over time. It could also aid marine navigation by, for example, enabling the development of automatic polarimetric sextants. According to Kronland-Martinet, it could even become an alternative to satellite-based navigation. “While highly precise, [satellite navigation systems] can be easily blurred and spoofed and might not be the best candidate for when robust information is needed – for example, in autonomous vehicles,” he tells Physics World.
At present, SkyPole’s long data collection times make it unsuitable for instantaneous global positioning, but members of the team are exploring ways to make it faster. They report their work in PNAS.
The first direct, real-time observations of an ultrastable glass as it “relaxes” into a supercooled liquid have enabled researchers to quantify a previously mysterious process known as the glass transition. This transition plays a crucial role in numerous fields, including biomedical cryopreservation, drug synthesis, electronic device manufacture and tissue engineering to cite but a few examples. The work could also have implications for solar cells, which often have a coating of patterned glass.
Despite the ubiquitous nature of glass in modern technology and our everyday lives, we do not fully understand it. Though glasses appear solid, their structure is highly disordered, so they are sometimes regarded as liquids with extremely high viscosity. Other mysteries concern how liquids cool and transform into glasses, and vice versa when a glass is heated until it becomes molten. Is this glass transition a distinct thermodynamic state? Or is glass simply a liquid that has been supercooled – that is, one that retains its liquid properties despite being cooled below its freezing temperature?
The researchers chose to use an organic glass with the chemical name N,N′-bis(3-methylphenyl)-N,N′-diphenylbenzidinem because it transitions to a supercooled liquid state in a way that is similar to that of crystalline solids. In this type of transition, tiny areas of liquid phase form and then gradually grow bigger. This contrasts with conventional glasses, which transition to the liquid state throughout the volume of their structure without any clear divisions between different regions.
Liquid formation occurs on local, nanoscale regions
The Barcelona team had previously observed this process indirectly using nanocalorimetry, a technique that makes it possible to measure heat capacity in thin films of material. In the new work, which is detailed in Nature Physics, the researchers present a way of observing it directly.
To do this, they sandwiched the organic glass between two layers of a more rigid glass with a higher melting temperature. When they heated the organic glass layer to above its glass transition temperature, the mechanical stress in the softened supercooled liquid regions caused the outer glass layers to deform thanks to the difference in the thermal expansion coefficients between the glassy layers and the silicon substrate onto which the glass is formed. This deformation, which shows up as nanosized bumps, wrinkles and ridges that gradually become bigger, can be observed with an atomic force microscope (AFM).
“Since the formation of the liquid occurs on local, nanoscale regions, the surface corrugation we observed is also local and directly connected to the supercooled liquid beneath,” study team leaders Javier Rodríguez-Viejo and Cristian Rodriguez-Tinoco explain. “The technique allows us to build spatio-temporal maps of the transformation of a thin film glass into its supercooled liquid by directly measuring the distances between the liquid domains that appear. This process can be followed in real time.”
Rodriguez-Viejo adds that the glass transition they observed proved to be highly heterogenous, with large expanses between the emerging liquid regions. “This means the glass does not transform at once across the whole volume into the supercooled liquid, as we may expect for a conventional, liquid-cooled glass, but transforms over a time period that is a million times slower,” he explains. “Indeed, the process we have observed somehow mimics a nucleation and growth mechanism such as that occurring during the formation of a crystalline phase within a glass or the melting of a polycrystal.”
The team now aims to study the glass transition on smaller length scales and over shorter time periods, something that may require members to develop new AFM procedures and protocols. In the longer term, Rodriguez-Tinoco says that findings from the study could help improve industrial methods of glass patterning, which are used to make optical coatings and to control surface roughening in a way that enhances light output in organic solar cells.