This episode of the Physics World Weekly podcast features an interview with Michelle Oyen, who works at the intersection of materials science and women’s health. The biomechanical engineer and biophysicist tells Physics World’s Margaret Harris how a chance telephone call from an obstetrician piqued her interest in human reproduction, which is currently the main focus of her research on the development of new biomaterials.
Oyen is the inaugural director of the Center for Women’s Health Engineering at Washington University in St Louis, US. She explains why centuries of neglect of women’s health by the medical establishment makes such institutes essential to achieve health equality.
Oyen also talks about the recent medical scandal surrounding the misuse of some materials as vaginal meshes – which illustrates why it is crucial to develop medical materials that are specifically designed for women.
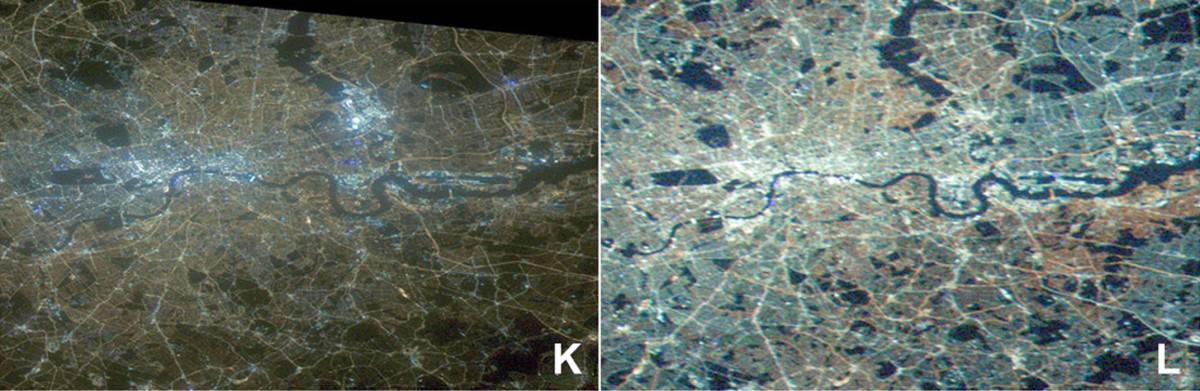
Light pollution blues: photographs of London taken on board the ISS in 2012 (left) and 2020 (right). The images show the whitening and brightening of the city. (Courtesy: A Sánchez de Miguel et al/Science Advances/CC BY 4.0)
The shift to LED street lighting is producing more blue-light pollution – an important trend that has not been noticed by the specialized satellites that monitor nighttime lighting. That is the conclusion of researchers in the UK, who have analysed digital photographs of Earth taken by astronauts on board the International Space Station (ISS). The scientists say that the shift to bluer light is having negative consequences for human health, animal behaviour and astronomy.
LEDs have been around for 60 years, but older devices operated towards the red end of the visual spectrum. In the 1990s, however, bright blue LEDs became available – winning their inventors the 2014 Nobel Prize for Physics. The ability to create bright blue LEDs quickly led to the development of white LEDs, which are becoming ubiquitous in many lighting applications.
Indeed, LED streetlights have begun to replace sodium lamps – which produce yellow light – in many European countries. As well as offering lower cost and higher energy efficiency than sodium, LEDs provide better colour rendering, which improves an observer’s recognition of illuminated objects.
Negative effects
However, researchers point out that this rollout has a darker side. Previous studies have shown that the amount of light pollution is increasing with the introduction of LEDs. Furthermore, this LED light is much bluer than sodium light and previous research shows that nighttime exposure to blue light can have negative effects on people’s circadian rhythm and sleep. There is evidence that blue light can change the behaviour of some insects and it also exacerbates the problem of light pollution on the night sky – making stars more difficult to see for both the public and astronomers.
Now, a team of scientists at the University of Exeter in the UK, led by Alejandro Sánchez de Miguel of both Exeter and Universidad Complutense in Madrid, Spain, has for the first time quantified the increase in blue light pollution in Europe.
“There’s no reason why we use LEDs that are so blue-rich,” Sánchez de Miguel tells Physics World. “Their energy efficiency is a bit better, but when dimming and directionality, as well as good lighting design, are considered, then that point is irrelevant.”
Astronauts’ photos
Typically, satellite data on nighttime lighting considers all wavelengths of visible light together and does not differentiate between red, green and blue. Sánchez de Miguel’s team instead used images captured by ISS astronauts using everyday digital single-lens reflex (DSLR) cameras and combined the images with data from satellite sensors. This builds on previous work by Sánchez de Miguel’s team, which showed that camera images from space capture colour and radiometric data better than Earth-monitoring satellites.
They compared camera images of Europe taken from the ISS in 2012 and 2013 with images taken between 2014 and 2020, when the LED revolution began to take hold. They found a clear increase in blue light coming from the continent. Of the European nations, the increase was most prominent in Italy, Romania and the UK, while the effects of blue-emitting white LEDs were least prominent in Austria and Germany.
Regarding the differences between nations, part of the reason is that some countries have older lighting that needed replacing more urgently, while for others Sánchez de Miguel sees it as a cultural difference.
Replacing old streetlights
“Italy is changing too fast,” he says. “I do not know well enough the reasons for Romania, but maybe it is because their street lighting was old, as happened with the UK.”
As a result of the study, Sánchez de Miguel believes that studies of nighttime light pollution have underestimated the potential harmful effects of LEDs, simply because up until now, all monitoring of light pollution with satellites has not been colour specific.
Ruskin Hartley, spokesperson for the International Dark-Sky Association, agrees. “Over the past 25 years, it is clear that Europe has got brighter and bluer in a rush to transition to energy-efficient LED nighttime lights,” he tells Physics World. “Unfortunately, the quality of the nighttime environment has suffered, and we continue to waste massive amounts of energy through wasted nighttime lights.”
Sánchez de Miguel points out that artificial nighttime light is considered a pollutant by the United Nations and says, “The best way of limiting it is by controlling its use. There are simple ways to do this in the [urban] planning phase, and also we have simple ways to measure it with DSLR cameras.”
Hartley agrees that some of the problems can be mediated by better planning and better lighting design. “When used with care and attention, a well-designed LED night light system has been shown to reduce light pollution and save energy,” he says. “We recommend that anyone considering an outdoor lighting project follow the joint IDA–IES Five Principles for Responsible Outdoor Lighting. A holistic approach to outdoor lighting will ultimately result in improved visibility, a healthy and undisrupted nocturnal habitat, and darker skies.”
Blood-oxygen saturation (SpO2), the percentage of haemoglobin in the blood carrying oxygen, is an important measure of cardiovascular function. Healthy individuals have SpO2 levels of roughly 95% or above, but respiratory illnesses – such as asthma, chronic obstructive pulmonary disease, pneumonia and COVID-19 – can cause these levels to drop significantly. And if SpO2 falls below 90%, this can be a sign of more serious cardiopulmonary disease.
Doctors usually measure SpO2 using pulse oximeters, non-invasive devices that clip onto the fingertip or ear. These typically work via transmittance photoplethysmography (PPG), in which the absorption of red and IR light is analysed to distinguish oxygenated from deoxygenated blood. But the ability to monitor SpO2 outside of the clinic, using the camera on an everyday smartphone, could allow more people to detect situations that need medical follow-up or keep track of ongoing respiratory conditions.
Researchers at the University of Washington (UW) and University of California San Diego have now shown that smartphones can detect blood-oxygen saturation levels down to 70%. Reporting their findings in npj Digital Medicine, they note that this was achieved using smartphone cameras with no hardware modifications, by training a convolutional neural network (CNN) to decipher a wide range of blood-oxygen levels.
In a proof-of-principle study, the researchers employed a procedure called varied fractional inspired oxygen (FiO2), in which the subject breathes a controlled mixture of oxygen and nitrogen, to slowly reduce their SpO2 levels to below 70% – the lowest value that pulse oximeters should be able to measure, as recommended by the US Food and Drug Administration. They used the resulting data to train the CNN-based deep-learning algorithm.
“Other smartphone apps were developed by asking people to hold their breath. But people get very uncomfortable and have to breathe after a minute or so, and that’s before their blood-oxygen levels have gone down far enough to represent the full range of clinically relevant data,” explains first author Jason Hoffman, a UW doctoral student, in a press statement. “With our test, we’re able to gather 15 minutes of data from each subject. Our data show that smartphones could work well right in the critical threshold range.”
Hoffman and colleagues examined six healthy volunteers. Each participant underwent varied FiO2 for 13–19 min, during which time the researchers acquired more than 10,000 blood-oxygen level readings between 61% and 100%. Alongside, they used purpose-built pulse oximeters to record ground-truth data via transmittance PPG.
At-home option: Smartphones can detect blood-oxygen saturation levels in a comparable range to standalone pulse oximeters, as shown here in grey and blue. (Courtesy: Dennis Wise/University of Washington)
To perform smartphone oximetry, the participant places their finger over the camera and flash of a smartphone. The camera records responses via reflectance PPG – measuring how much light from the flash the blood absorbs in each of the red, green and blue channels. The researchers then fed these intensity measurements into the deep-learning model, using four subjects’ data as the training set and one for validation and optimizing the model. They then evaluating the trained model on the remaining subject’s data.
When trained across a clinically relevant range of SpO2 levels (70–100%) from the varied FiO2 study, the CNN achieved an average mean absolute error of 5.00% in predicting a new subject’s SpO2 level. The average R2 correlation between the model predictions and the reference pulse oximeter was 0.61. The average RMS error was 5.55% across all subjects, higher than the 3.5% standard required for reflectance pulse oximeter devices to be cleared for clinical use.
The researchers suggest that rather than simply estimating SpO2, the smartphone camera oximeter could be used as a tool to screen for low blood oxygenation. To explore this approach, they calculated their model’s classification accuracy for indicating whether an individual has an SpO2 level below three thresholds: 92%, 90% (commonly used to indicate the need for further medical attention) and 88%.
When classifying SpO2 levels below 90%, the model exhibited a relatively high sensitivity of 81% and a specificity of 79%, averaged across all six test subjects. For classifying SpO2 below 92%, the specificity increased to 86%, with a sensitivity of 78%.
The researchers point out that, statistically, the study does not indicate that this approach is ready to be used as a medical device comparable with current pulse oximeters. They note, however, that the performance level seen from this small test subject sample indicates that the model accuracy could be increased by acquiring more training samples.
For example, one of the subjects had thick calluses on their fingers, which made it harder for the algorithm to accurately determine their blood-oxygen levels. “If we were to expand this study to more subjects, we would likely see more people with calluses and more people with different skin tones,” Hoffman explains. “Then we could potentially have an algorithm with enough complexity to be able to better model all these differences.”
Hoffman tells Physics World that the team does not have any plans to immediately commercialize this technology. “However, we have developed a testing plan and grant proposals that would enable us to test on a larger, more diverse group of subjects to see whether this proof-of-principle study is reproducible and potentially ready for commercially focused development,” he says.
When most of the world was dealing with the onslaught of the COVID-19 pandemic in 2020, which forced lockdowns and an intense effort to create the first vaccines, China was setting out to tackle another huge scientific issue of our time: the climate.
In a surprise announcement to the UN general assembly in September 2020, Chinese president Xi Jinping laid out the country’s plan to transition from one of the world’s biggest greenhouse gas emitters to a “net zero” carbon society by 2060.
The move came as a surprise to regional government officials in China who are still processing what the goal means and what policies they need to adopt to meet it.
In the 2022 Physics World China Briefing, we outline how China could achieve this ambitious goal via the roll-out of renewable energy, the installation of carbon capture, adding new usage and storage technologies to existing coal power stations along, perhaps, with a renaissance of nuclear power.
This year’s briefing takes a look at several other scientific areas that China is focusing on, not least quantum technologies and we examine a new upgrade to the Beijing Electron Positron Collider that when complete in 2024 will see the current collision rate triple and extend the maximum collision energy to 5.6 GeV.
The previous decade has also seen China excel in space, with the launch of several Moon missions. In the briefing we talk to Thomas Smith from the Institute of Geology and Geophysics Chinese Academy of Sciences about analysing some of the first lunar samples that have been brought back from the Chang’e-5 sample-return mission.
I came across a meme the other day about wind-powered ships, where people were poking fun at Oceanbird – an odd-looking vessel being developed by the Swedish freight firm Wallenius Marine and the KTH Royal Institute of Technology in Stockholm. Well, the ship might appear strange, but it’s no joke. Tests on a scale model are already being carried out and the ship could become a reality as soon as 2024.
With financial backing from the Swedish Transport Administration, Oceanbird forms part of the country’s Wind Powered Car Carrier project. It aims to build a sailing vessel that can transport 7000 vehicles across the Atlantic with 90% fewer emissions than a conventional ship running on “heavy” crude oil. Oceanbird certainly looks different, with four giant, 80 m-high sails that seem more like sleek aircraft wings.
Towering vertically above the ship’s deck, the wings are made from steel and composite materials. Together, they provide forward thrust and can rotate through 360º to make optimal use of the prevailing wind. Some 198 m long and weighing 32,000 tonnes, Oceanbird would – if built – be the biggest sailing vessel in the world. It could cross the Atlantic in 12 days at a top speed of 10 knots.
That’s 50% slower than today’s fuel-burning ships, which have an average transatlantic journey time of 7–8 days, but think of all the fuel saved. Of course, a backup engine (hopefully not powered by conventional fuel) would be needed when the wind is sluggish or the ship is passing through harbours. The wings are also telescopic, which means the ship can pass beneath bridges and reduce wing area under high wind conditions.
All hands on deck
Developing a wind-powered ship might seem like a backwards step. After all, commercial sailing vessels traditionally required huge amounts of labour to set the sails, which also had to be physically huge and strong. And of course, wind is a highly unpredictable source of power. But with advances in materials science, automation and computational modelling, wind power is a really practical and green idea.
If you believe those in the industry, we’re on the verge of a new generation of wind-powered ships
The International Windship Association currently has more than 100 members around the world working to deliver wind-powered ships. In fact, there’s an amazing amount of innovation and technology being investigated and evaluated. If you believe those in the industry, we’re on the verge of a new generation of wind-powered ships, boasting innovative sails, deployable kites to pull ships along, deck-mounted aerofoils and adjustable wing structures.
This work could play a key role in decarbonizing the shipping industry, where most vessels currently run on the dirty stuff left over after crude oil is refined. If it were a country, shipping would be ranked between Germany and Japan as the world’s sixth-largest emitter of carbon dioxide, spewing out nearly 3% of global emissions of greenhouse gases. Incredibly, the nitrogen oxides and sulphur oxide emissions from 15 of the largest ships match those from all the cars in the world.
Those problems are why the annual global market for wind-propulsion systems is set to grow from £300m now to about £2bn by the 2050s, according to the UK government’s Clean Maritime Plan. Wind-powered ships could help the International Maritime Organization (IMO) meet its ambitious goal of slashing carbon-dioxide emissions from ships by 70% by 2050 compared to 2008 levels. Maersk – the world’s largest shipping company – even hopes to cut carbon emissions to zero by that date (although how exactly remains unclear).
A July 2020 report by Deloitte and Shell paints a rosy picture of an industry recognizing its challenges and trying to solve them. Based on more than 80 interviews across the industry – from chief executives to financiers and ship builders – the report identified practical measures to cut carbon emissions. How, in particular, do you transform a sector that depends so much on cheap heavy fuel oils? And how do you adapt existing vessels that have been designed to last for 20 years or more?
Operational efficiency will be key. Today’s largest vessels can already carry around 22,000 containers, compared with barely 1000 in the early 1970s, while ships have doubled in size over the last decade. Both developments have helped to cut the average emissions per container by roughly a third. In fact, per tonne mass and kilometre travelled, large ships now emit only 14% of the carbon dioxide from a freight train, 6% of that from road vehicles and just 1% of that from a plane.
Consumer demands
Wind assistance seems key for new vessel designs but it’s risky when you realize that a new ship can cost up to $150m. The industry doesn’t have a clear path on technology and is also exploring several alternative fuels, including hydrogen, ammonia, methanol and biofuels. But all are problematic. Apart from needing new propulsion systems and storage tanks, we’d need to produce enough fuel to meet the 12 exajoule annual energy demand from shipping.
Perhaps the biggest challenge to making shipping greener is the lack of a global regulatory system
Many see liquid natural gas, which has an energy density of 55 MJ/kg compared to 45 MJ/kg for heavy oil, as the only realistic short-term solution to hit the IMO’s interim target of cutting emissions by 40% by 2030. It’s 25% less carbon intensive and doesn’t emit as much nitrogen and sulphur oxide. Gas is also a mature technology, with many ships already able to use it. Longer term, ammonia (18.5 MJ/kg) and hydrogen (120 MJ/kg) are superior solutions even if ammonia is toxic and both need storing under high pressure. Batteries, though, aren’t realistic: apart from their tiny energy density (0.4 MJ/kg) you’d need loads on a ship, weighing it down.
But perhaps the biggest challenge to making shipping greener is the lack of a global regulatory system and the IMO being a member-based organization. What’s more, shipping is simply invisible to most consumers. As the Deloitte and Shell report points out, that lack of awareness makes consumers unwilling to demand change, especially when green products cost more. Still, I hope those wind-powered memes will one day be a thing of the past.
The equality of inertial and gravitational mass central to Einstein’s general theory of relativity has been confirmed at unprecedented sensitivities by the MICROSCOPE satellite. Having gathered several thousand orbits’ worth of accelerometer data from two masses in free fall around the Earth, the French mission has found no violation of the equivalence principle at the level of a few parts in a thousand trillion. Mission scientists say that better control of thermal and other noise could boost precision by a further factor of 100, so allowing tests of quantum-gravity theories.
Since it was published by Albert Einstein in 1915, the general theory of relativity has passed a host of experimental tests with flying colours – from the Sun’s deflection of starlight to the gravitational redshift of atomic clocks. But physicists regard the theory as incomplete because it is at odds with quantum mechanics, while the phenomena of dark matter and dark energy remain unexplained. Researchers would also like to unify gravity with the other three fundamental interactions of nature – electromagnetism and the strong and weak nuclear forces.
One way of hunting for new force carriers predicted by alternative theories of gravity is to subject the weak equivalence principle to ever more severe tests. This principle states that inertial and gravitational mass are equivalent. Therefore all objects, regardless of their mass and composition, should fall at the same rate in a gravitational field if not subject to other forces – such as variations in air pressure. (The strong version of the principle is more robust because it also considers the effects of self-gravitation, which becomes important for large objects.)
Eötvös ratio
Ever since Galileo Galilei, experimentalists have been probing the equivalence principle with increasing sensitivity. The metric used in modern tests is the Eötvös ratio, which compares the accelerations of two free-falling test masses and is zero if those accelerations are equal. In 2008, Eric Adelberger and colleagues at the University of Washington in Seattle, US, used a rotating torsion balance to obtain an Eötvös ratio of zero at the level of about 2 parts in 1013. While ten years later researchers at the Paris Observatory in France drew on nearly 50 years of laser-ranging data – looking for tiny variations in the Moon’s orbit of the Earth – and confirmed the equivalence principle with a precision of around 7×10-14.
The idea behind MICROSCOPE was to further improve precision by exploiting the virtues of being in Earth orbit – the fact that measurements can be carried out over long periods of time and without terrestrial interference such as seismic noise. The mission involved monitoring the relative acceleration of two concentric hollow cylinders made from different alloys – one consisting of titanium and aluminium and the other platinum and rhodium – as they travelled in continuous freefall. It did so by using electrodes to monitor any deviations in the cylinders’ movement and then applying a tiny voltage to set the cylinders straight – with variations in this applied voltage providing the signal for any violations of the equivalence principle.
The €140m MICROSCOPE mission was launched in 2016 by France’s CNES space agency in collaboration with researchers in Germany, the Netherlands and the UK. Placed into a nearly polar orbit with a period of around 1.5 h, the satellite yielded an initial data set – published in 2017 – from just 120 orbits. That resulted in a roughly order-of-magnitude improvement over the then record sensitivity – pushing the uncertainty in the zero value of the Eötvös ratio down to about 2 parts in 1014.
Much more data
The MICROSCOPE collaboration has now published the mission’s complete data set, acquired over the equivalent of five months within its 2.5-year mission lifetime (the satellite, still in orbit, will eventually burn up in the Earth’s atmosphere). Having at least an order of magnitude more data than five years ago, some of which came from a reference comparison between two cylinders made from the same material (platinum), the researchers have been able to reduce the uncertainty on the Eötvös ratio to some four parts in 1015 – and finding it still to be zero. That is not as precise as they were hoping – they wanted to reach one part in 1015 – but nevertheless represents a further improvement in precision by around a factor of five.
Scientists not involved with the mission welcome the new results, although Anna Nobili of the University of Pisa in Italy is sceptical that the precision is as high as stated. She points out that the biggest source of systematic error is thermal noise, resulting from temperature gradients set up by variations in direct and reflected sunlight reaching the spacecraft. She notes that with the satellite already in orbit, the only way to reduce the effects of this noise between the two data releases was to improve modelling of it. But she finds it “not fully convincing” that the modelling could have achieved the necessary reduction – a factor of six.
Nonetheless, Nobili reckons that MICROSCOPE shows the “huge potential of space” for very high precision tests of the equivalence principle. In particular, she argues that the mission demonstrates the importance of spinning a spacecraft at high rates to increase the frequency of any violation signal to levels where thermal noise is known to be lower. (She notes that the satellite was intended to spin at up to five times its orbital frequency but ended up spinning 17.5 times faster.)
Further noise reduction
MICROSCOPE collaboration member Joel Bergé of Université Paris Saclay says that he and his colleagues are now working on a larger follow-up mission called MICROSCOPE 2, which they have yet to propose to any space agency, but which could launch “in the second half of the 2030s”. He says that the new satellite would incorporate several changes to reduce noise, including the replacement of a gold wire used to remove unwanted charge from the test mass with a wireless system involving ultraviolet light-emitting diodes. Such changes, he claims, could reduce the measurement uncertainty to around one part in 1017.
Clifford Will, a theorist at the University of Florida in the US, believes that the experience gained with the initial mission will give the MICROSCOPE researchers “a good foundation for moving to version 2.0”. He says that he is unable to judge the credibility of their projected 10-17 uncertainty but points out that scientists at Stanford University working on a proposed mission known as STEP argued that reaching that level of precision would necessitate the satellite being cooled down to cryogenic temperatures – something not envisaged for MICROSCOPE 2.
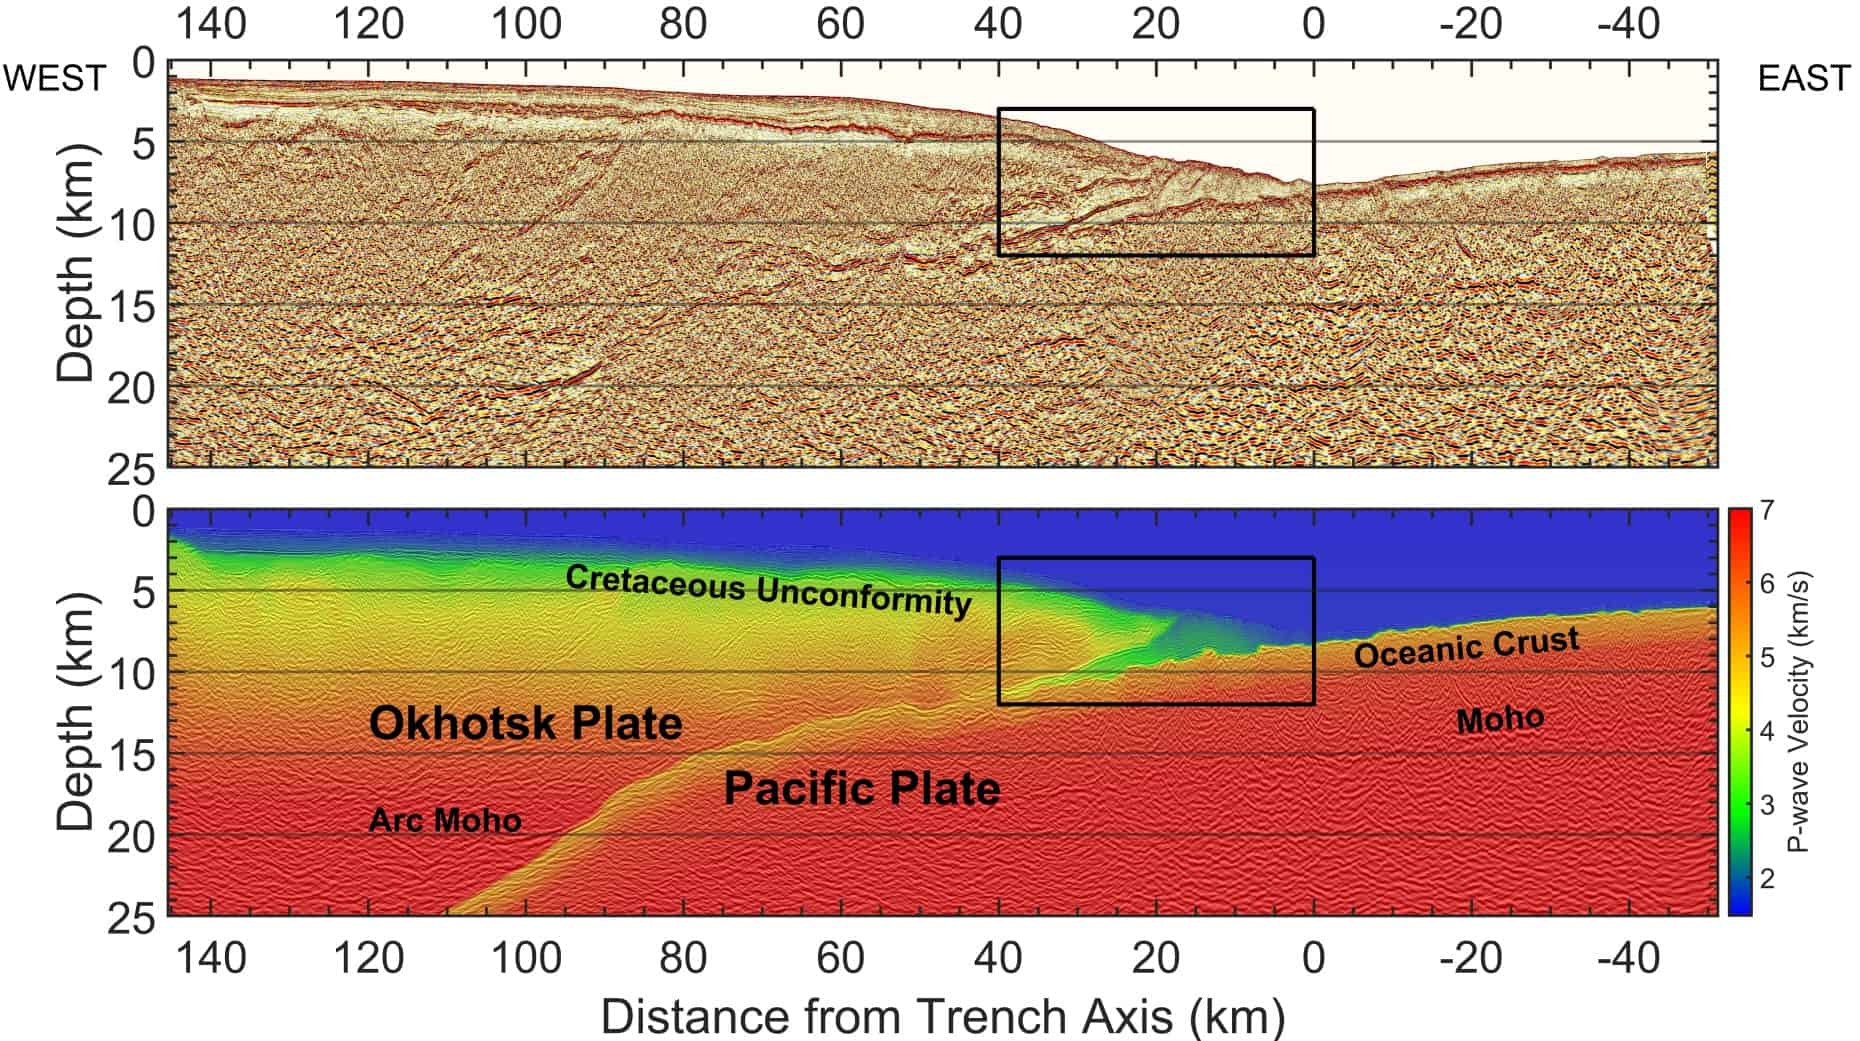
Newfound understanding: 2D seismic profile (top) and P-wave velocity model (bottom) of the Japan Trench subduction zone, where the Pacific plate is subducting beneath the Okhotsk plate. (Courtesy: Ehsan Jamali Hondori and Jin-Oh Park)
New research on the 9.0-magnitude Tohoku-Oki earthquake explores the intersection between Earth science, material properties and advanced modelling techniques. By combining aspects of these scientific fields, Ehsan Jamali Hondori and Jin-Oh Park at the University of Tokyo were able to identify the role played by undersea sediments in this deadly earthquake, which struck Japan in 2011. The research could also help to identify faults that would be prone to similar earthquakes in the future.
The duo’s work focused on a shallow plate boundary thrust fault, also known as a décollement, which is a very shallow and unstable zone of tectonic activity. This fault is positioned relative to the Japan trench subduction zone off the eastern coast of Japan, and its rupture led to the disturbance on the seafloor that created the tsunami waves associated with the Tohoku-Oki earthquake. This large-scale interpretation is well-accepted; however, what requires further investigation is the stability of the underlying sediments (layered particulates that have not yet become solid rock) that may have affected the rupture propagation of the fault.
Jamali Hondori and Park studied this stability using 2D seismic imaging, followed by a pore-fluid pressure calculation of the sediments at the décollement. The seismic imaging allows for a reconstruction of the geological structures, and the pore-fluid pressure describes the behaviour of the sediment particles as they are subjected to a high-pressure load coming from the ocean above the décollement.
The seismic data and pore-fluid data were collected separately, with the seismic data in the form of a seismogram, and the pore-fluid data plotted against shear strain and distance from the trench.
Data jackpot
The earthquake epicenter was located remarkably close to site 2E, which is a survey location from a previous study. With this prime positioning relative to the décollement, Jamali Hondori and Park hit the jackpot when it comes to seismic depth images.
Seismic depth images of the décollement revealed the formation of an accretionary prism. This is a collection of displaced sediments that have been dredged up and jostled by the region’s tectonic movements. Measuring the relative velocities of the seismic waves through these sedimentary structures allowed the duo to conclude that the pore-fluid pressure of sediments led to destabilization, which in turn led to seismic activity near site 2E.
The research makes an important connection between the cause of the earthquake and how fluid drains from the sediments. This was evaluated by calculating a “fluid overpressure ratio”, which quantifies the drainage and amount of fluid still present in the sediments. Jamali Hondori and Park have shown that beneath site 2E, there is an active drainage path. As a result, the seepage of fluid from the sediments results in lower pore pressure conditions in this zone. At the décollement, however, highly pressurized pore fluid is trapped within the impermeable sediments. This causes fault instability and decreased friction, which favours rupture propagation.
Unstable sediments
In short, the tectonic loading and thermal pressurization of the sediments as they shift along their substrate is the likely culprit for the unexpectedly large fault rupture of the Tohoku-Oki earthquake. In other words, the Tohoku-Oki earthquake was caused by the hydrostatic pressure of the ocean bearing down on sediments. This ultimately destabilized the sediments on a microscopic scale, thereby creating a large-scale tectonic movement.
Were the pore-fluid pressure and hydrostatic pressure equal in magnitude, there would have been no seismic loading. Instead, the disparity between the two is the cause of the large coseismic slip during the earthquake, where coseismic refers to a mechanical event that coincides with seismic activity.
The researchers analysed the shear and vertical effective stress at the fault site, in addition to the ratio of the calculated-to-expected vertical effective stress – which the duo describe as an effective stress ratio. This analysis revealed the fault’s propensity for coseismic slip and rupture, where a low effective stress ratio resulted in both the fault slip and the associated tsunami.
Horizontal displacement
Finally, Jamali Hondori and Park conclude that complex rupture patterns at the fault created conditions where pore-fluid pressure was instrumental in dictating shear stress levels. As a result, the researchers point out that a horizontal displacement commensurate with fluctuations in sediment stability caused this massive earthquake.
This research also has implications for our understanding of décollement thrust faults, illustrating the importance of the properties of the sediment beneath the fault. It could be possible to study the sediment profile of specific fault and predict powerful earthquakes before they occur. The ability to forecast nature-driven hazards would be invaluable to people living on coastlines, especially as climate change drives the frequency of increasingly serious natural disasters.
But beyond that, the company says, the game will switch to assembling such processors into modular circuits, in which the chips are wired together via sparser quantum or classical interconnections. That effort will culminate in what they refer to as their 4158-qubit Kookaburra device in 2025. Beyond then, IBM forecasts modularprocessors with 100,000 or more qubits, capable of computing without the errors that currently make quantum computing a matter of finding workarounds for the noisiness of the qubits. With this approach, the company’s quantum computing team is confident that it can achieve a general “quantum advantage”, where quantum computers will consistently outperform classical computers and conduct complex computations beyond the means of classical devices.
While he was in London on his way to the 28th Solvay conference in Brussels, which tackled quantum information, Physics World caught up with physicist Jay Gambetta, vice-president of IBM Quantum. Having spearheaded much of the company’s advances over the past two decades, Gambetta explained how these goals might be reached and what they will entail for the future of quantum computing.
The way ahead IBM’s roadmap shows how the company will scale up not just the number of qubits but their speed, quality and circuit architecture. (Courtesy: IBM)
What is the current state of the art at IBM Quantum? What are some of the key parameters you are focusing on?
The IBM roadmap is about scaling up – not just the number of qubits but their speed, quality and circuit architecture. We now have coherence times [the duration for which the qubits stay coherent and capable of performing a quantum computation] of 300 microseconds in the Eagle processor [compared with about 1 μs in 2010], and the next generation of devices will reach 300 milliseconds. And our qubits [made from superconducting metals] now have almost 99.9% fidelity [they incur only one error every 1000 operations – an error rate of 10–3]. I think 99.99% wouldn’t be impossible by the end of next year.
The ultimate litmus test for the maturity of quantum computers, then, is whether quantum runtime can be competitive with classical runtime
But doing things intelligently is going to become more important than just pushing the raw metrics. The processor architecture is getting increasingly important. I don’t think we’ll get much past 1000 qubits per chip [as on the Condor], so now we’re looking at modularity. This way, we can get to processors of 10,000 qubits by the end of this decade. We’re going to use both classical communication (to control the electronics) between chips, and quantum channels that create some entanglement (to perform computation). These between-chip channels are going to be slow – maybe 100 times slower than the circuits themselves. And the fidelities of the channels will be hard to push above 95%.
For high-performance computing, what really matters is minimizing the runtime – that is, minimizing the time it takes to generate a solution for a problem of interest. The ultimate litmus test for the maturity of quantum computers is whether quantum runtime can be competitive with classical runtime. We have started to show theoretically that if you have a large circuit you want to run, and you divide it up into smaller circuits, then every time you make a cut, you can think of it as incurring a classical cost, which increases the runtime exponentially. So the goal is to keep that exponential rise as close to 1 as possible.
For a given circuit, the runtime depends exponentially on a parameter we call γ̄ raised to the power nd, where n is the number of qubits and d is the depth [a measure of the longest path between the circuit’s input and output, or equivalently the number of time steps needed for the circuit to run]. So if we can getb γ̄ as close to 1 as possible, we get to a point where there’s real quantum advantage: no exponential growth in runtime. We can reduce γ̄ through improvements in coherence and gate fidelity [intrinsic error rate]. Eventually we’ll hit a tipping point where, even with the exponential overhead of error mitigation, we can reap runtime benefits over classical computers. If you can get γ̄ down to 1.001, the runtime is faster than if you were to simulate those circuits classically. I’m confident we can do this – with improvements in gate fidelity and suppressed crosstalk between qubits, we’ve already measured a γ̄ of 1.008 on the Falcon r10 [27-qubit] chip.
How can you make those improvements for error mitigation?
To improve fidelity, we’ve taken an approach called probabilistic error cancellation [arXiv:2201.09866]. The idea is that you send me workloads and I will send you processed results with noise-free estimates of them. You say I want you to run this circuit; I characterize all the noise I have in my system, and I make many runs and then process all those results together to give you a noise-free estimate of the circuit output. This way, we are starting to show that there is likely to be a continuum from where we are today with error suppression and error mitigation to full error correction.
Counting qubits IBM released its Eagle processor with 127 qubits in 2021. (Courtesy: IBM)
So you can get there without building fully error-correcting logical qubits?
What is a logical qubit really? What do people actually mean by that? What really matters is: can you run logical circuits, and how do you run them in a way that the runtime is always getting faster? Rather than thinking about building logical qubits, we’re thinking about how we run circuits and give users estimates of the answer, and then quantifying it by the runtime.
When you do normal error correction, you correct what you thought the answer would have been up to that point. You update a reference frame. But we will achieve error correction via error mitigation. With γ̄ equal to 1, I’ll effectively have error correction, because there’s no overhead to improving the estimates as much as you like.
This way, we will effectively have logical qubits, but they’ll get inserted continuously. So we are starting to think of it at a higher level. Our view is to create, from a user perspective, a continuum that just gets faster and faster. The ultimate litmus test for the maturity of quantum computers, then, is whether quantum runtime can be competitive with classical runtime.
That’s very different from what other quantum firms are doing, but I will be very surprised if this doesn’t become the general view – I bet you’ll start to see people comparing runtimes, not error correction rates.
What we’re doing is just computing in general, and we’re giving it a boost through a quantum processor
If you make modular devices with classical connections, does that mean the future is not really quantum versus classical, but quantum and classical?
Yes. Bringing classical and quantum together will allow you to do more. That’s what I call quantum surplus: doing classical computing in a smart way using quantum resources.
If I could wave a magic wand, I would not call it quantum computing. I would go back and say really what we’re doing is just computing in general, and we’re giving it a boost through a quantum processor. I’ve been using the catchphrase “quantum-centric supercomputing”. It’s really about stepping up computing by adding quantum to it. I really think this will be the architecture.
What are the technical obstacles? Does it matter that these devices need cryogenic cooling, say?
That’s not really a big deal. A bigger deal is that if we continue on our road map, I’m worried about the price of the electronics and all the things that go around it. To bring down these costs, we need to develop an ecosystem; and we as a community are still not doing enough to create that environment. I don’t see many people focusing on just the electronics, but I think it will happen.
Is all the science now done, so that it’s now more a matter of engineering?
There will always be science to do, especially as you chart this path from error mitigation to error correction. What type of connectivity do you want to build into the chip? What are the connections? These are all fundamental science. I think we can still push error rates to 10-5. Personally, I don’t like to label things “science” or “technology”; we’re building an innovation. I think there is definitely a transition to these devices becoming tools, and the question becomes how we use these things for science, rather than about the science of creating the tool.
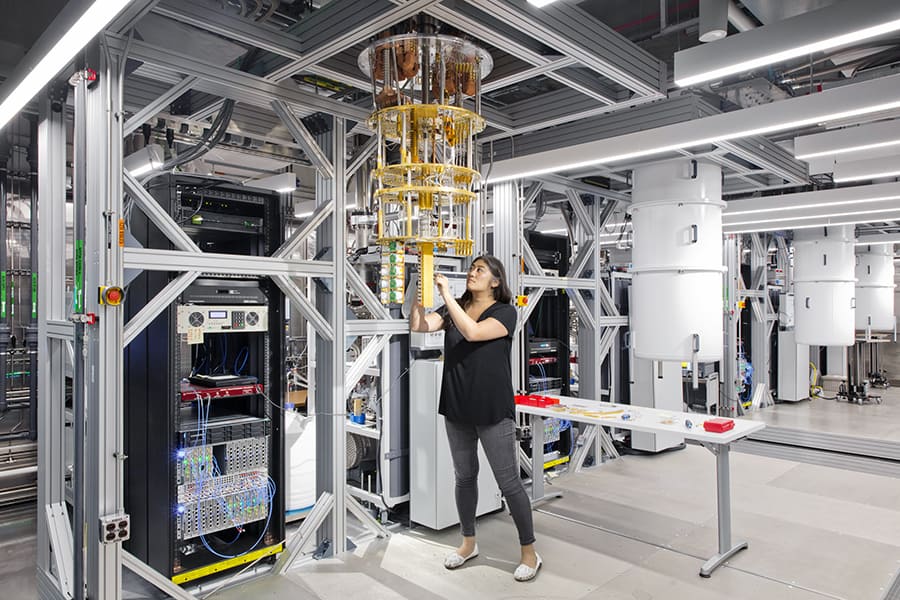
Cool operator Experimental researcher Maika Takita works on a cryogenic cooling system in the IBM Quantum Lab. (Courtesy: IBM)
Are you worried there might be a quantum bubble?
No. I think quantum advantage can be broken into two things. First, how do you actually run circuits faster on quantum hardware? I’m confident I can make predictions about that. And second, how do you actually use these circuits, and relate them to applications? Why does a quantum-based method work better than just a classical method alone? Those are very hard science questions. And they’re questions that high-energy physicists, materials scientists and quantum chemists are all interested in. I think there’s definitely going to be a demand – we already see it. We’re seeing some business enterprises getting interested too, but it’s going to take a while to find real solutions, rather than quantum being a tool for doing science.
I see this as being a smooth transition. One big potential area of application is problems that have data with some type of structure, especially data for which it’s very hard to find the correlations classically. Finance and medicine both face problems like that, and quantum methods such as quantum machine-learning are very good at finding correlations. It’s going to be a long road, but it’s worth the investment for them to do it.
What about keeping the computation secure against, say, attacks like Shor’s factoring algorithm, which harnesses quantum methods to crack current public key cryptographic methods, based on factorization?
Everyone wants to be secure against Shor’s algorithm – it’s now being called “quantum-safe”. We’ve got a lot of fundamental research into the algorithms, but how to build it in is going to become an important question. We’re investigating building this into our products all along, rather than as an add-on. And we need to ask how we make sure we have the classical infrastructure that is safe for quantum. How that future plays out is going to be very important over the next few years – how you build quantum-safe hardware from the ground up.
My definition of success is when most users won’t even know they’re using a quantum computer
Have you been surprised at the speed at which quantum computing has arrived?
For someone who’s been in it as deep as me since 2000, it’s followed remarkably close to the path that was predicted. I remember going back to an internal IBM roadmap from 2011 and it was pretty spot on. I thought I was making things up then! In general, I feel as though people are overestimating how long it will take. As we get more and more advanced, and people bring quantum information ideas to these devices, in the next few years we’ll be able to run larger circuits. Then it will be about what types of architecture you need to build, how big the clusters are, what types of communication channels you use, and so on. These questions will be driven by the kind of circuits you’re running: how do we start building machines for certain types of circuits? There will be a specialization of circuits.
What will 2030 look like for quantum computing?
My definition of success is when most users won’t even know they’re using a quantum computer, because it’s built into an architecture that works seamlessly with classical computing. The measure of success would then be that it’s invisible to most people using it, but it enhances their life in some way. Maybe your mobile phone will use an app that does its estimation using a quantum computer. In 2030 we’re not going to be at that level but I think we’ll have very large machines by then and they’ll be well beyond what we can do classically.
Fluorescence microscopy of live cells provides an indispensable tool for studying the dynamics of biological systems. But many biological processes – such as bacterial cell division and mitochondrial division, for example – occur sporadically, making them challenging to capture.
Continually imaging a sample at a high frame rate would ensure that when such divisions do occur, they will definitely be recorded. But excessive fluorescence imaging causes photobleaching and can prematurely destroy living samples. A slower frame rate, meanwhile, risks missing events-of-interest. What’s needed is a way to predict when an event is about to happen and then instruct the microscope to begin high-speed imaging.
Researchers at the Swiss Federal Institute of Technology Lausanne (EPFL) have created just such a system. The team developed an event-driven acquisition (EDA) framework that automates microscope control to image biological events in detail while limiting stress on the sample. Using neural networks to detect subtle precursors of events-of-interest, EDA adapts the acquisition parameters – such as imaging speed or measurement duration – in response.
Principal investigator: Suliana Manley in her laboratory at EPFL. (Courtesy: Hillary Sanctuary/EPFL/CC BY-SA)
“An intelligent microscope is kind of like a self-driving car. It needs to process certain types of information, subtle patterns that it then responds to by changing its behaviour,” explains principal investigator Suliana Manley in a press statement. “By using a neural network, we can detect much more subtle events and use them to drive changes in acquisition speed.”
The EDA framework, described in Nature Methods, consists of a feedback loop between a live image stream and the microscope controls. The researchers used Micro-Manager software to capture images from the microscope and a neural network trained on labelled data to analyse them. For each image, the network output acts as a decision-making parameter to toggle between slow and fast imaging.
Event recognition
To demonstrate their new technique, Manley and colleagues integrated EDA into an instant structured illumination microscope and used it to capture super-resolved time-lapse movies of mitochondrial and bacterial divisions.
Mitochondrial division is unpredictable, typically occurring once every few minutes and lasting tens of seconds. To predict the onset of division, the team trained the neural network to detect constrictions, a change in mitochondrial shape that leads to division, combined with the presence of a protein called DRP1 that’s required for spontaneous divisions.
The neural network outputs a heat map of “event scores”, with higher values (when both constrictions and DRP1 levels are high) indicating locations within the image where division is more likely to occur. Once the event score exceeds a threshold value, the imaging speed increases to capture the division events in detail. Once the score reduces to a second threshold, the microscope switches to low-speed imaging to avoid exposing the sample to excessive light.
The researchers performed EDA on cells expressing mitochondrion-targeted fluorescent labels. During each EDA measurement, the network recognized precursors to bacterial division nine times on average. This toggled the imaging speed from slow (0.2 frames/s) to fast (3.8 frames/s) for an average of 10 s, resulting in fast imaging for 18% of frames. They note that many sites accumulated DRP1 but did not lead to division. These sites did not trigger the network, demonstrating its ability to discriminate events-of-interest.
For comparison, the team also collected images at constant slow and fast speeds. EDA caused less sample photobleaching than fixed-rate fast imaging, enabling longer observations of each sample and increasing the odds of capturing rare mitochondrial division events. In some cases, the sample recovered from photobleaching during the slow imaging phases, enabling a higher cumulative light dose.
While bleaching was higher with EDA than for constant slow imaging, many EDA sessions reached 10 min without degradation of sample health. The researchers also found that EDA better resolved the constrictions preceding division, as well as the progression of membrane states leading to fission, as captured by the bursts of fast images.
“The potential of intelligent microscopy includes measuring what standard acquisitions would miss,” Manley explains. “We capture more events, measure smaller constrictions, and can follow each division in greater detail.”
Detecting bacterial division
Next, the researchers used EDA to study cell division in the bacteria C. crescentus. The bacterial cell cycle occurs on the timescale of tens of minutes, creating distinct challenges for live-cell microscopy. They collected data at a slow imaging speed of 6.7 frames/hr, a fast imaging speed of 20 frames/hr or a variable speed switched by EDA.
The team found that the event-detection network developed for mitochondrial constrictions could recognize the final stages of bacterial division without additional training – likely due to similarities in constriction shape and the presence of a functionally similar molecular marker.
Again, EDA reduced photobleaching compared with constant fast imaging, and measured constrictions with significantly smaller average diameters than with constant slow imaging. EDA enabled imaging of the entire cell cycle and provided details of bacterial cell division that are difficult to capture using a fixed imaging speed.
Manley tells Physics World that the team also plans to train neural networks to detect different kinds of events and use these to evoke different hardware responses. “For example, we envision harnessing optogenetic perturbations to modulate transcription at key moments in cell differentiation,” she explains. “We also think of using event detection as a means of data compression, selecting for storage or analysis the pieces of data that are most relevant to a given study.”
To enable researchers to implement EDA on a wide variety of microscopes, the team is providing the control framework as an open-source plug-in for the Micro-Manager software.
A sensitive new way of detecting particle interactions in the laboratory has been used for the first time to search for axions, a hypothetical form of dark matter. Using a so-called spin-based amplifier, an international team of physicists succeeded in constraining the axion mass within the predicted “axion window” of 0.01 meV to 1 meV, thereby bridging the gap between previous laboratory searches and astrophysical observations.
Axions were first hypothesized in the 1970s as a way of explaining an outstanding puzzle in physics known as the charge-parity problem. According to theory, they would have been produced abundantly after the Big Bang, and should be both chargeless and much less massive than electrons, meaning that they would interact very weakly with matter and electromagnetic radiation. This makes them a popular candidate for dark matter, a mysterious substance that appears to make up most of the matter the universe and affects the gravitational properties of large objects such as galaxies.
Exotic dipole-dipole interaction
The new axion search method takes advantage of a further prediction about axion behaviour: when fermions (particles with half-integer spin) exchange axions, they should produce an exotic dipole-dipole interaction that could, in principle, be detected in the laboratory. In the latest study, a team led by Xinhua Peng of the University of Science and Technology of China, together with researchers led by Dmitry Budker from the Helmholtz Institute, Johannes Gutenberg University, Mainz, Germany, and UC Berkeley in the US, combined a large ensemble of polarized rubidium-87 (87Rb) atoms (a source of electron spins) with polarized xeon-129 (129Xe) nuclear spins to look for evidence of this interaction.
The nuclear spins act as an amplifier for weak pseudo-magnetic fields that could be generated by electrons exchanging axions, and experiments showed that this spin-based amplifier could enhance external magnetic fields by a factor of more than 40. “The axions could then be searched through measuring this field,” Peng explains. “To search for axions with masses within the axion window of 0.01 meV to 1 meV, we adjust the distance the 129Xe spin-based amplifier and the Rb spin source to the centimetre scale.”
The technique allowed the researchers to constrain the axion mass from 0.03 meV to 1 meV, which lies in the range predicted by several theories, including high-temperature lattice QCD, the Standard Model Axion Seesaw Higgs portal inflation (SMASH) model and axion string networks. “Until now, existing laboratory searches (for example, cavity experiments like ADMX) and astrophysical observations (for example, SN1987A, white dwarfs, and Globular Clusters) mostly searched for axions with masses outside this window (with the exception of the ORGAN experiment in Western Australia),” Peng tells Physics World. “Our result reaches into the axion-window parameter space, complementing existing astrophysical and laboratory studies on potential Standard-Model extensions.”
Improving experimental sensitivity
Peng says the technique might be further extended to search for a wide variety of hypothetical particles beyond the Standard Model of particle physics, such as Z’ bosons and dark photons. “With our technique, for example, we can search for a broad range of exotic interactions mediated by new particles, such as paraphoton-mediated interactions, whose corresponding search sensitivity should be many orders of magnitude better than existing constraints,” says Peng. “In addition, we can directly search for axion-like galactic dark matter that could couple with the nucleon, allowing for a sensitivity that surpasses previous laboratory limits by several orders of magnitude and even beyond those obtained by astrophysical observations.”
In the meantime, the researchers, who detail their work in Physical Review Letters, say they will try to further improve the sensitivity of their technique to exotic interactions. For example, using an amplifier based on 3He electron spins or solid-state spin sources such as optically-pumped pentacene crystals could help achieve this, they say.