Resolving the ‘squoon’, and other irregular satellites

Children’s author Julia Donaldson and illustrator Axel Scheffler are probably best known for their book The Gruffalo. But the duo recently put forth a new offering, whimsically titled The Smeds and the Smoos, featuring two types of aliens. The Smeds, who are red, never mix with the Smoos, who are blue. At the end of this tale of love, friendship and seeing past our differences, the now-amicable Smeds and Smoos celebrate “by the light of the silvery squoon”, an irregular, wonky natural satellite of their planet. But if a planet had a squoon, would beings on that world be able to see it, or would it be too small to view with the naked eye?

Well let’s think about the physics: for a satellite to be wonky, it must be small. This is because for a given object, above a fixed limiting radius, gravitational forces dominate cohesive forces, causing the object to be become regular and spherical. For typical astronomical objects, this radius (aka the potato limit) is approximately 200–300 km, providing an upper limit for the radius of our irregular squoon. So because the squoon has to be small, to resolve it with sufficient detail, it must be relatively close to the surface of its host planet. But getting close to a planet is perilous. Veer too near to a massive body, and a satellite can be torn asunder by the host planet’s tidal forces, limiting how close the squoon can approach the planet.

Our eyes have a minimum angular resolution of about 0.3 mrad, approximately equivalent to resolving a human hair’s width at arm’s length from the eye. If we assume that our aliens have an equivalent resolution, then to resolve a satellite with surface features would require an angular diameter of approximately 10 times this resolution. That’s about 3 mrad, not far off the 10 mrad angular diameter of our Moon.

To achieve this angular resolution, our squoon would have to be much closer to the planet than the 59 Earth radii that spans the distance from the surface of the Moon to our planet. However, the squoon can be no closer to its host planet than the Roche (instability) limit at which the difference in forces at either side of the satellite rip it apart. For a planet of radius R, with an orbiting satellite of radius r, at an orbital radius of a, with average densities ρp and ρs respectively, the closest distance from the surface of the planet to the orbiting body before destruction is

aR=R(2.44(ρpρs)131)

If we assume the Smeds and Smoos live on a rocky planet akin to our own, with a squoon of a similar density to our Moon, then a – R ≈ 1.9R. So, for a given density, the bigger the planet, the larger the Roche limit. This results in an angular diameter of our orbiting body, as viewed from the planetary surface, of

2raR2r1.9R

This inverse relationship to the radius of the planet implies that larger planets will have smaller angular diameter squoons at the Roche limit. If we impose our angular diameter of 3 mrad, and constrain the squoon radius to 200 km to ensure it can be sufficiently irregular and “squoony”, then, assuming densities of rocky planets, we find that the planet can be anywhere up to a radius of 60,000 km or about the size of Saturn before we are scuppered from resolving any irregular satellites by the Roche limit with the naked eye.

This suggests that all rocky planets observed so far could potentially harbour squoons that we could resolve, with the closest approach before destruction providing an upper limit for its angular diameter. Consider, for instance, Kepler 10c – a rocky Super Earth. If such a planet harboured an irregular satellite it could have a maximum angular diameter of 12 mrad. With an angular diameter similar to our Moon, that would feature prominently in its night sky. This display would come at a cost, though, not to mention the looming demise of the squoon as its radius drops below the Roche limit. Indeed, our aliens would have to withstand crushing gravitational field strengths of around 32 N kg–1. On the other hand, smaller planets could have much closer squoons without being destroyed by tidal forces. Earth could harbour a veritable super squoon at the closest possible orbit with an angular diameter of 33 mrad. Mercury could host an imposing 86 mrad, almost nine times that of our Moon.

So does our solar system already harbour squoons? Phobos, the irregular 11 km natural satellite of Mars, orbits at an approximate distance of 6 × 103 km from the Martian surface, with an orbital period of 7 hr 39 min. For a Martian, or a procrastinating Martian rover, this would provide an angular diameter of about 1.8 mrad and they would be able to resolve detail of its surface. Indeed, since 2012 the Mars Curiosity rover has managed to image Phobos from the surface of Mars. But it is teetering close to destruction with an ever-diminishing orbital radius so although Martian observers will observe a gradually larger satellite over time, it is predicted to be destroyed in 30–50 million years.

The squoon is not the focus of Donaldson and Scheffler’s new book but acts as a romantic backdrop for a story about embracing diversity. It is an excellent read for young children. Perhaps, somewhere in the universe, there are enlightened aliens gazing at their squoon pondering if there are beings other than themselves staring up at a silvery, spherical “moon”.


Spin in unpolarized light defies conventional picture

It’s been almost a century since Wolfgang Pauli mooted the idea of “hidden rotation”: a new quantum variable that would double the number of possible electron states. Today, this variable is known as spin angular momentum, and it’s widely accepted as an intrinsic property of fundamental particles. Yet despite the ubiquity of spin, there is still no real consensus about its physical meaning.

For photons, the usual explanation is that spin is related to circular polarization – a state of affairs in which the direction of the electromagnetic field in a beam of light rotates in a plane perpendicular to the direction of propagation, like hands round a clock face. This explanation has a straightforward consequence: no polarization, no spin. Now, however, an international collaboration of researchers has cast doubt on this principle by measuring non-zero transverse spin values in totally unpolarized light. In ruling out this supposedly fundamental requirement, the new observations expand our understanding of what spin angular momentum is not, while raising further questions about what it is.

The discovery of transverse spin

Physicists’ understanding of spin has evolved over the past 10 years thanks to the proposal (and later experimental corroboration) of transverse spin – that is, spin on an axis perpendicular to the direction of light propagation. In general, once you get far enough from a light source (or if you use a beam like a laser), light rays propagate essentially parallel to each other (paraxial rays), such that the light beam’s polarization is strictly confined to the plane perpendicular to the direction of propagation. For light that is circularly polarized in that plane, this picture implies that any resulting spin must align either longitudinally along the direction of propagation or directly against it. However, that did not always stack up with what researchers – including some at King’s College London in the UK – were observing. “We saw some interesting phenomena in electromagnetism that were hard to explain,” recalls Francisco Rodríguez-Fortuño, a researcher at King’s who was involved in the latest developments.

In 2013, when Rodríguez-Fortuño and his colleagues were working on circularly polarized dipoles (mimicked using an illuminated slit in gold film) next to waveguides. They took their “interesting phenomena” to Konstantin Bliokh, a researcher at RIKEN in Japan. Bliokh had been developing a theory that suggested that a light beam could acquire an out-of-plane polarization component if it underwent certain transformations, such as total internal reflection to produce a non-propagating “evanescent field” that fades exponentially from surfaces, or tight focussing. The conclusion of this theoretical work was that if these non-propagating forms of light had a longitudinal polarization component, they could have transverse spin. “Then everything made sense,” Rodriguez-Fortuño tells Physics World.

Beyond 2D polarization

By this point, observations of transverse spin were racking up for beams that initially had all kinds of polarizations and were then focused or reflected. These results implied that the polarization of the initial beam didn’t actually affect the transverse spin measurements. Meanwhile, further theoretical predictions remained untested – including one that suggested that transverse spin should appear even without any polarization in the initial beam.

The reasoning here is that, in effect, once the electric field’s longitudinal component is taken into consideration, the light field ceases to be a 2D phenomenon, and must instead be described in 3D. From that perspective, even a beam of light that is completely unpolarized in 2D has a non-zero level of polarization in 3D, simply because it has no longitudinal components. With that in mind, Bliokh posed a question for King’s researchers led by Anatoly Zayats: could they demonstrate this effect experimentally?

The answer, eventually, was “yes”. Although Diane Roth, a postdoctoral researcher at King’s, says the experiment was “not the hardest”, it did have some unexpected challenges. “One difficulty was to find a source of truly unpolarized light that also produced enough intensity for the effect to be measured,” says Roth, who worked on experiments measuring spin from an evanescent field. Since all laser light is polarized, the King’s researchers had to look elsewhere for their source. In the end, they found themselves working with a “humble incandescent light bulb” instead.

Meanwhile, collaborators at the Max Planck Institute for the Science of Light and University Erlangen-Nuremburg in Germany, and the University of Graz in Austria took a different tack. In their experiments on tightly focused light, they varied the polarization from a laser and then averaged measurements taken over long periods of time to get an effectively unpolarized light source. Despite their different source of unpolarized light, and differences in the transformations used to produce light fields with an out-of-plane electric field component, these groups also found that measurements from a scattering nanoparticle gave non-zero transverse spin quantities.

The researchers say that the biggest impact of their results will be a contribution to our understanding of what spin angular momentum is. However, that is not to say it will be without applications. Luke Nicholls, who was involved in the research at King’s, notes that it could have advantages for switching and routing light in photonic circuits. “In principle it could make this sort of routing cheaper and easier to do in the long run because you don’t necessarily have to have a fancy laser or things like that,” he says. “You can just do it with a bulb or an LED.”

The researchers describe their work in Nature Photonics.

Presentations from Luminate to make your start-up succeed

This time we are featuring three webinars from Luminate.

Luminate, a six-month intensive accelerator programme located in Rochester, New York, is looking for its next cohort. Qualified companies in the optics, photonics and imaging (OPI) sector can earn up to $100,000 in investment and join the programme, culminating in the chance to compete for $2m in funding. Applications are open until 7 January 2021.

If you want to know more, Luminate’s team of entrepreneurs recently hosted a series of three webinars to help start-up firms and entrepreneurs determine if their ideas are right for Luminate.

Tips from the top

Luminate can help optics, photonics or imaging start-ups strengthen their business and speed up their technology commercialization. In the first webinar entitled “Accelerate your startup at Luminate”, you can hear from Luminate managing director Sujatha Ramanujan, the director of operations Andy Simon and director of programme technology Damon Diehl, who will help you assess if Luminate is right for your start-up. The team discusses how Luminate has helped 30 start-ups from around the world advance their technology and businesses.

Founding figures

In the second webinar entitled “How getting into Luminate advanced my startup”, you can find out how Luminate’s first three cohorts worked with companies to grow their business and advance their technology. Featuring three founders of Luminate portfolio companies – Leslie Kimerling (CEO of Double Helix Optics), Yasaman Soudagar, PhD (CEO of Neurescence), and Michael Wilson, PhD (CEO of Simulated Inanimate Models) – this webinar details how Luminate continues to support and advance companies after they complete the six-month programme.

Application advice

If you need help applying, a third webinar is where to go. Entitled “Applying to Luminate”, the director of operations Andy Simon gives a brief overview of the accelerator programme and explains why to apply. Simon also provides a detailed description of the application process in the F6s platform and answers questions in a virtual office hours format.

What are the chances of life existing in the clouds of Venus?

Do researchers still think that phosphine – a supposed signature of life – is present in the clouds of Venus? Could such a harsh environment harbour life? And could microbes hang out in clouds indefinitely anyway?

These were among the questions discussed this week at the 2020 Fall Meeting of the American Geophysical Union (AGU).

The story began in September when a team led by Janes Greaves of Cardiff University, UK, announced it had observed phosphine’s spectral fingerprint in the clouds of Venus. Greaves’ group saw the signal in data from the James Clerk Maxwell Telescope (JCMT) in Hawaii and the Atacama Large Millimeter/submillimeter Array (ALMA) in Chile.

We know that on terrestrial planets such as Venus and Earth, the only known processes to generate phosphine are connected with metabolism by anaerobic microbial life. So does that mean there’s life on Venus? Not necessarily. In the original Nature Astronomy paper, Greaves’ team made it clear the phosphine could originate from unknown photochemistry or other processes.

But the implications still triggered strong reactions in the astronomy community.

First, the organizing committee of the International Astronomical Union (IAU) Commission F3 on Astrobiology criticized Greaves’ team for stoking the media hype – a statement that was swiftly retracted by the IAU executive. Then, a group led by Geronimo Villanueva of NASA’s Goddard Space Flight Center argued that the spectral signal is generated by sulphur dioxide in Venus’ atmosphere – though their suggestion that Greaves’ reprint should be retracted was also withdrawn.

‘Fake lines’?

Other researchers – including a group led by Ignas Snellen of Leiden University – also  questioned the way Greaves and colleagues calibrated their data. The original study had identified an absorption line at 1.1 mm, associated with phosphine absorbing radiation from warmer clouds deeper in Venus’ atmosphere. But that line appears against a complex background of thermal emission and Snellen’s group said the way it was removed (fitting the data with a 12th-order polynomial) may have introduced artefacts.

It was against this backdrop of uncertainty that Greaves and Villanueva joined others at AGU Fall on 11 December. Session co-chair Sushil Atreya from the University of Michigan opened by reminding everyone that “we should treat our colleagues with respect” and, in the thankfully courteous discussion that followed, Greaves highlighted a new paper her group had released on 10 December, addressing questions about the spectral baselines.

We’re not looking at confirmation bias here, we’re looking at solid results

Jane Greaves

It concludes there is a probability of less than 1% that “fake lines” (their words) had appeared in the original analysis. “We’re not looking at confirmation bias here, we’re looking at solid results,” said Greaves, who pointed out that much of the analyses were done by people unconnected with the science project.

Villanueva, however, stood by his view that the signal can be explained by sulphur dioxide. In his preprint Villanueva had argued that the part of Venus’ atmosphere in question could feasibly contain up to 100 ppbv. At AGU Fall, he said that if even half of that silicon dioxide abundance would place an upper limit on the phosphine detection of 3 sigma – not high enough to rule out chance.

Researchers have also been looking back at data from NASA’s 1978 Pioneer Venus mission. Rakesh Mogul from California State Polytechnic University-Pomona has analysed mass spectrometry data collected by a mission probe dropped through the Venusian atmosphere. Mogul said he has so far found no conclusive signal for phosphine but he has found lots of other “gems in the data” with implications for habitability. That includes all the compounds in the nitrogen cycle and chemicals associated with anoxygenic photosynthesis.

Life at the top

In a separate AGU session, researchers considered the feasibility of life existing in Venus’ clouds.

David  Smith from NASA’s Ames Research Center spoke about recent aerobiology on Earth. He said that micro-organisms have been discovered up to altitudes of 12,000 m using scientific aircraft and balloons. “We humans really are bottom dwellers underneath an ocean of atmosphere above out heads and we really don’t know where Earth’s biosphere boundary stops at extreme altitudes,” he said.

Smith did point out, however, that all life in Earth’s atmosphere has been swept up from the surface and eventually returns to the surface under gravity. Moreover, as you move up through the stratosphere, the only things that can survive desiccation and high radiation doses are inactive single-celled micro-organisms, such as endospores with tough coatings.

Conditions on Venus are another level of extreme. The planet’s dense atmosphere is almost entirely made of carbon dioxide, laced with clouds of sulphuric acid. While Venus’ surface swelters at an average temperature of 460 °C, and is crushed under an atmospheric pressure of 93 bar. The mechanism by which life could persist in the clouds conditions is far from clear.

Surviving in a liquid droplet

One possibility was outlined by astrophysicist Sara Seagar from Massachusetts Institute of Technology. She described a hypothetical lifecycle where metabolically active microbes survive in liquid droplets in the Venusian atmosphere. When they eventually succumb to gravity, the desiccated spores drop into a haze layer below before returning to the droplet zone thanks to vertical mixing induced by gravity waves.

A broader, philosophical, view of Venus’ habitability was offered by Noam Izenberg, a planetary scientist at John Hopkins University. He has co-developed a “Venus life equation” – loosely based on the famous Drake equation – which considers three key factors: how life might have originated on Venus; whether it was robust enough to survive; and whether there could have been continuity to the present day.

Indeed, recent studies conclude that water oceans may have existed on Venus for significant parts of its early history. Izenberg says it is not inconceivable that life on Venus was seeded from Earth following a large impact. “Something that might have been an extinction-level event on Earth, might also have been a seeding event for other places in the solar system,” he said.

Perhaps even at the interplanetary scale “life, uh, finds a way”.

Two-dimensional materials for scalable modular electronic pathogen sensors

Want to learn more on this subject?

The COVID-19 pandemic has shed light on the global need for inexpensive, simple-to-use pathogen tests accessible to individuals on a daily basis to move beyond point-of-care diagnostics in favour of methods even more readily available to all people.

We have developed a low-cost disposable electronic sensor for use by individuals with minimal training and simple equipment for detection of multiple pathogens in easily accessible biological samples, such as saliva. The devices were fabricated using scalable processes with potential for economical mass production to utilize the sensitivity and surface chemistry of a two-dimensional MoS2 transducer for attachment of antibody fragments in a conformation favourable for antigen binding. Ultra-thin layers (3 nm) of amorphous MoS2 were directly sputtered over the entire sensor chip at room temperature and laser annealed to create an array of semiconducting 2H-MoS2 active sensor regions between metal contacts.

The semiconducting region was functionalized with monoclonal antibody Fab (fragment antigen binding) fragments derived from whole antibodies complementary to either SARS-CoV-2 S1 spike protein or Influenza A hemagglutinin. The high affinity of the antibody fragment base for the MoS2 transducer surface with some density of sulfur vacancies promoted antibody fragment chemisorption with antigen binding regions oriented for interaction with the sample. Electrical resistance measurements of sensors functionalized with antibody fragments and exposed to antigen concentrations ranging from 2–20,000 picograms per millilitre revealed selective responses in the presence of complementary antigens comparable to gold-standard diagnostics such as PCR analysis.

Want to learn more on this subject?

Christopher Muratore is the Ohio Research Scholars Endowed Chair Professor in the Chemical and Materials Engineering Department at the University of Dayton, Ohio. Prior to joining the university, Christopher spent nine years as a staff member at the Air Force Research Laboratory and still works closely with sensor development and flexible electronics groups there. Throughout his 20-year research career, Christopher’s work has focused on developing an understanding of how to control structure and properties of surfaces and interfaces in addition to their impact on device or component performance in diverse applications. He has four patents, has published more than 90 peer-reviewed articles and has served as guest editor for Surface and Coatings Technology and Thin Solid Films over the past five years.

Exotic hyperons interact with protons at CERN

Collisions between high-energy protons at the Large Hadron Collider (LHC) at CERN have given physicists a first glimpse at interactions involving exotic particles called hyperons. Researchers working on the ALICE experiment on the LHC looked at how hyperons – which are baryons containing at least one strange quark – interact with protons via the strong force. Their results are an important step forward in our understanding of the strong force and could also provide insights into the incredibly dense matter within neutron stars.

Hadrons, including protons and neutrons, are particles comprising two or more quarks that are held together by the strong force. Interactions between hadrons are also moderated by the strong force – and most of our limited knowledge of how hadrons interact with each other comes from experimental studies involving protons and neutrons. Because of the nature of the strong force, these interactions are extremely difficult to predict theoretically – and gaining a better understanding of how hadrons interact is referred to as the “last frontier” of the Standard Model of particle physics.

Protons, neutrons and hyperons are all baryons that contain three quarks. While protons and neutrons comprise only up and down quarks, hyperons contain at least one strange quark. Therefore, studying how hyperons interact provides new insights into the strong force.

Hadron “sources”

In their study, the ALICE team looked at high-energy collisions between protons, which create “sources” of particles in the space surrounding the collision site. Here, quarks and gluons interact with each other to create new particles. Pairs of hyperons and protons are produced in sources before leaving and being detected by ALICE. By measuring correlations between the momenta of the proton and hyperon in a detected pair, physicists can glean important information about how they interacted when close together in the source.

In such high-energy conditions, these interactions can be predicted to a limited extent by modelling the behaviour of quarks and gluons on a discrete spacetime lattice. As the team hoped, these predictions almost perfectly matched up with their measurements.

As well as providing important insight into how hadrons interact, the study could also boost our understanding of neutron stars. That is because astrophysicists believe that hyperons could exist in the extremely dense cores of these objects. Further studies of hyperon interactions at ALICE – as well as future facilities in Russia, Japan and Germany, could lead to a better understanding of the physical processes underlying neutron stars and also neutron-star mergers.

The research is described in Nature.

Reimagining reimbursement in radiation oncology

The Centers for Medicare and Medicaid Services (CMS) is betting on revolution rather than evolution as it gears up to rewrite the reimbursement rulebook for radiation oncology providers in the US. Starting 1 July 2021, the Radiation Oncology Alternative Payment Model (RO-APM) will enable CMS to gather evidence – at scale – on an all-new “financial infrastructure” for radiation oncology services in the US – and crucially whether an alternative payment structure preserves or enhances the quality of care for cancer patients while reducing annual Medicare expenditures.

The RO-APM trial, which runs through to the end of 2025, is an ambitious and broad-scope undertaking, with participation mandatory for selected institutions. Under the model, CMS will reimburse participating facilities using an episode-based (i.e. bundled) payment scheme, with the trial cohort comprising approximately 950 US physician group practices (PGPs), hospital outpatient departments and free-standing radiation therapy centers from randomly chosen zip codes.

In this way, reimbursement is matched to a patient’s cancer diagnosis and covers radiotherapy services furnished in a 90-day “episode” for the 16 cancer types meeting the RO-APM criteria – a significant departure from the current fee-for-service model for radiation oncology in which the bulk of compensation is linked to treatment modality and the number of radiotherapy fractions.

No time to lose

If that’s the long-run regulatory and financial context, the operational implications for radiation oncology providers are already front-and-center – or at least they should be. “The clock is ticking down to the RO-APM, so burying your head in the sand is not a credible plan,” cautions Shawn Prince, senior director of patient access at US radiotherapy equipment vendor Accuray.

Shawn Prince

In other words, it’s vital that radiation oncology clinics make the most of the next six months to prepare fully for the introduction of the RO-APM. “If the care providers don’t come to grips with the details of the new model – the nuances of the billing and coding requirements, for example – there’s a real risk they’ll leave significant amounts of money on the table,” Prince adds.

With this in mind, the patient access team at Accuray has put together a dedicated RO-APM project management tool with phased action plans for all members of the cross-disciplinary radiation oncology team, while also highlighting the pivotal role of oncology information systems and electronic health records in supporting the transition. That core reference document is backed up by sustained community engagement and education – for example, the recent Physics World webinar Medicare Radiation Oncology Alternative Payment Model: What You Need To Know.

“We have specialist resources and deep domain knowledge at Accuray that will help our customers better prepare for the RO-APM,” says Prince. What’s more, that knowledge-share extends to prospective customers. “Our radiotherapy solution is unique and aligns well with the RO-APM framework, where payment is based on diagnosis rather than the treatment modality,” Prince adds. “If you’re a clinic that is considering adding or replacing linear accelerators, we’re keen to talk further about how Accuray products can support your program within the RO-APM.”

The new rules of radiation oncology

At the clinical sharp-end, meanwhile, the day-to-day aspects of the RO-APM will, for the most part, be managed by a mix of clinicians, the nursing team, radiation therapists, as well as staff in billing and administration functions. More broadly, the all-inclusive payment that participating care providers will now receive (in place of fee-for-service) means that workflow efficiency will become a defining mantra – and the only way for clinics to succeed financially in the long term. “Under the RO-APM, the focus is going to shift decisively towards the total cost of delivering care,” says Prince. “The more efficient your radiotherapy program, the better the financial experience you will have.”

Expect greater emphasis, for sure, on the latest time-driven activity-based costing (TDABC) models. These tools enable radiation oncology providers to build a macro picture of capital expenditure (e.g. the cost of their linacs, imaging systems, software, QA tools and related medical supplies) and operational costs (e.g. staff salaries, service contracts and the like). From here, it’s a short step to drill down to a more granular view of per-patient cost-of-care and workflow efficiency for different treatment modalities – i.e. intensity-modulated radiation therapy (IMRT) versus volumetric modulated-arc therapy (VMAT) versus proton-beam therapy versus hypofractionated procedures such as stereotactic radiosurgery (SRS) and stereotactic body radiotherapy (SBRT).

Clinical outcomes being equivalent, the direction of travel within the RO-APM points towards radiotherapy modalities that deliver improved patient experience, increased patient throughput and reduced cost of care. All of which appears to sit well with Accuray’s emphasis on hypofractionated and ultrahypofractionated radiotherapy schemes – increasing the dose per fraction to enable significantly fewer overall treatments. A case in point is Accuray’s Radixact Treatment Delivery System, a helical radiotherapy platform that employs a continuously rotating gantry and unique dynamic collimation system to enable highly conformal dose delivery to diverse tumour sites throughout the body.

Radixact has recently been upgraded to incorporate motion-tracking and correction algorithms (collectively known as Synchrony) from Accuray’s flagship CyberKnife Treatment Delivery System, a robotic radiotherapy platform widely deployed in treating a range of disease indications using SRS and SBRT. This enhanced capability means that the Radixact System with Synchrony is now able to track and synchronize the delivery beam to the target position as the tumour moves. In effect, dose is delivered continuously to the moving tumour target – with the accuracy and precision required for hypofractionated radiotherapy (i.e. tight margins and steep dose gradients) as well as for standard radiotherapy procedures.

“Efficiency, efficiency, efficiency – that’s the name of the game in the RO-APM,” notes Prince. “That’s good news for radiotherapy systems like Radixact which enable clinics to rapidly scale their patient throughput on an annualized basis.”

Hypofractionate to accumulate

The RO-APM trial will run through to December 2025. If, after that time, significant cost savings accrue for CMS – as seems likely – it’s inevitable that other US healthcare payers will also migrate away from the current fee-for-service model in radiation oncology to a bundled payment scheme. “In my view,” says Prince, “the RO-APM will ultimately fast-track adoption of hyprofractionated and ultrahypofractionated radiotherapy, yielding enhanced efficiencies across the radiation oncology ecosystem – at the machine-level and right through to regional and nationwide healthcare systems.”

For now, though, Accuray remains focused on the near-term operational challenge of getting its customers up to speed for the launch of the RO-APM next summer. “Our specialist training and support on the RO-APM adds a lot of value,” Prince concludes. “The calculus is simple: if your radiation oncology program is successful, Accuray is successful.”

Dose-rate optimization increases healthy tissue sparing during FLASH proton therapy

Dose and dose-rate distributions

The primary goal of radiotherapy is to deliver a large radiation dose to cancer cells whilst sparing surrounding healthy tissue. Recent developments have shown that through delivery of ultrahigh dose rates to cancerous tissue, a technique known as FLASH radiotherapy, healthy tissue toxicity can be reduced, thereby improving the therapeutic ratio.

One approach for delivering the ultrahigh dose rates required for FLASH is to use proton therapy. As protons traverse through tissue, they deposit the majority of their energy at the end of their range. By ensuring maximum dose delivery within a confined volume, the combination of proton therapy and FLASH could improve the therapeutic ratio further.

Prior to treatment delivery, rigorous computational processes within the treatment planning system (TPS) help to determine the optimal plan. This optimization process also considers how to divide the total dose into multiple treatment fractions – known as hyperfractionation.

Currently TPS optimization algorithms only optimize the dose without consideration of the dose rate. However, the delivered dose rate has a significant impact on the efficacy of FLASH radiotherapy. To address this, Hao Gao and colleagues at Winship Cancer Institute of Emory University and Shandong University have developed a method for simultaneous dose and dose-rate optimization (SDDRO).

Dose-rate optimization

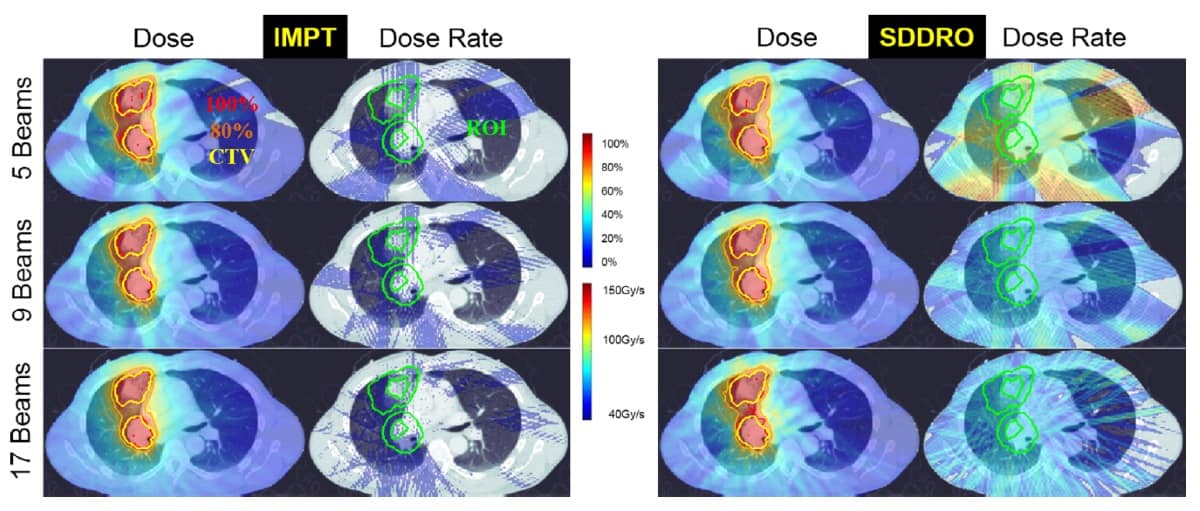
Gao and his team investigated the impact on plan quality when considering only dose optimization and when using SDDRO. They compared the dose and dose-rate distributions produced by SDDRO with traditional intensity-modulated proton therapy (IMPT) plans (with dose optimization only) for three lung cancer patients. They considered treatments delivered using one, three, five, nine and 17 beams, with fraction prescription doses of 2, 6 and 10 Gy.

The SDDRO method incorporates the usual dose constraints to the target volume and organs-at-risk (OAR). Additional dose-rate constraints are enforced, similarly to the dose constraints, in the region-of-interest (ROI). The ROI is selected as a ring-like expansion around the clinical target volume (CTV). The dose-rate constraints ensure that a large percentage of the ROI receives the desired FLASH dose rate (40 Gy/s or more).

Improved dose-rate coverage

In comparison to dose and dose-rate distributions produced by IMPT planning, SDDRO displayed significant improvements in the FLASH dose-rate coverage. The dose-rate constraint, where 98% of the ROI should receive the desired dose rate, was satisfied for all SDDRO plans in all cases. When multiple treatment beams were considered during optimization, the overall plan quality was improved, in terms of both dose and dose-rate distributions.

The best FLASH dose-rate coverage was obtained when planning treatments with nine beams and 10 Gy fractions. This suggests that the plan quality of SSDRO could be improved further by increasing the dose delivered per fraction – an approach known as hypofractionation.

The researchers also showed that the dose distributions produced with and without dose-rate optimization had comparable CTV coverage. Gao believes that “SDDRO can substantially improve the FLASH dose-rate coverage compared to IMPT for the purpose of normal tissue sparing while preserving the dose distribution”.

Future implementation of SDDRO

The ability of the proposed SDDRO method to handle dose-rate constraints is clear. For future implementation of this method, Gao suggests that “the dose rate–volume constraints should be prescribed in the similar fashion as the dose–volume constraints”.

While the authors acknowledge that implementation of the SDDRO method requires further development, they believe that this method may in the future become routine for FLASH treatment planning. “Unlike dose–volume constraints, for which various quantitative metrics have been established corresponding to clinical endpoints, the dose rate–volume constraints are new, for which the quantitative metrics are to be established,” says Gao.

The researchers report their findings in Medical Physics.

Capillary condensation follows classical law even at the nanoscale

When water vapour spontaneously condenses inside capillaries just 1 nm across, it behaves according to the 150-year-old Kelvin equation – defying predictions that this pre-quantum-era formula would inevitably break down at the atomic scale. This is the finding of researchers at the University of Manchester, who showed that the equation remains valid even for capillaries that can accommodate only a single layer of water molecules.

Condensation inside capillaries is ubiquitous in nature, and many physical processes – including friction, stiction, lubrication and corrosion – are affected by it. The Kelvin equation, which relates the surface tension of water to its temperature and the diameter of its meniscus (among other parameters), predicts that if the ambient humidity is between 30–50%, then flat capillaries less than 1.5 nm high will spontaneously fill with water vapour that condenses from the air.

In the real world, though, capillaries can be even smaller than this. At this scale, it becomes impossible to define the curvature of a liquid’s meniscus – meaning that the Kelvin equation should no longer hold. However, because such tight confinement is difficult to recreate in the laboratory, researchers have been unable to test this hypothesis until now.

Smallest capillary possible

The Manchester team led by Andre Geim and Qian Yang created their ultra-tiny capillaries by meticulously sandwiching strips of graphene (a two-dimensional sheet of carbon) between atomically flat crystals of mica or graphite using a process called van der Waals assembly. The graphene strips act as spacers and their thickness can be varied, allowing for capillaries of varying heights. Some are just one atom high, which Geim explains is the smallest capillary possible, allowing only a single layer of water molecules to pass through.

Using atomic force microscopy (AFM), Geim, Yang and colleagues imaged the capillaries as they filled with water. These data showed that capillary condensation follows the Kelvin equation even in these tiny structures. “The result came as big surprise,” Yang says. “We expected a complete breakdown of the equation since the properties of water change at this scale, with its structure becoming distinctly discrete and layered.”

Why no breakdown?

At the atomic scale, Yang explains that researchers rewrite the Kelvin equation in terms of how water molecules in both gas and liquid phases interact with solid surfaces (such as capillary walls). In this form, macroscopic quantities such as the contact angle of water with the capillary wall, the surface tension of water and its meniscus curvature all disappear from the equation, which then remains valid as long as the energy of the water-surface interactions does not notably change.

“In practice, however, the condition breaks at about four to five layers of confined water (which are less than 2 nm thick in total),” she tells Physics World. “Under stronger confinement still, the water structure strongly changes, and the interaction energies (primarily the liquid water-surface energy) inevitably change.” In this regime, the Kelvin equation should obviously fail — mainly because huge oscillations in the relative humidity at which condensation occurs are expected due to the aforementioned layered structure of water.

What the Manchester team found, though, is that these oscillations are strongly suppressed by the elasticity of the capillary walls. Although these walls adjust their position by less than 0.1 nm in response to the high pressures (of up to 1000 bars) present during capillary condensation under ambient humidity, Yang says that this miniscule adjustment is enough to snugly accommodate only an integer number of water-molecule layers. As a result, she concludes, “the Kelvin equation remains valid down to a monolayer of confined water”.

Full details of the research are described in Nature.

Big data meets Beethoven’s metronome, astronomy gets a badass new acronym

“Big data” has been a buzzword in scientific research for some time, but this week saw it applied to a longstanding puzzle in music history. The puzzle concerns metronomes, which are devices that make an audible click at regular intervals (traditionally set by the position of a weight on a pendulum) and are used by musicians to practice their timing.

The first such device was patented in 1815, and the great composer Ludwig van Beethoven (1770–1827) was quick to adopt it. The scores of many of his works use metronome markings to indicate how quickly he wanted the piece to be played, and he even attributed the success of his ninth symphony (with its famous “Ode to Joy” chorus in the final movement) to these new-fangled tempo instructions.

There’s just one problem: to most musicians, Beethoven’s metronome markings seem far too fast. And while tastes and tempi vary over time (not to mention between individual conductors), some of Beethoven’s instructions border on the unplayable. For example, the composer’s Op. 106 (the Hammerklavier sonata) starts out at 138 beats per minute for the half note – a value that physics student Almudena Martin-Castro and data scientist Iñaki Ukar describe as “decidedly unfeasible” in their recent paper on the subject.

Over the past 200 years, music scholars have put forward many potential explanations for this discrepancy. One of the most intriguing is that Beethoven’s metronome might have been badly made, incorrectly marked, or both – a distinct possibility given the vagaries of early 19th-century manufacturing.

To investigate this hypothesis, Martin-Castro and Ukar, who are both at the Universidad Carlos III de Madrid and UNED in Spain, began by using big data techniques to analyse 36 recordings of each movement of Beethoven’s symphonies, as interpreted by 36 different conductors. After analysing all 169 hours of music, they found that even conductors who profess a devotion to Beethoven’s original instructions consistently play the music slower than the composer’s marks indicate.

Next, Martin-Castro and Ukar developed a mathematical model of Beethoven’s metronome. This model was based on a double pendulum, and incorporated corrections for the amplitude of the pendulum’s oscillation, the friction of its mechanism, the impulse force, and the mass of its rod (an aspect that had not been considered in previous work). Using this model, they explored ways in which the metronome might have been faulty. Had part of the weight been broken off – perhaps by being hurled across the room by the famously irascible composer? Had the friction of the pendulum increased through poor lubrication? Or was the device tilted, leaning over the piano as Beethoven was composing his music?

While none of these hypotheses produced a homogeneous slowdown in tempi, the researchers eventually found one that did. It turns out that the deviation in written and played tempos exactly matched the diameter of the metronome’s weight, which suggests that Beethoven was mistakenly reading the wrong side of the scale. “We also found the annotation ‘108 or 120’ on the first page of the manuscript for his ninth symphony, which indicates that the composer doubted where he was reading at least once,” the researchers explain. “Suddenly, it all made sense: Beethoven was able to write down a lot of these marks by reading the tempo in the wrong place.”

Name that code

We love a good scientific acronym here at Physics World, and this week turned up a classic. While doing his PhD at the University of California Riverside in the US, astronomer Remington Sexton developed code to fit the spectra of active galactic nuclei (AGN) obtained via the Sloan Digital Sky Survey (SDSS). Because the code uses a method known as Bayesian decomposition analysis, it was entirely logical for Sexton to call it Bayesian AGN Decomposition Analysis for SDSS Spectra, or BADASS. Thoughtfully, Sexton has made his BADASS code free and open source, so anyone who wants to do some BADASS astronomy research with it can go and download it themselves. Now that’s a badass move.

Copyright © 2026 by IOP Publishing Ltd and individual contributors