Scientists identify gene responsible for butterfly’s dazzling structural colours

The shimmering wings of certain butterfly species are well-known examples of “structural” colour – that is, colour produced by light-scattering nanostructures rather than by reflection from coloured pigments. Many of the most striking species are, however, rare and hard to breed, hindering efforts to study these nanostructures in more detail. Now researchers in the US have struck iridescent gold by breeding blue structural colour into a more common species – a result that also helped them identify the first gene known to be associated with structural colour.

“Often conversations about butterfly structural colour focus on structures with more elaborate shapes than typical scales,” says Rachel Thayer, a PhD student at the University of California, Berkeley and lead author of a paper about the work, which is published in eLife. “We are showing that simple, normally-shaped butterfly scales are also an important source of structural colour, which suggests that many butterfly species may have the same phenomenon.”

Studies using a combination of electron microscopy and spectrophotometry had previously identified several butterfly species that produce structural colour in the lower lamina of their wing scales, which are made from a polymer called chitin. But Thayer points out that extending these spectroscopic methods to the high-throughput, live visualization studies needed to tease out the genetic and evolutionary basis of structural colour is more difficult. A further complication is that the exotic butterfly species with the most elaborate iridescent patterns are hard to keep in captivity.

Breeding beauties

The breakthrough came about, in part, because of Edith Smith. The co-founder of the Shady Oak Butterfly Farm in north-central Florida has a soft spot for the common buckeye butterfly (Junonia coenia), and one day she spotted something different. “I saw some bright blue on the top edge of a buckeye’s wings and wondered if it would become more prevalent or brighter if I bred some with blue to others with blue,” she recalls.

In just 12 months, Smith succeeded in breeding buckeyes that were far bluer and shinier than the predominantly brown wildtype. Then, when a video of Smith and the blue buckeyes caught Thayer’s eye, the Berkeley evolutionary biology student thought, “These are really blue, they look iridescent, probably a structural colour, and in one of the best species [for laboratory research] – I’ve got to check these out!”

Rows and rows of buckeye butterflies lined up in a box

Thayer used helium-ion microscopy (HIM) to identify an increase in the thickness of lower lamina scales in blue patches on the specially-bred buckeyes. Her hunch about structural colour had been right. But she also wanted to know whether the rapid colour change caused by Smith’s selective breeding was relevant to natural evolution.

Adding colour the genetic way

By taking specimens from 10 closely-related buckeye and pansy species, Thayer matched the HIM structures identified in individual patches to their reflection spectra. It was exacting work. “Training my hands to dissect scales as thin as a soap-bubble wall, without breaking them – that was pretty hard,” she says.

Despite the fiddliness of the task, Thayer was able to show that, although many different pigments were present within the scale nanostructures, the greatest contributor to the range of iridescent colours across species was a structural element: film thickness. “The differences in lamina thickness between species indicate that one way structural colour has evolved is by tuning the thickness of this tiny film in each butterfly scale to produce different hues,” she says.

Finally, Thayer fitted a genetic piece into the puzzle. A group of researchers at Cornell University in New York had previously mutated a well-known butterfly pigment gene known as optix, and they were curious to know whether this gene might also play a role in creating structural colour. When they sent specimens to Thayer, she found that lamina thickness was responsible for their colour changes, too.

Optix is the first gene we know of that can change the shape of a photonic structure in butterflies,” says Thayer, adding that she is excited by the possibility of investigating how nanostructures develop, and of finding other genetic clues. Further down the line, she says that understanding these elements could inspire more efficient ways of producing photonics devices such as solar panels and displays.

Extending the work

Pete Vukusic, a biophotonics expert at the University of Exeter, UK, who was not involved in the research, calls it “a lovely piece of ‘evo-devo’ [evolutionary development] work” and says he is intrigued by some of Thayer’s spectral measurements. “Butterflies appear to use ultraviolet scattering extensively, so I’d like to see [the measurements] extended into the near ultraviolet range, as that would help to tell a more complete story with respect to functionality.”

Although Thayer was unable to measure ultraviolet scattering with her current set-up, she says that Fresnel’s classical thin-film equations for reflectance suggest that some species do indeed scatter ultraviolet light from their scales. Her next steps are to find out whether optix or other genes are responsible for the newly-gained blueness of Smith’s selectively-bred buckeyes. As for Smith, she has an eye on some other butterfly traits, so who knows what scientific gold she’ll strike in her future experiments.

Some glaciers may be moving faster than previously thought, new ‘slip law’ suggests

An equation that describes motion of glaciers over soft, deformable ground has been developed by Neal Iverson of the Iowa State University and Lucas Zoet of the University of Wisconsin-Madison in the US. Their new “slip law” was derived from lab experiments and could help remove uncertainties from existing glacial flow models. Indeed, models that include the slip law predict more rapid ice sheet discharges into the oceans in the future – leading to additional sea level rise.

Understanding how glaciers move over different types of terrain is vital to predicting how much glacial melt will contribute to changes in sea level. However, there are currently large gaps in our knowledge – particularly for fast-flowing, ocean-reaching glaciers. These can be found in Antarctica and Greenland, where they lie on soft, glacially-deposited sediment called till.

“Glacier ice is a highly viscous fluid that slips over a substrate – in this case a deformable till bed – and friction at the bed provides the drag that holds the ice back,” Iverson explains. “In the absence of friction, the weight of the ice would cause it to accelerate catastrophically like some landslides,” he adds.

Data are difficult to obtain

Obtaining data on glacial drag in the field, however, is extremely difficult. Drilling to the bottom of the ice to make measurements, for example, would inherently change the nature of the interface between the glacier and the bed.

Taking a different approach, Iverson and Zoet have been simulating their very own glaciers in the lab. In 2009, Iverson built a ring-shear device that features a ring of ice 20 cm thick and 0.9 m in diameter that can be rotated at speeds of between 0.3–3048 metres per year over a chosen substrate. This occurs within a hydraulic press that can squeeze the ice to simulate the weight of an overlying glacier that is 244 m thick.

The device is stored in a walk-in freezer, with the ring surrounded by a circulating fluid that keeps the ice just at its melting point, so it slides along a thin film of water – like all fast-flowing glaciers do. For the simulated base under the ice, the researchers used real glacial till with the correct mix of mud, sand and larger rock particles.

“We were after the mathematical relationship between the drag holding the ice back at the bottom of the glacier and how fast the glacier would slide,” Iverson says. “That included studying the effect of the difference between ice pressure on the bed and water pressure in the pores of the till – a variable called the ‘effective pressure’ that controls friction.”

Dominant slip mechanism

From their experiments, the duo found that glaciers slide atop soft sediments at slower speeds, but once they reach a certain threshold speed, they begin to deform the underlying sediment – a process which then becomes the dominant slip mechanism.

“We are able to provide a mechanical reason for when this transition would happen and also provide a more generalized equation that could be used in ice-sheet models to simulate this process,” Zoet tells Physics World, explaining that the effective pressure is what controls the strength of the sediment bed and the resulting transition to bed deformation that changes the glacier’s drag.

When combined with the equivalent equation for glacier movement over hard beds, the researchers’ findings have the potential to be used to create a general slip law that could be applied to all glacier flow models, removing previous uncertainties.

“Higher rates of sea-level rise”

“Ice sheet models using our new slip relationship would tend to predict higher ice discharges to the ocean – and higher rates of sea-level rise – than slip laws currently being used in most ice sheet models, Iverson added.

Martin Truffer, a geophysicist from the University of Alaska commended the work, noting that others models “have a notoriously difficult time with […] boundary processes and a vast majority still use rules for basal motion that are not supported by observations.”

“One of the hardest problems in glaciology is how to parametrize basal motion of large ice sheets,” says Hilmar Gudmundsson, a glaciologist from Northumbria University. “In the past a lot of arguments have focused on if basal sliding is a viscous or a plastic process. This new work suggests that both of the processes are possible: at low sliding velocities we have the viscous limit, at high velocities we reach the plastic limit.”

Gaining further insights

With their initial study complete, the researchers are now looking to gain more insight into how the rates of sediment deformation change when variables such as ice velocity and effective pressure change.

“Developing a relationship that allows us to estimate the sediment deformation rate at the glacier’s base will give us a missing piece of information in estimating how long it takes glaciers to build and destroy landforms,” such as those found over much of Europe, North America and the base of Antarctica, Zoet says. “Using the new ring shear apparatus with a transparent sample chamber we can observe this directly.”

The research is described in Science.

Alanine dosimeters line up for MRI-guided radiotherapy

MR-guided radiotherapy enables real-time imaging during radiation delivery with high soft-tissue contrast, and could ultimately enable real-time adaptive treatments. Reference dosimetry in the presence of a strong magnetic field, however, is challenging.

“A reference dosimeter is a detector that is calibrated directly by comparison to a national dosimetry standard, or indirectly through intermediate calibrations,” explains Ilias Billas from the UK’s National Physical Laboratory (NPL). “Its main task is to enable hospital physicists to measure radiotherapy doses accurately and consistent with international dosimetry standards.”

The ionization chambers used for reference dosimetry in conventional radiotherapy systems are strongly affected by magnetic fields – making it challenging to perform beam output measurements. As such, there’s a real need for a robust and stable reference dosimeter for use in MRI-guided radiotherapy. A team headed up at NPL is investigating the suitability of an alanine detector for this task (Phys. Med. Biol. 10.1088/1361-6560/ab8148).

Dosimeter characterization

Alanine is an α-amino acid that produces a stable free radical when irradiated. The concentration of these free radicals is proportional to the absorbed dose, and is measured using electron paramagnetic resonance (EPR) spectroscopy.  As alanine is a solid-state detector, it should experience a lower electron return effect (ERE) than an air-filled ionization chamber.

To quantify the performance of the alanine dosimeter in the presence of a magnetic field, Billas and co-workers performed measurements and Monte Carlo (MC) simulations of alanine pellets irradiated at three photon beam energies and various magnetic flux densities. They placed pellets (roughly 2.3 mm high and 5 mm in diameter) in a waterproof polyether ether ketone (PEEK) holder shaped like a Farmer-type ionization chamber. They then placed these alanine dosimeters in an electromagnet and irradiated them with either a 60Co source, or 6 or 8 MV linac beams, over a range of magnetic flux densities

Alanine dosimetry

For 60Co irradiation, the researchers irradiated the alanine dosimeters inside a PMMA phantom, with any air gaps between the phantom and holder filled with water to avoid the ERE. They irradiated the phantom within magnetic flux densities of 0, 0.5, 1, 1.5 and 2 T. In the linac setup, they placed the alanine holder in a water phantom and irradiated the dosimeter at 0, 0.35, 0.5, 1 and 1.5 T.

The researchers validated MC models of the 6 and 8 MV linac beams by comparing simulated with experimental beam profiles and depth doses. To validate the model of the experimental set-up, they performed MC simulations and measurements, at 1.5 T, with the holder partially loaded with alanine pellets. In both cases, the MC models were successfully validated and used to support their research.

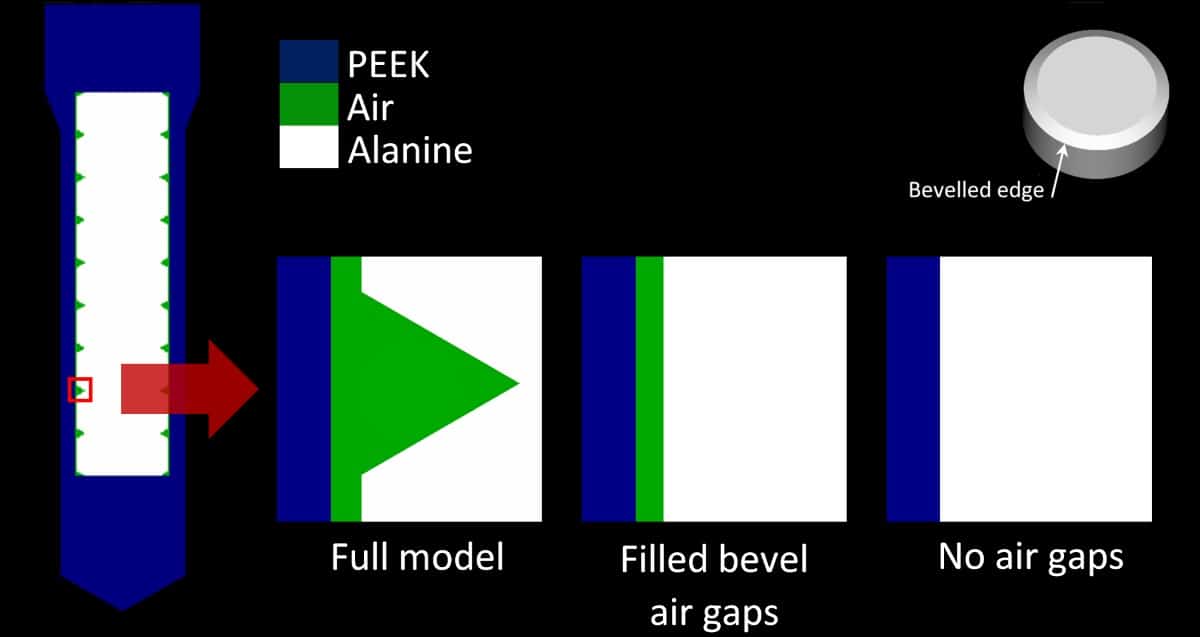
One potential issue with placing alanine pellets inside the holder is the impact on measured dose of air gaps within the holder – due to the bevelled edge of the pellets and the space between the pellets and the holder’s inner wall. Simulations performed at 1.5 T, with and without air gaps, revealed that such gaps did affect the alanine response, due to the ERE caused by the magnetic field. The maximum deviations between models with and without air gaps were 0.45% and 0.55%, for 6 and 8 MV beams, respectively. For the 60Co beam, all data deviated by less than 0.4%.

Monte Carlo models

The team also investigated uncertainties due to the random positions of pellets inside the holder. MC simulations of the pellets in four different positions inside the holder showed that uncertainties increased with magnetic flux density, up to 0.52% and 0.47% for 6 and 8 MV at 1.5 T, respectively. For 60Co, the highest uncertainty was 0.52% at 2 T. For other magnetic flux densities, uncertainties were all below 0.30%. Billas notes that this is the dominant component in their uncertainty budget, which includes the unavoidable effect on the alanine response due to the air gaps.

Correction calculations

By combining their measurements with Monte Carlo simulations of absorbed dose in water, the researchers found that the response of alanine to ionizing radiation was modified in the presence of a magnetic field. The effect was energy independent and, if uncorrected, could increase the alanine/EPR signal by 0.2% at 0.35 T and 0.7% at 1.5 T.

To determine the true absorbed dose in the presence of a magnetic field, the team calculated a correction factor. This factor – which incorporates the effects of the magnetic field on intrinsic alanine sensitivity, dose distribution in water, dose to alanine and fluence perturbation by the holder – tended to decrease with increasing magnetic flux density. Averaged over all magnetic flux densities, the calculated correction factors were: 0.9946 ± 0.0019 for 60Co; 0.9973 ± 0.0018 for 6 MV beams; and 0.9982 ± 0.0033 for 8 MV beams.

The team concluded that, with inclusion of this small correction factor, alanine/EPR provides a suitable reference class detector for MRI-guided radiotherapy, with comparable uncertainties to a Farmer-type ionization chamber.

“The next step in this project is the development of guidelines for a new dosimetry calibration protocol and the development of methodologies for dosimetry audit,” says Billas. “This would involve the use of alanine to provide the traceability from the NPL’s primary standard of absorbed dose, a graphite calorimeter, from a conventional linac to an MRI-linac.”

Kondo cloud seen at last

The first experimental measurement of a Kondo cloud – a condensed-matter phenomenon that drastically increases the electrical resistance of certain metals at low temperatures – confirms that this long-predicted structure really exists, more than half a century after it was first hypothesized. The new measurement could improve our understanding of condensed-matter systems that contain multiple magnetic impurities, including high transition-temperature superconductors.

In the 1930s, physicists spotted a surprising trend in the electrical resistance of metals that contain magnetic impurities. Unlike metals without such impurities, electrical resistance increases rapidly once the temperature drops below a certain threshold – and then keeps increasing as the temperature drops further.

The phenomenon was not explained until 1964, when the Japanese theorist Jun Kondo showed that at low temperatures, the spin of a magnetic impurity collectively couples, or becomes “stuck”, to all the electrons in the area. The resulting cloud of spin-coupled electrons – the Kondo cloud – screens off the conducting electrons and prevents them from moving. The result is an increase in the metal’s resistance.

Isolating a Kondo cloud

Although the spins interact locally with electrons around the magnetic impurity, the Kondo cloud can, in theory, spread out over several microns. This prediction inspired a team of researchers from Japan’s RIKEN Center for Emergent Matter Science, City University of Hong Kong, Korea Advanced Institute of Science and Technology (KAIST), the University of Tokyo, and Ruhr-University Bochum in Germany to try to measure the length of a Kondo cloud in a related system: the tiny pieces of semiconducting material known as quantum dots (QDs). Here, an unpaired electron spin trapped in the dot plays the role of a magnetic impurity in a metal.

In their work, the researchers fabricated a QD and connected it to a long, one-dimensional channel that houses a Fabry-Pérot interferometer containing an electron reservoir. When the unpaired electron spins in the QD couple to the electrons in this channel, a Kondo cloud forms. “In this way, we isolate a single Kondo cloud around a single impurity and can control the size of the cloud as well,” explains study lead author Ivan Borzenets.

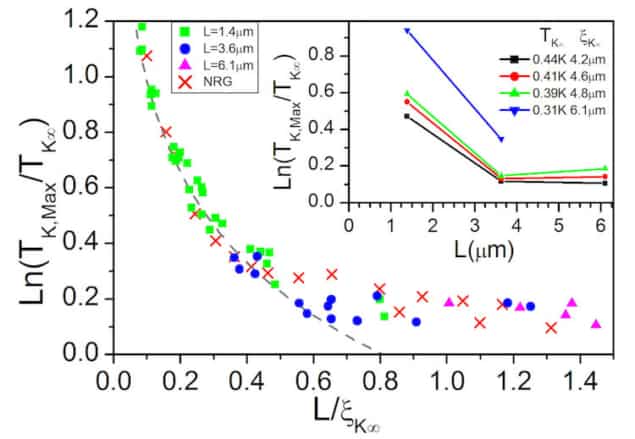
The researchers applied varying voltages at different points along the channel to induce weak barriers along it. They then observed how the channel’s electrical conductivity and the Kondo temperature – a quantity inversely proportional to the length of the Kondo cloud, and fairly straightforward to measure – changed as a function of the barrier strength and position.

“When we place a perturbation (a weak barrier) in our 1D channel, at a controlled length away from the magnetic impurity, and then activate this perturbation, this results in a change in the measured Kondo temperature,” Borzenets tells Physics World. “If the perturbation is at a length that is within the Kondo cloud, the Kondo temperature is strongly affected. Conversely, if it is outside the cloud, the effect is very small.”

The results showed that oscillations in conductance coincided with oscillations in the measured Kondo temperature. By plotting the amplitude of the Kondo temperature oscillation against the distance between the barrier and the impurity divided by the theoretical cloud length, the team found that all their data points fell onto a single curve, just as predicted (see graph).

Proportionality factor

The team say they have unequivocally proved the existence of the Kondo cloud by directly measuring its length. They also identified the proportionality factor that relates the size of the cloud to the Kondo temperature. They now plan to study more complicated Kondo systems containing multiple impurities.

“For example, we could place two impurities in the quantum dot at the same time and observe how they react when the clouds overlap,” Borzenets says. “The results from these experiments should provide important insights into the behaviour of multiple impurity systems, such as Kondo lattices, spin glasses and high transition-temperature superconductors.”

“It is very satisfying to have been able to obtain real space images of the Kondo cloud, as it is a real breakthrough for understanding various systems containing multiple magnetic impurities,” adds team leader Michihisa Yamamoto. “This achievement was only made possible by close collaboration with theorists.”

Heung-Sun Sim, the KAIST theorist who proposed the method for detecting the Kondo cloud, agrees: “It is remarkable from a fundamental and technical point of view that such a large quantum object can now be created, controlled, and detected.”

The research is detailed in Nature.

Going with the flow

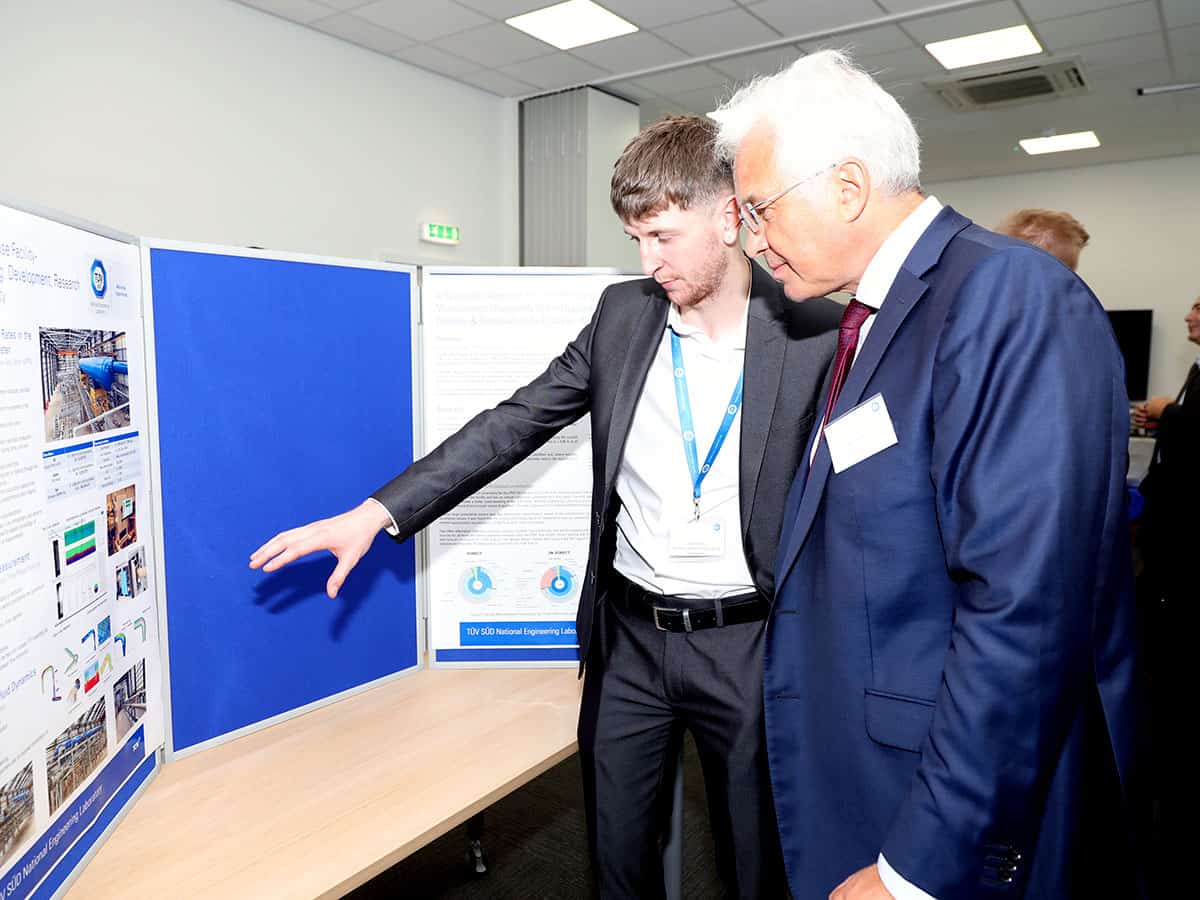
There are many ways to navigate the transition from physics degree to the more formal world of work, but not all of them involve rigorously mapped career pathways and a laser focus on “the perfect job”. Sometimes it pays to just go with the flow – a strategy that appears to have worked out well for physicist Aidan White, who joined TÜV SÜD National Engineering Laboratory in East Kilbride, Scotland, as a project engineer in spring of last year.

After completing a five-year MPhys degree at the University of Strathclyde, White says he “kind of fell into the TÜV SÜD opportunity”, acknowledging that the move was something of a departure from the research project he’d been working on for the previous 18 months – running computer simulations to evaluate medical radioisotope production in the university’s next-generation “laser-wakefield” particle accelerator. “It’s important to have an open mind,” he says of that initial job search. “Physics is a broad subject and it can be tricky to find your niche because of all the diverse opportunities available to you.”

Fast forward a year or so and, somewhat serendipitously, it appears that White has already carved out his niche within TÜV SÜD. The organization’s East Kilbride laboratory, which manages the UK’s national standards for flow and density measurement, is one of the leading global providers of flow measurement and related equipment calibration. It also offers consultancy and R&D services to the oil and gas industry, instrumentation manufacturers and the wider energy sector. Furthermore, as a National Measurement Laboratory, the business carries out industrial R&D on behalf of the UK government, developing technologies and best practice in sectors such as alternative fuel measurement (for example, hydrogen and liquefied natural gas) and carbon capture and storage.

I’ll give something a try before I tell you I can’t do it

As White tells it, the key message for other new graduates is “to get your foot in the door and roll with it”. He should know: he applied for one job as a mathematical modeller at TÜV SÜD, only to end up being hired as a project engineer in the group’s flagship test laboratory – the new £16m Advanced Multiphase Facility (AMF) – which was being commissioned around him last summer. “Adaptability is a real asset,” White maintains. “It helps that I’m a hard worker with a can-do attitude. I’ll give something a try before I tell you I can’t do it.”

If you build it, they will come

At the operational level, White and his colleagues in the project-engineering team are currently rolling out the AMF to a global customer base. Their specific focus is the £50bn-per-annum global subsea oil and gas industry, with the AMF designed to address current and future measurement challenges through company-led R&D projects, new product development, hands-on industry training and academic research.

Specifically, the AMF is being put to work evaluating the impact of extreme subsea operating environments on multiphase flow meters from a range of manufacturers. These instruments, which typically cost hundreds of thousands of pounds per unit, are a mainstay of the oil and gas industry. They are used to measure mixed streams of oil, gas and water flowing through a well-head or distribution system on the ocean floor. Such measurements are increasingly vital as larger production wells dwindle and energy companies seek to exploit smaller, more numerous wells in deeper waters and extreme environments.

“A big portion of our work is in supplying contract test and R&D versus calibration, validation and certification of all sorts of multiphase flow meters,” says White. “Many manufacturers have their own small-scale test facilities, but none can hit the pressures and flow rates we have here in East Kilbride, which are much closer to what the meter will experience under field conditions.” Fundamental research is also on the AMF agenda. The facility’s three-phase X-ray tomography system, for example, enables high-definition imaging of complex multiphase flows and their impact on flow measurements.

Aidan White

Learning by doing

When White joined the TÜV SÜD laboratory, the AMF building was already in place with all the heavy plant installed. Next came commissioning and mechanical completion of the core equipment and instrumentation. “It was a case of the right place at the right time for me,” says White. “My first task was to get to know the AMF inside out, seeing where everything went and how it all worked together – the valves, pipework, secondary instrumentation and reference flow meters.”

Although that meant a “steep learning curve and total immersion” over those first few months, White acknowledges that the benefits were immediate and long-lasting. “In many ways, the AMF resembles a big physics experiment – a 1600 m2 factory-sized one!” he notes. “Having been part of the AMF commissioning team, you can throw a valve number or transmitter number at me and I’ll pretty much be able to tell you where in the facility it is.”

Equally invaluable are the problem-solving skills White developed during his physics training – being able to look at the big picture and break that down into its component parts while working on a range of projects. “A solid mathematical background also helps, especially with respect to data mining and data analysis,” he adds. “We have to go through lots of data to figure out what’s relevant, why it’s relevant and what it all means.”

Right now, White is relishing the fact that no two days are the same and that new opportunities and responsibilities are never far away. Although he’s been with TÜV SÜD for less than 12 months, White has already been selling the AMF’s capabilities on the conference circuit, presenting the facility to industry executives and engineers at their regular Oil and Gas Focus Group in Aberdeen.

“TÜV SÜD is a prestigious place to work, with all sorts of talented people making up our cross-disciplinary teams of scientists, engineers and technicians,” White concludes. “My priorities for this year are to keep learning from all of them and to get some research formally published based on the work I’ll be doing with our AMF customers.”

High-pressure experiment sheds light on Earth’s outer core

Extreme conditions close to those found within the Earth’s outer core have been created in the lab by planetary scientists in Japan. Researchers led by Yasuhiro Kuwayama at the University of Tokyo created the temperatures and pressures needed for their experiment using a highly specialized diamond anvil. Their discoveries could lead to a better understanding of the composition and behaviour of the Earth’s outer core, and perhaps even the interiors of other planets.

The Earth’s core begins about 3000 km below the surface and much of what we know about it comes from looking at seismic waves from earthquakes that have travelled through the centre of the Earth. The core’s properties have also been studied by doing computer simulations and experiments that subject materials to extreme temperatures and pressures. Research has revealed that the centre of our planet is separated into a solid inner core composed mainly of an iron-nickel alloy and an outer core dominated by liquid iron.

Now, Kuwayama’s team has increased our knowledge of the outer core using a diamond anvil, which exploits diamond’s almost unparalleled hardness to subject samples to extremely high pressures and temperatures. In their study, they compressed a liquid iron sample to pressures of up to 116 GPa and heated it to of 4350 K. While 4350 K is believed to be a typical temperature within the outer core, 116 GPa is slightly lower than the pressure expected at the top of the outer core.

Sustained pressure

An important feature of this latest research is that this extreme pressure and temperature can be maintained indefinitely – at least in principle. This is unlike previous studies in which extreme conditions were only sustained for a few microseconds. The team squeezed a tiny liquid droplet of liquid iron to 116 GPa and then heated it to 4350 K using an infrared laser. Then the team probed their sample’s properties in detail, primarily by doing X-ray scattering experiments at RIKEN’S Spring-8 synchrotron in Hyōgo prefecture.

After combining their observations with existing data, Kuwayama and colleagues compared the measured thermodynamic properties of their high-pressure, high-temperature liquid iron to what is known about Earth’s outer core. They found that the Earth’s outer core must be around 7.5% less dense than the liquid iron, suggesting that it must contain a high abundance of lighter elements that have yet to be identified. The team also found that material in the outer core must flow around 4% more easily than liquid iron, although both materials display a similar resistance to compression.

Kuwayama’s team says that its work offers important new insights into the physical properties of Earth’s core. Their work could also inform future studies of other planetary cores – which even within the solar system, encompass a rich variety of compositions, structures, and relative sizes. As Kuwayama concludes, “we were pleasantly surprised by how effective this approach was and hope it can lead to a greater understanding of the world beneath our feet”.

The research is described in Physical Review Letters.

Advanced Microwave Topics for Quantum Physicists

Want to learn more on this subject?

A quantum experiment is difficult. Many factors interfere with obtaining accurate results, including noise, interference, individual qubit behaviour and the effects multiple qubits can have on each other. Controlling the qubit state, its entanglement, and ensuring controlled and stable measurement requires the precise application of electromagnetic waves. In this webinar, Mark Elo covers microwave control systems, which include methods of synthesis, pulse shaping and modulation techniques used in both semiconductor- and photon-based qubits. He also covers analogue signal-generation techniques common in many systems today, plus direct to microwave digital signal generation and measurement based on new DAC and ADC technology.

Mark EloMark Elo is the US general manager for Tabor Electronics. He began his career as a design engineer in Hewlett-Packard’s Microwave Division in 1990 and has since held various senior engineering and management positions at Agilent Technologies, Anritsu, Gigatronics and Keithley Instruments in R&D, marketing and business development. Elo has almost 30 years of test and measurement experience in microwave instrumentation, especially with respect to signal simulation and spectrum analysis – specializing in product definition and product realization of RF and microwave-frequency synthesis and analysis platforms. He has also held the chair for the AXIe marketing committee, participated in wireless standards and has published multiple articles.

Want to learn more on this subject?

Bench-top Screening of Wet Clutch Materials with the UMT Tribolab

View on demand

In this webinar, we cover the motivation and method of a bench-top screening test for the friction characteristics of wet clutch materials and automatic transmission fluids (ATFs).

A critical characteristic in clutch material friction behaviour is a flat or positive gradient of friction coefficient with increasing velocity. A negative gradient promotes stick-slip behavior, which can lead to undesirable clutch performance characteristics, such as shudder and judder. In this webinar, we cover the motivation and method of a bench-top screening test for the friction characteristics of clutch materials and automatic transmission fluids (ATFs). Such testing is key to the decrease in development time via the ranking of clutch materials and fluids prior to selection for standardized full-scale component test rigs or in-service vehicle field testing. Screening tests are conducted using industry-relevant test conditions, similar to those from the SAE #2 friction test machine, or per the JASCO M348-2012 test standard, including contact pressures, sliding velocities and temperatures. At the conclusion, we present results from bench-top screening tests of paper-based clutch materials which rank materials in the same manner they are ranked when full-scale clutches were tested.

Presenters:


Daniel Soares
Tribology Product Specialist


Dr Udo Volz
Application Scientist

AI can enhance MRI-guided radiation therapy plans

© AuntMinnie.com

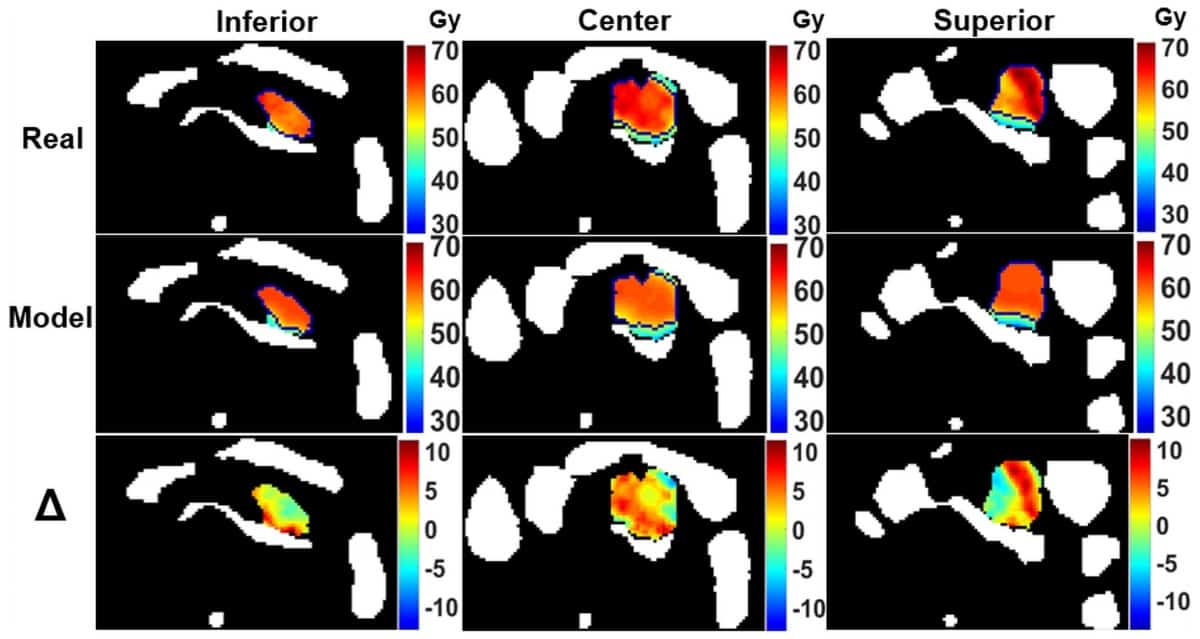
Artificial intelligence (AI) algorithms can rapidly predict 3D dose distributions for online adaptive MRI-guided radiation therapy plans, enabling swift optimization and quality assessment of these treatments, according to research published in the Journal of Applied Clinical Medical Physics.

Using only contouring information, artificial neural networks (ANNs) developed by researchers from Washington University in St. Louis produced strong performance for predicting 3D dose distributions for treatment plans. What’s more, they also clearly identified about 10% of abdominal cancer treatment plans in the study as inferior and requiring further optimization and refinement, according to the team.

“The prediction models will be useful to improve adaptive planning strategies and workflows through more informed plan optimization and evaluation in real time,” wrote the authors, led by first author M Allan Thomas.

Planned versus predicted dose

The researchers trained and validated the models using a dataset of 310 treatment plans from 53 abdominal cancer patients who had been treated with online adaptive, linac-based MRI-guided radiation therapy. Specifically, the ANN models were designed to predict 3D dose distributions based on the average of prior treatment plans.

“Our models allow a direct, 3D dose comparison between the history of previously treated plans and upcoming plans for future patients without needing to take the time and effort to create an actual treatment plan,” the authors wrote. “This is possible because our models are based on inputs that require only target and [organs-at-risk] structure data, not planned beam parameters.”

The researchers noted that clinical integration of the models requires minimal effort. After retrospectively replanning several of the 25 plans identified by the ANN as inferior in its analysis, the researchers also found that the new plans were closer to the quality level predicted by the model.

“Generally, from 40% to 100% of the difference between the predicted plan metrics and the original values were recovered after replanning,” they wrote. “These results help to further showcase the clinical relevance and utility of the dose prediction models.”

In the future, these 3D dose distribution predictions could be utilized as an alternative input to the current development process for treatment plans, according to the researchers.

“An estimated 3D dose prediction tailored to the specific anatomy of the day could provide a much-improved starting point for subsequent adapted plan development and optimization each fraction,” the authors wrote. “The fact that our ANN models can provide a 3D dose prediction using contour information alone (a fully developed treatment plan is not needed) helps to bolster their potential use as novel inputs for alternative treatment planning strategies.”

As the number of patients treated with online adaptive MR-guided radiation therapy increases and more training data becomes available, it may also be possible to develop improved prediction models based on convolutional neural networks, according to the researchers.

  • This article was originally published on AuntMinnie.com. ©2020 by AuntMinnie.com. Any copying, republication or redistribution of AuntMinnie.com content is expressly prohibited without the prior written consent of AuntMinnie.com.

COVID-19 symptoms detected from a safe distance using infrared light and microwaves

A system that checks from a safe distance whether someone is displaying symptoms of COVID-19 has been developed by Urs Schneider and colleagues at the Fraunhofer Institute for Manufacturing Engineering and Automation in Stuttgart, Germany. The team’s “access checker” combines infrared and microwave measurements and is already being tested at a Stuttgart hospital. The researchers believe that their system will become an important tool for ensuring the safety of healthcare workers, patients and hospital visitors.

To slow the spread of COVID-19, it is crucial for hospitals to enforce strict yet efficient entrance controls for staff and visitors. To carry out these tests, however, workers must come into regular contact with potentially infected people, putting both parties at risk. As a result, staff controlling access to hospitals must wear personal protection equipment, which is cumbersome and currently in short supply in some places. To address these issues, Schneider’s team created a device that uses a combination of measurements to detect some symptoms of the disease remotely.

One part of the access checker scans a person’s body temperature by measuring infrared radiation emitted by their skin. This is done to detect fever, which is a symptom of COVID-19. The device also checks for increased heart and breathing rates associated with the disease. This is done using a micro-Doppler radar system that bounces microwaves off the subject to detect body motions associated with breathing and blood flow. A similar technique is used by radar guns to measure the speed of vehicles.

Safe distance

Since the device can be operated remotely using a laptop, it allows healthcare workers to maintain a safe distance of more than 2 m from their subjects. Therefore operators do not have to wear personal protection equipment.

Schneider’s team have built a prototype of their remote access checker, which is currently undergoing its first trial run at the main entrance to the Robert Bosch Hospital in Stuttgart. Tests have already shown that the scans can be carried out just as fast as conventional tests for COVID-19 symptoms.

Several hospitals in the surrounding area have already expressed interest in the system and Schneider’s team have now drawn up ambitious plans to build four more monitors to serve them within just two weeks. Ultimately, the team hopes that their work could provide a critical tool for governments and healthcare workers as they fight to contain the spread of COVID-19. Schneider also believes that the technology has applications beyond COVID-19 scanning and could be used for routine screening in locations such as care homes and airports.

Copyright © 2025 by IOP Publishing Ltd and individual contributors