How the Nancy Grace Roman Space Telescope will turn the sky into a dataset

Nancy Grace Roman Space Telescope Launch

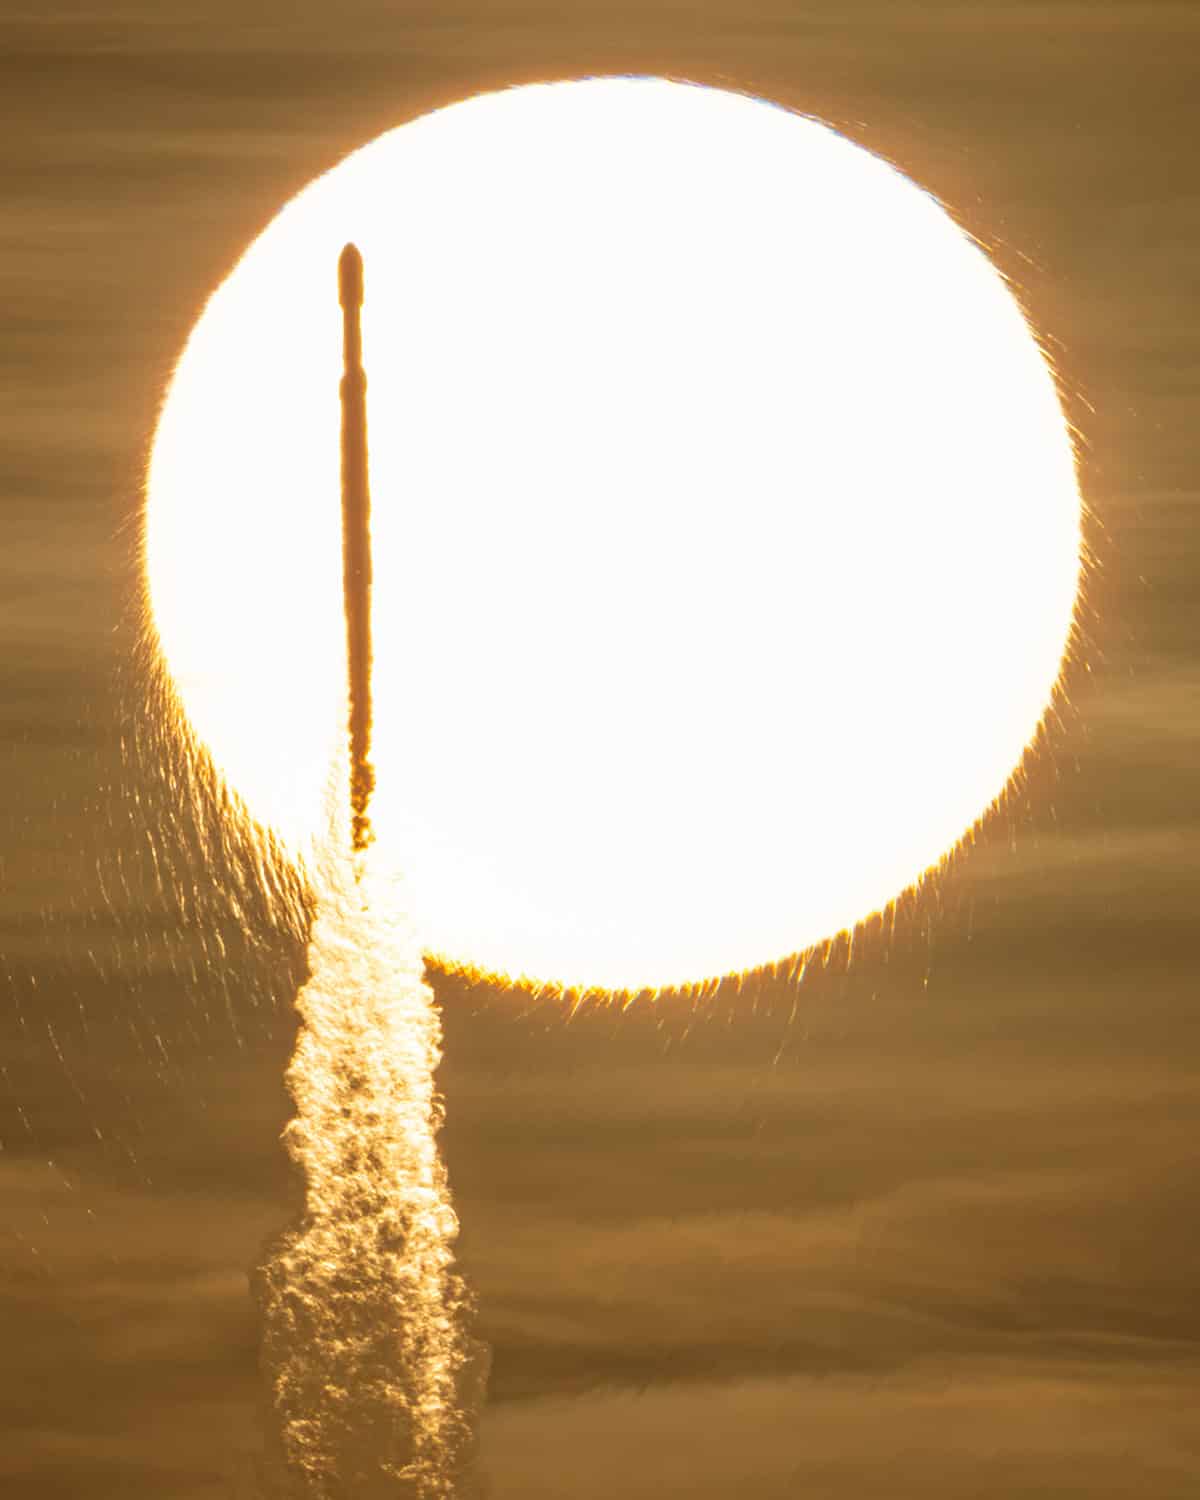
At 7.26 a.m. on Sunday 30 August 2026, a SpaceX Falcon Heavy rocket rose from the Kennedy Space Center in Florida, carrying NASA’s Nancy Grace Roman Space Telescope on its initial three-month journey beyond the Moon. As I watched online from my home in Sydney, Australia, that evening, the launch did not disappoint. There was all the familiar theatre of a rocket taking off: the brilliant column of flame, mission control calling out that it had gone through the point of peak aerodynamic stress, then the booster and main-engine cut-offs, before the fairing finally fell away.

Just 31 minutes after lift-off, Roman separated from its carrier rocket and began its long journey to L2, the second Sun–Earth Lagrange point, 1.5 million kilometres from Earth. Once it arrives there at the end of November, the gravitational balance will let Roman maintain its orbit with relatively little fuel. The Sun, Earth and Moon will all be on the same side of the spacecraft so that a single shield can block their light and heat, while the telescope faces away from them and stays cold.

Yet the most impactful part of Roman’s journey will be less visible. When its first images are released, hopefully in early 2027, the telescope will accelerate a change already long under way in astronomy. Rather than investigating carefully selected objects in the sky, astronomers are now increasingly mapping entire populations – monitoring a changing sky and searching enormous datasets for discoveries no single observer could conceivably find by eye. Roman will speed up that trend much further.

During the launch broadcast, I heard NASA administrator Jared Isaacman say Roman will study the “ecology of the universe”. Some cameras, he suggested, can provide an overview of a forest, while others can zoom in on individual birds and leaves. Roman, however, will combine both approaches. With a 2.4 m-diameter primary mirror, its images will be as sharp as those from the Hubble Space Telescope. But Roman’s Wide Field Instrument (WFI) can cover at least 100 times as much sky in a single pointing.
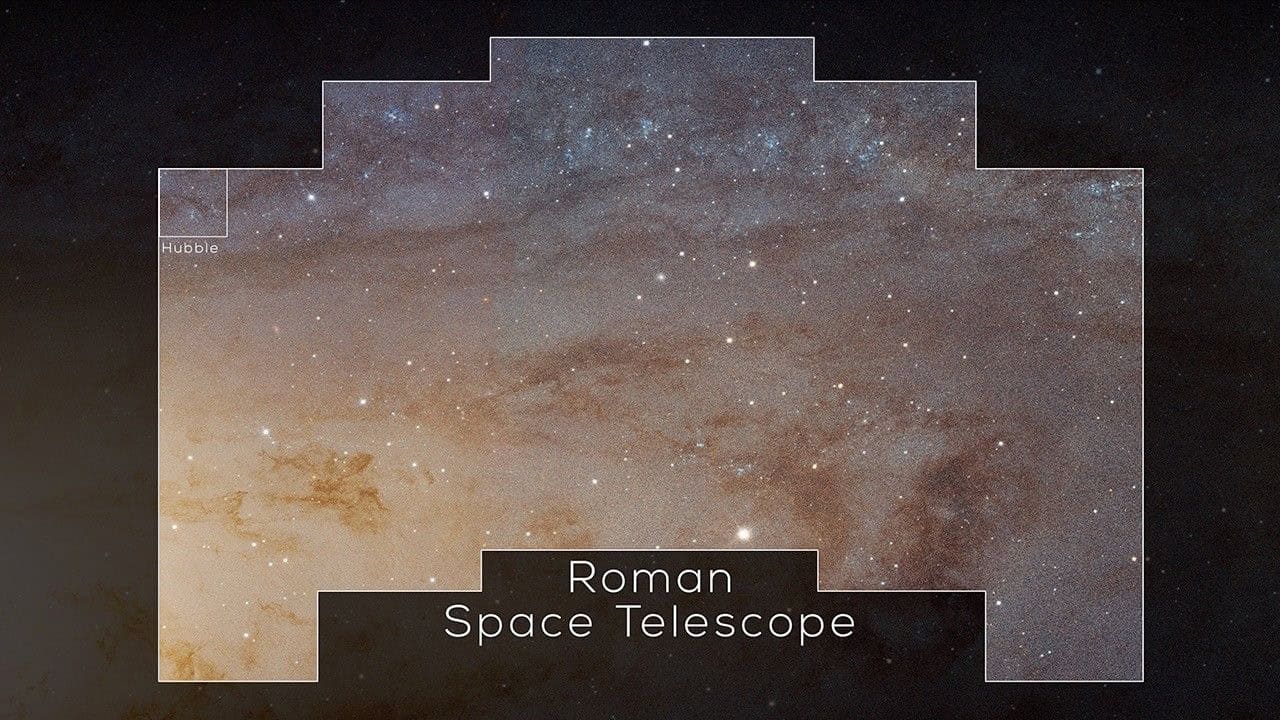
A field of view comparison between Hubble and the Roman telescopes

With Roman, the detailed and population views become part of the same observation. Traditionally in astronomy, a sharp image of a single galaxy can reveal its stars, dust and morphology, while a wide but (usually) less detailed survey can tell us how galaxies are distributed. Roman will do both: it will record fine detail while retaining the wider view of the environments and populations to which individual objects belong. It will, in essence, allow astronomers to study in detail entire cosmic ecosystems as well as their constituent objects.

And that is what makes Roman so revolutionary.

From observing targets to interrogating surveys

For much of modern professional astronomy, observing began with a proposal to study an object of scientific interest. If it was accepted by an observatory’s time-allocation committee, the astronomer would travel to the telescope (or, later, log in remotely), collect a manageable quantity of data, reduce and analyse it, and retain exclusive access during a proprietary period while preparing their first research paper. The observer knew why each exposure had been taken.

That model has not disappeared. The Hubble and James Webb space telescopes remain extraordinarily powerful precisely because they can study selected targets in fantastic detail. Roman’s coronagraph, meanwhile, will test active optics that suppress starlight far more effectively than existing space-based coronagraphs, allowing it to image giant planets orbiting nearby stars and paving the way for future missions to photograph smaller, Earth-like worlds.

However, alongside targeted astronomy, a different observing mode has become increasingly important, namely observatories designed to produce systematic, reusable maps of the sky. The Gaia mission of the European Space Agency (ESA) is one such example. Over its 11-year life between 2014 and 2025, Gaia took more than three trillion (3 × 10¹²) observations of roughly two billion stars and other objects. Its public catalogues have allowed researchers to reconstruct the Milky Way’s structure, identify stellar streams and star clusters, examine binary stars and search for rare objects, often without ever applying for new telescope time.

Gaia’s third data release, which was made public in June 2022, included 10.5 million “variable sources” – any objects that change in brightness over time, sometimes regularly and sometimes unpredictably. They were all classified using supervised machine-learning techniques, in which an algorithm learns from previously labelled examples. No astronomer could personally have inspected that many light curves (records of brightness versus time).
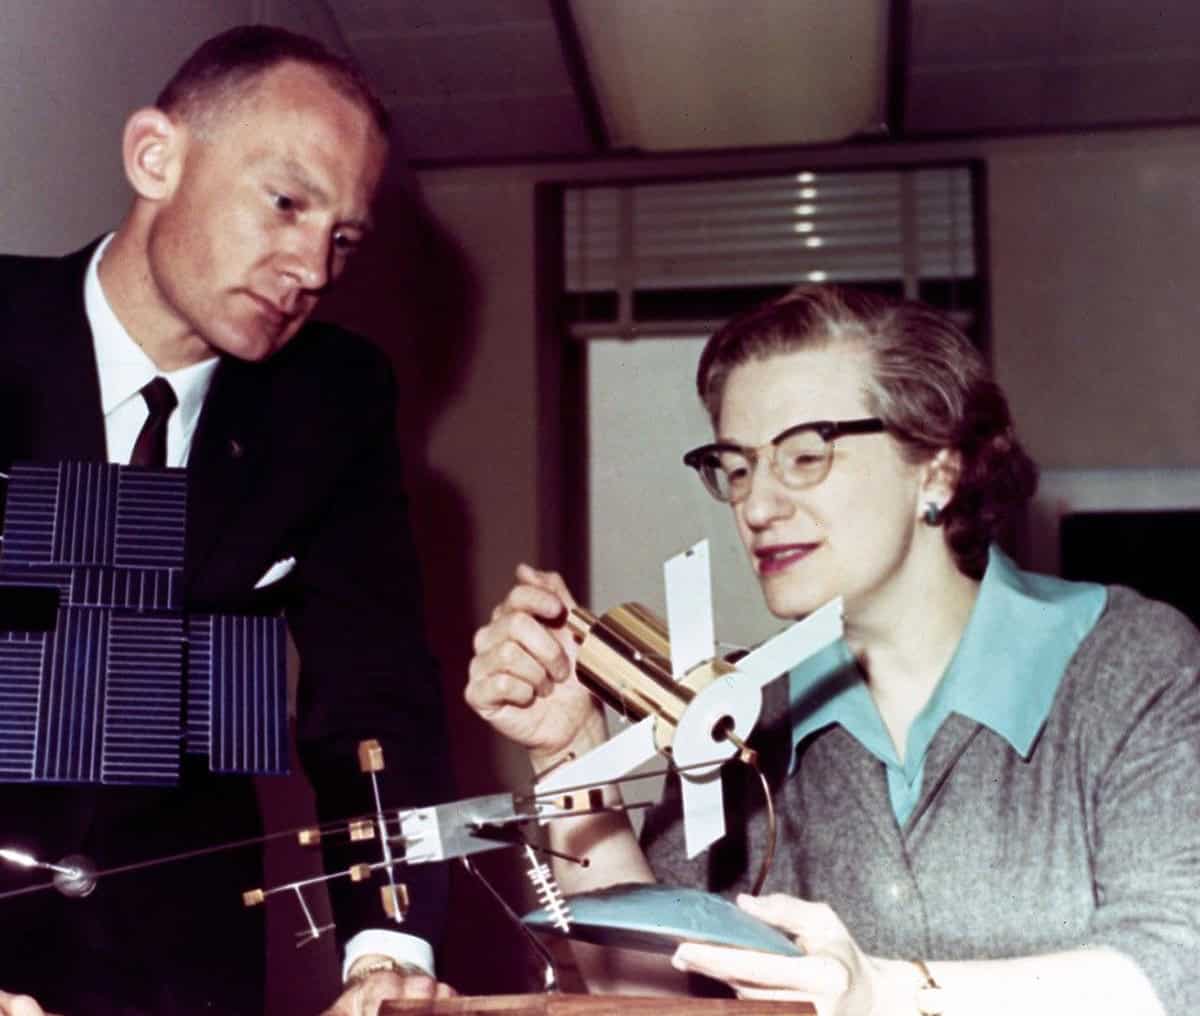
Nancy Grace Roman with Edwin "Buzz" Aldrin

The Vera C Rubin Observatory in Chile makes the new approach to professional astronomy even more explicit. Its decade-long Legacy Survey of Space and Time, which began in 2026, is collecting some 10 terabytes of data each and every night. Whenever its software detects that something has changed, it issues an alert. When alerts are triggered, they will be sent to automated “brokers”, which will cross-match them against existing catalogues, classify them and rank candidates for follow-up scrutiny. It is unlikely that an astronomer searching for supernovae, variable stars or hazardous asteroids, for example, will begin with the telescope’s raw images. Throughout modern astronomy, the starting point will instead be a filtered stream produced by a chain of algorithms.

Roman will carry this survey logic into space, beyond the blurring and infrared glow of the Earth’s atmosphere. As Roman’s deputy WFI scientist Ami Choi explained during the launch broadcast, the wide view is essential, especially for cosmologists. They don’t only need sharp measurements of individual galaxy shapes but also data on enough galaxies across a sufficiently large volume. That way they can distinguish the behaviour of the universe on large scales from the peculiarities of one small region.

Roman's three surveys

Roman’s three core surveys will show how a dataset can be designed to answer one question while creating the raw material for many others.

The High-Latitude Wide-Area Survey will map more than 5000 square degrees, which is more than 12% of the sky. It will do this using both imaging and “slitless” spectroscopy, in which spectra are recorded for every suitable object in the field rather than just individually selected targets.

Measuring the subtly distorted shapes of hundreds of millions of galaxies should reveal the distribution of dark matter – the mysterious, invisible stuff that makes up 27% of the universe by mass-energy – and also how cosmic structure has grown over time. Yet the same observations will also contain stars in the Milky Way, nearby galaxies, distant quasars, strong gravitational lenses and objects that no survey committee will ever have thought to put on a target list.

Roman’s High-Latitude Time-Domain Survey, meanwhile will repeatedly image “deep” fields at roughly five-day intervals, producing an anticipated 100,000 transient light curves. Type Ia supernovae, whose luminosities can be standardized to make them cosmic distance indicators, will trace the expansion history of the universe, but the repeated images should also expose variable galactic nuclei and rare explosions.

Finally, the Galactic Bulge Time-Domain Survey will revisit six fields of the sky about every 12 minutes during its most intensive observing seasons. Its main goal is to detect the temporary brightening of a star that occurs when the gravity of an unseen object passes in front and bends its light. Such “gravitational microlensing” events can reveal cold planets orbiting their host stars as well as free-floating planets and isolated black holes. The same sequence becomes a record of stellar variability and motion.

The reuse of data that we’ll see with Roman is not entirely new. Photographs recorded on physical glass plates often preserved far more sky than the astronomer who exposed them intended to study. Indeed, there have been instances of researchers trawling through old plate archives who’ve made discoveries decades after the photos were originally recorded. Electronic detectors, which produce digital images, made searching old data in this way far easier.

But what is new is the scale and the degree to which reuse is built into the Roman observatory from the outset. Many papers about data from the Roman mission will, I am sure, be written years later by researchers who were never involved in choosing the original data collection and may encounter the observation only as a row in a database.

Together, these observatories mark the arrival of what might be called astronomy’s “production era”. The phrase may sound industrial, but it describes a real shift in our professional practice. Telescope time remains precious, but it is no longer the only scarce resource. What will be increasingly hard to come by will be the capacity to process, connect and interpret what surveys have already observed, and to formulate a question sharp enough to extract meaning from an archive built for many purposes.

A picture too large to see

The data that Roman will yield is mind-boggling. Roman’s WFI has 18 infrared detector arrays with a total of about 300 million pixels. Even one field would require three dozen 4K television screens to display at full resolution. But Roman will tile thousands of such fields into surveys. During the pre-launch broadcast, Roman programme scientist Dominic Benford joked that NASA would need more than 500,000 TV sets to display the largest completed survey; laid out together, they’d cover some 45 city blocks.
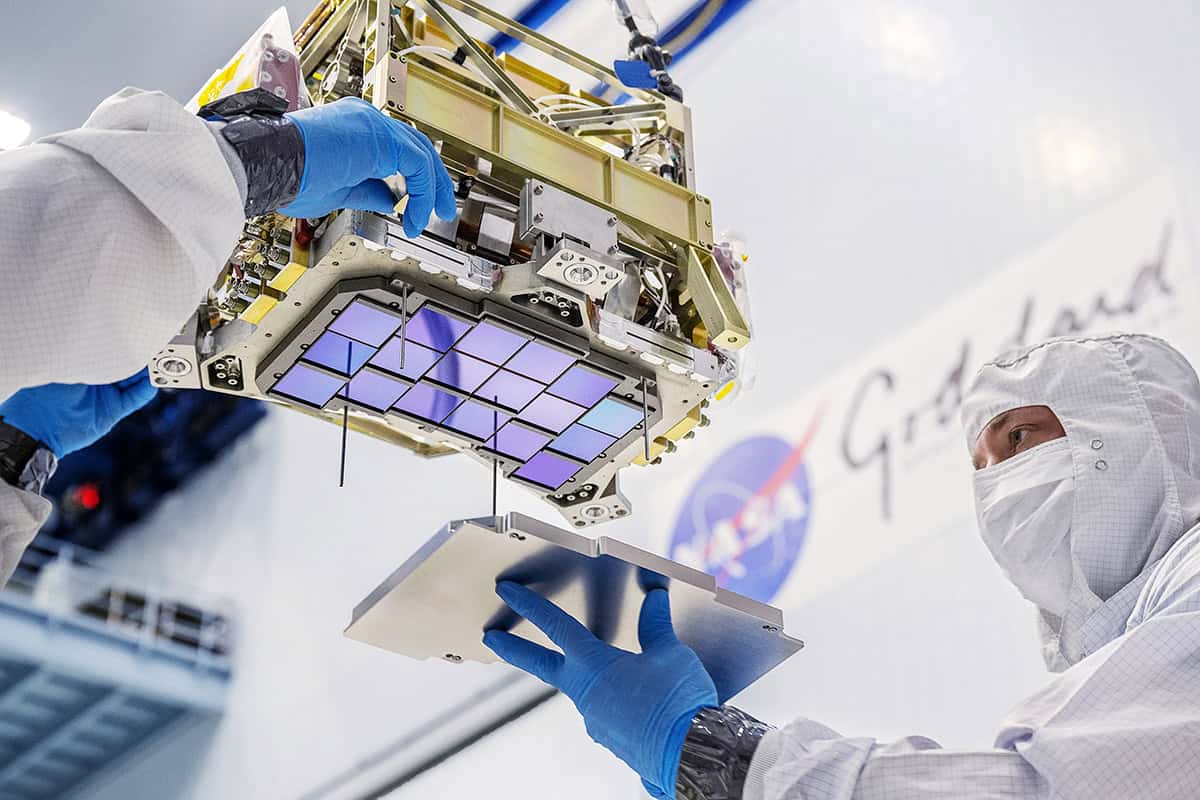
Roman's Wild Field Instrument (WFI) Focal Plane Array

Calling this a single “picture” is convenient but misleading. It will be a computationally constructed portrait assembled from many pointings, observing epochs and filters. The telescope collects photons; processing pipelines calibrate the detectors, remove instrumental signatures, align exposures and turn them into images, mosaics and catalogues. In survey astronomy, computation is not something that happens after the observation; it is part of observing.

During its lifetime, Roman is expected to return around 1.4 terabytes (1.4 × 1012 bytes) of compressed data each and every day. In fact, if you take into account the intermediate data generated when the information is processed, Roman’s archive could top 20 petabytes (20 × 1015 bytes) over its five-year primary mission. NASA expects automated methods, including machine learning, to help explore the torrent of data.

Automation is unavoidable, but it poses a subtle problem. Algorithms are excellent at finding examples of phenomena on which they have been trained. The discoveries that change science, however, often do not fit into established categories. An anomaly-detection system can flag statistical outliers, but deciding which outliers are artefacts, familiar objects in unusual circumstances or genuinely new phenomena remains a scientific assessment.

Human involvement in Roman won’t be entirely superfluous, however, and will still be required to make breakthroughs. Citizen scientists will play their part too. We need to encourage amateur sleuths to follow in the footsteps of people like Hanny van Arkel – the Dutch schoolteacher who in 2007 spotted an unfamiliar green cloud in data gathered by the Sloan Digital Sky Survey. “Hanny’s Voorwerp”, as it became known, is an ionized cloud preserving the light echo of a quasar that had faded dramatically.

Open data, uneven opportunity

Roman will need both kinds of intelligence: machines capable of surveying the statistical forest and people – whether professional astronomers or citizen scientists – willing to pause over a strange bird in one of its trees. But the question is not just how Roman’s data will be searched. It is also who will get to search them.

The Roman space telescope will fundamentally change who gets the first chance to make a discovery

Roman, you see, will fundamentally change who gets the first chance to make a discovery. Hubble observers can receive up to a year of exclusive, “proprietary” access to their new data, which is typical for space- and ground-based professional programmes. Roman, however, will have no such period. Calibrated exposures are intended to become public within days, with more elaborate mosaics and catalogues following in periodic releases.

In principle, therefore, anyone will be able to start looking at observational data as soon as it’s released. The beauty of Roman is that a PhD student, a researcher at a small institution, or members of large international consortium will all be able to get going at the same time. The move to “open data” will also benefit astronomers at institutions who have traditionally lacked access to major telescopes.

However, it also complicates familiar ideas about ownership and priority. Who receives credit when one team designs a survey, another builds the pipeline, a machine identifies a puzzling candidate, and a third group recognizes its significance? Will researchers feel pressure to publish quickly rather than investigate carefully when competitors can access the same data?

Indeed, open access does not automatically create equal opportunity. A 20-petabyte archive cannot simply be downloaded onto a laptop. Researchers need computing resources, efficient code and the expertise to use them. That’s why the Space Telescope Science Institute in Baltimore, Maryland, has developed the cloud-based Roman Research Nexus, which will let users analyse mission data where they are stored.

Rather than trying to transfer vast wodges of raw data to their home institutions, researchers will instead write or upload code to a cloud-based environment where the Roman archive is stored, run the analysis there and then download the results. Essentially, they will take their code to the data, not the data to the code. Without such a platform, nominal access to the archive would be of limited use.

Even so, differences in funding, training, network bandwidth and available time will continue to shape who can exploit the archive most effectively. Astronomers will, in other words, still need to understand telescopes, detectors, calibration and astrophysics. But they will increasingly work alongside software engineers and statisticians, evaluate machine-generated classifications and design searches that can operate across billions of sources. Knowing what not to trust in a catalogue may become as important as knowing where to point a telescope.

From 3596 pixels to 300 million pixels
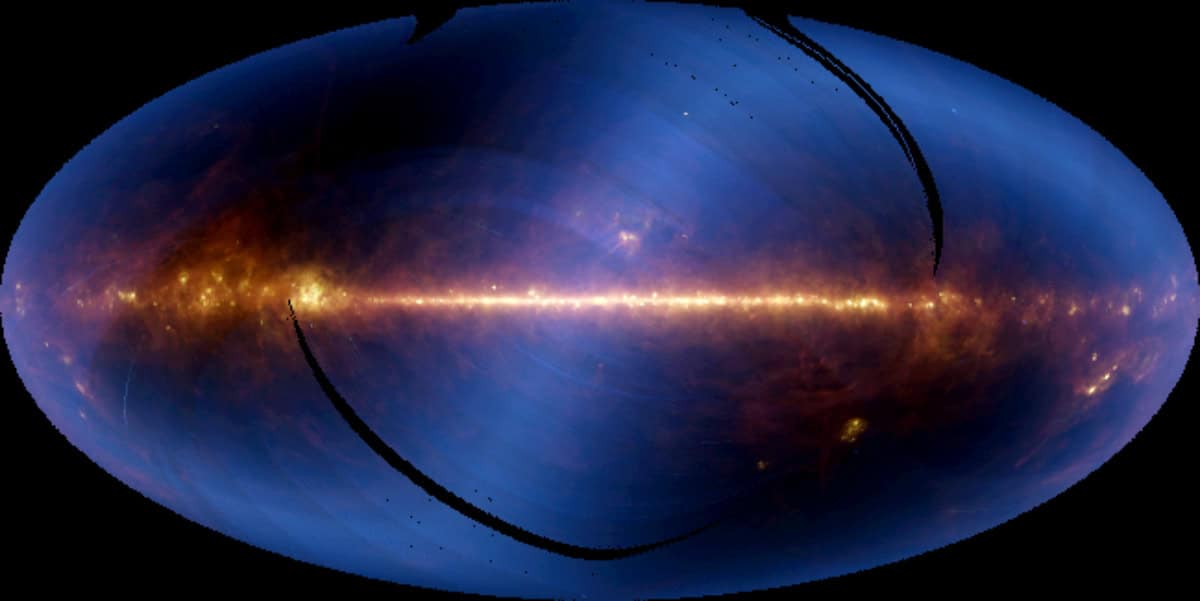
Image assembled from six months of data from the Infrared Astronomical Satellite or IRAS

In the early days of optical astronomy, researchers used traditional photographic plates to record individual images of the sky. To look at infrared light, astronomers turned to heat-sensitive detectors, but they’d still have to measure one position at a time, scanning a telescope across a source to build up information sequentially.

That logic changed in 1983 when NASA launched the Infrared Astronomical Satellite, which was the first space-based infrared observatory and had 62 separate detectors. By the 1990s, huge 256 × 256 arrays, encompassing 65,536 detector elements, had become common enough to support detailed infrared imaging of galaxies. Hubble’s Near Infrared Camera and Multi-Object Spectrometer, installed in 1997, used three arrays of this format.

I’ve seen the changes at first hand myself. In 1994 when I was doing my PhD at the University of Groningen in the Netherlands, I published my first paper on near-infrared astronomy, which I’d co-written with an undergraduate student I was supervising. It was based on infrared images of a galaxy taken with a camera on the 2.1 metre telescope at the Kitt Peak National Observatory in Arizona, which used an indium-antimonide detector with just 3596 pixels.

For my PhD itself, however, I observed a sample of galaxies using the European Southern Observatory’s 2.2-metre telescope at La Silla in Chile using a mercury cadmium telluride detector with 65,536 pixels. That was an 18-fold increase over the Kitt Peak camera, yet Roman’s focal plane, with its 18 detector arrays, contains more than 300 million physical pixels.

Progress is not just about pixel count. The advantages of working in space are even bigger because you get none of the atmospheric turbulence or infrared background that you do on Earth. However, it’s not all plain sailing. Space-borne infrared arrays need to be sensitive, uniform, low-noise and reliable; they also have to operate at cryogenic temperatures (roughly 90 K) and endure a harsh radiation environment.

In fact, Roman’s equipment represents decades of progress in materials science, fabrication, electronics, calibration and computing as well as our ability to make pixels ever-smaller. Its infrared detectors are cooled passively by radiators that discharge heat into space rather than by liquid helium.

Larger arrays have also changed what it means to select an astronomical target. A single detector requires an astronomer to decide where to measure: a small array records one selected view. Roman, however, will capture a panoramic field large enough to contain a huge amount of scientifically useful objects. It will transform astronomy, which will be less about choosing what to study and more about working out how to analyse huge data sets.

Looking differently

Roman will not replace targeted observatories or the astronomer’s intuition. Its most intriguing discoveries will often require the James Webb Space Telescope, Hubble or ground-based telescopes to inspect individual objects in greater detail. Instead, these facilities are complementary: one maps entire populations, another inspects exceptional objects, and each changes what the other knows to look for.

Roman’s launch on 30 August lasted little more than half an hour. But the transition the observatory represents has taken decades, driven by larger detectors, faster electronics, public archives and increasingly sophisticated software. I entered professional astronomy when infrared images containing tens of thousands of pixels were normal (see box). Roman will create survey portraits containing trillions of pixels, release its data rapidly to the world and ask humans and machines to explore them together.

When Roman reaches L2 and begins returning science data, its most important legacy may be a way of observing in which the sky becomes a shared, continuously growing dataset. And discovery begins with learning how to explore it.

The free-to-read Physics World Big Science Briefing 2026 is out now

This summer in the Northern hemisphere has been a real scorcher with Western Europe experiencing prolonged hot and dry conditions that have fueled extreme wildfires across the region.

With that weather set to become the norm rather than a one-off event, everyone will need to do their bit to curtail the impact of climate change and “big science” is no different.

Front cover of the 2026 Big Science Breifing

In this year’s Physics World Big Science Briefing, we report how accelerator science is making its technologies and facilities more sustainable. The aim is not only to cut the energy and resources that accelerators use, but also to understand – and, more importantly, minimize – their “whole-lifetime” environmental impact.

Longer term, researchers are also prioritizing disruptive accelerator concepts that could slash the size, cost and carbon footprint of next-generation facilities.

One example is plasma-wakefield acceleration, which uses laser- or particle-beam-driven intense “plasma waves” as the accelerating medium, yielding electric fields up to 1000 times greater than in classical accelerators. Those ultra-high accelerating gradients promise a significant reduction in the size, cost and carbon footprint of next-generation accelerator facilities.

Commercial considerations

With the world’s energy demands increasing, and our impact on the climate becoming ever clearer, the search is on for greener, cleaner energy production. That’s why fusion energy has undergone something of a renaissance in recent years.

According to a report by the Fusion Industry Association on the state of the fusion industry, 71% of the 56 private fusion companies surveyed for the report expect the first fusion plant to deliver commercial electricity by the 2030s.

One of the companies with such ambitious aims is Focused Energy, a laser-fusion firm based in Germany and California, which is attempting to generate energy from the laser-driven fusion of hydrogen isotopes.

In this briefing, Debbie Callahan, chief strategy officer at Focused Energy, describes how they plan to have a pilot plant, dubbed LightHouse, operational by the end of the 2030s.

While many milestones need to be hit before we see fusion generating electricity for the grid, when it comes to meeting the demands of a changing climate, big science is continuing to play a key role. Indeed, sustainability will be a keyword at this year’s Big Science Business Forum held in Maastricht from 27–30 October.

We hope you enjoy the briefing and let us know your feedback on the issue.

Producing hydrogen, electricity and freshwater with one reactor

The majority of hydrogen comes from natural gas, produced in a process called Steam Methane Reforming. Even though this process is relatively cheap, it has the downside of producing significant amounts of the greenhouse gas carbon dioxide. Alternatively, hydrogen can be made by splitting water, a process that requires electricity for electrolysis and therefore another energy source, as well as large supplies of water. There is an ongoing desire for low-carbon electricity, clean hydrogen for industry (e.g. steel manufacturing, fertiliser manufacturing and heavy transport), and greater freshwater supplies, particularly in water-stressed regions.

In this work, the researchers investigate how a small nuclear reactor can be used to produce all three: hydrogen, clean electricity, and freshwater through seawater desalination. A small modular reactor produces 200 MW of thermal power. The heat creates steam that drives turbines and generates electricity. Part of the steam is diverted to a process called High-Temperature Steam Electrolysis, which splits water into hydrogen and oxygen. Because the steam is already hot, less electricity is needed than in conventional electrolysis. After the hydrogen production process, the steam is cooler but still contains useful heat, which is then used in a desalination plant to convert seawater into freshwater.

The integrated system was able to simultaneously produce around 90 MW of electricity, 0.6 kg/s of hydrogen (~52 tonnes/day), and 612 m³/day of freshwater from a single reactor module. By reusing waste heat from hydrogen production to drive desalination, the overall energy utilisation increased from 48% for electricity generation alone to 53% in the full tri-generation system.

The researchers evaluated two operating modes: a self-sufficient option, where desalinated water is used internally for hydrogen production, and a market-led option, where freshwater is sold externally. The market-led scenario achieved lower hydrogen production costs ($2.93-3.19/kg compared with $3.49-3.88/kg for the self-sufficient scenario) due to the additional revenue from water sales.

Overall, the study demonstrates that a small modular nuclear reactor could be used to produce clean electricity, hydrogen, and freshwater, offering an efficient and potentially attractive solution for water scarce regions seeking low carbon energy and industrial hydrogen supplies.

Do you want to learn more about this topic?

Energy storage in long-term system models: a review of considerations, best practices, and research needs by John Bistline et al. (2020)

Voltage switches exciton transport in 2D hybrid material

Information can be transported using electrons, for example in conventional computing, or using light in photonic devices. A third option that researchers are exploring is the use of excitons, which are bound electron-hole pairs created when a material is excited by light. Excitons can be thought of as an intermediate state between light and electrical charge carriers. However, excitons typically recombine quickly and emit light or undergo non-radiative recombination, limiting how far they can travel. One way to extend their lifetime is to separate the electron and hole across two different material layers, creating an interlayer exciton that can transport energy over longer distances.

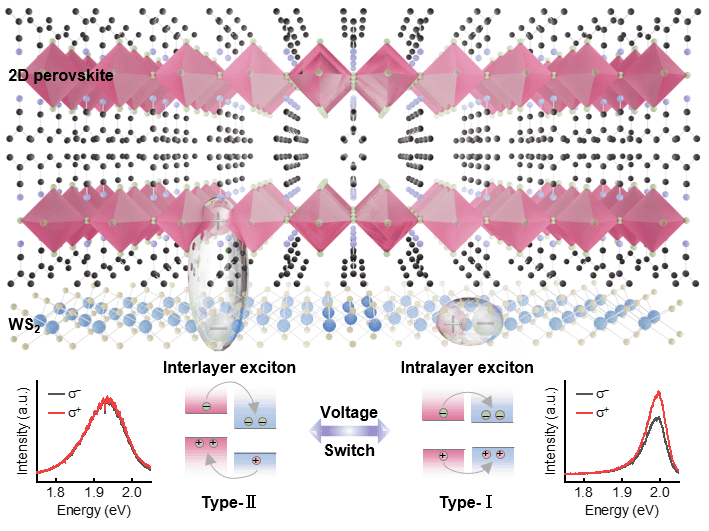
Previous studies have used stacked transition-metal dichalcogenides such as MoSe₂/WSe₂ or WS₂/WSe₂, which require extremely precise rotational alignment between layers to form prominent interlayer exciton emission. In this work, however, the researchers use a hybrid perovskite-WS₂ heterostructure that does not require such careful twist-angle engineering. They demonstrate a device in which an applied voltage switches between two different exciton states—interlayer excitons and intralayer excitons, allowing them to control whether excitons can move through the material or remain localised.

Schematic illustration of the WS2/(iso-BA)2PbI4 heterostructure, showing the electrical switching and polarization dynamics between interlayer excitons and intralayer excitons.

Valley polarisation describes how strongly carriers favour one of two equivalent energy minima, known as valleys. The researchers used voltage to switch the device between low and high valley-polarisation states between these two different exciton states, allowing them to electrically control a form of information carried by excitons. This capability is an important step toward future valleytronic devices, which aim to use valley states for information processing.

More broadly, the research demonstrates a practical way to electrically control both energy transport and information states in a 2D material system, bringing excitonic and valleytronic circuits a step closer to reality.

Read the full article

Switchable band alignment in 2D-perovskite/WS2 heterostructures for tunable exciton transport and valley polarization

Yingying Chen et al 2026 Rep. Prog. Phys. 89 078004

Do you want to learn more about this topic?

Valley manipulation in monolayer transition metal dichalcogenides and their hybrid systems: status and challenges by Siwen Zhao et al. (2021)

Miniature microprobe enables internal imaging of smaller blood vessels than ever before

Cardiovascular disease is the leading cause of death globally, with atherosclerotic disease – caused by the build-up of fatty plaques in the arteries – responsible for around three-quarters of these deaths. Modern intravascular imaging allows us to see these fatty plaque build-ups in detailed cross sections, revolutionizing atherosclerosis diagnosis and treatment planning. A research team in China is pushing this imaging technique to smaller blood vessels and higher resolution than ever before. Their approach could even enable imaging of the cerebrovasculature – the network of tiny vessels within the brain.

Intravascular optical coherence tomography (IV-OCT) uses near-infrared light emitted and received at the end of a catheter to image the walls and texture of the blood vessel. It works by comparing the wavelength and phase offset of reflected light from tissues with reference light reflected from a mirror, with 360° sensor rotation generated by electromagnetic motors.

The two most common designs of OCT catheters are proximal (where rotational force is generated outside of the body) and distal (with rotational force generated by a small motor inside the catheter). However, proximal systems suffer from friction-induced rotational distortion in smaller vessels, while distal scans are blocked from full 360° vison by wire artefacts.

Size is a major limitation in IV-OCT imaging. The catheters traditionally used are around 2 mm in diameter and perform optimally in vessels of 10 mm in diameter – medium/large arteries in the body. This diameter is limited by the size of electromagnetic motors needed to induce the sensor rotation and the wiring of these motors.

In this latest work, the researchers – led by Dawei Wu at Nanjing University of Aeronautics and Astronautics and Rui Liu at Nanjing University Medical School – show that it is possible to make a tiny 0.55 mm diameter probe, optimal for imaging 2 mm vessels, whilst retaining 360° field-of-view. The piezoelectric microprobe achieves this small size, and resolves both the rotational distortion and limited field-of-view difficulties, by exploiting a functionally different miniature drive mechanism.

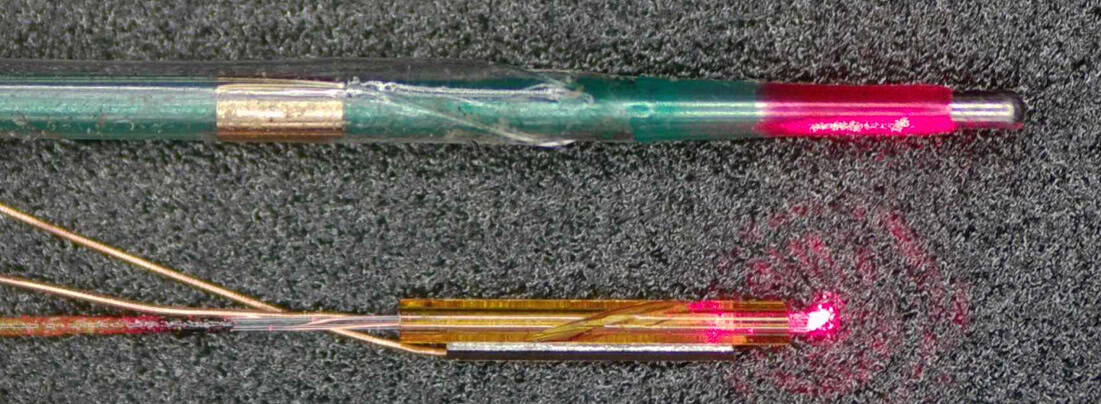
A piezoelectric micro probe and a commercial balloon dilatation catheter

The microprobe uses a single-phase AC circuit and piezoelectric crystal to vibrate a glass tube. A 10° groove in the glass translates this longitudinal vibration into torsional vibration, thus generating elliptical motion of the lens in a similar way to a crank and slider. When AC voltage is applied, the piezoelectric crystal expands and contracts and the lens rotates, thereby producing the required optical scanning.

Device testing

First author Boquan Wang and colleagues first tested whether their probe reduces rotational distortion by imaging metal tubes arranged around a small, curved vessel. The probe was able to scan the tubes at 50 revolutions per second while maintaining angular deviation of just 1° – a significant improvement compared with the 9° found in traditional proximal IV-OCT catheters. They note that this test also demonstrated the probe’s full 360° field-of-view and that the single-phase voltage required to rotate the lens meant that the wiring was minimal.

The researchers confirmed the probe’s ability to navigate and image small vessels via successful tests on leaf microveins, a vascular stent and ex vivo pig vessels. In an important milestone in assessing the suitability of the probe for imaging the cerebrovascular system, the probe successfully traversed through a full-scale human vascular model to reach the middle cerebral artery.

Finally, to verify the efficacy of the probe in identifying pathological lesions, the team compared images of human plaques acquired by the probe with histological analyses. The OCT and histology findings agreed well in identifying locations of plaque rupture sites and regions high in collagen fibres.

Why does this matter?

By putting a novel miniature rotational motor directly inside the probe and powering it with a single-phase AC circuit, the team created a probe that’s smaller than traditional IV-OCT probes and eliminates rotational torsion artefacts while achieving full 360° imaging.

Importantly, the improved catheter navigation could allow access to high-resolution images of the structure of arterial walls in smaller, more curved vessels than is currently possible clinically. This opens the door to assessment of plaque pathology and planning of stent positions in the heart–brain system.

“Although the probe would need more development and testing to be used clinically, intravascular OCT could one day give physicians a much closer look at what is happening inside the small arteries of the brain,” says Wu in a press statement.

The researchers describe the microprobe in Biomedical Optics Express.

Real-time multi-gas sensing

Detecting several gases at once is crucial in areas such as environmental monitoring, industrial physics and fault diagnosis in electrical equipment. Methane is a key sign of natural-gas leakage, while acetylene, can indicate high-temperature faults such as arcing in transformer oil.

The challenge right now is that many sensitive gas sensors either need separate detectors for each gas or measure gases one after another, which means they cannot capture truly simultaneous changes.

A team of researchers from the Harbin Institute of Technology in China have recently developed a new approach using light-induced thermoelastic spectroscopy, or LITES.

In this method, gas molecules absorb modulated laser light resulting in a small amount of heating. This in turn causes tiny mechanical vibrations in a quartz tuning fork. These vibrations are then converted into an electrical signal.

The clever part in the new work is a technique called orthogonal phase modulation. Two lasers are modulated so that their effective signals act orthogonal to each other in signal space. A lock-in amplifier can then split the combined tuning-fork signal into two independent outputs, one for methane and one for acetylene.

The signal separation is described using Lissajous figures, which are patterns produced when two vibrations combine. When the two signals are exactly orthogonal, the unwanted mixing between channels remains very low.

After averaging, the detection limits reach 0.32 parts per million for methane and 0.29 parts per million for acetylene – this is good sensitivity but not record-breaking.

The significance of the work lies not in the detection limit, but the new method. If this phase-separation approach can be extended beyond two gases, future instruments might monitor several chemical species with fewer detectors, fewer demodulation channels and less hardware complexity.

That could have big consequences for industrial safety, greenhouse-gas monitoring, transformer health, combustion diagnostics and enclosed-space gas alarms. The next step would be showing that the method remains stable outside controlled lab conditions and in more complex gas mixtures.

How scientific publishers are fighting back against fraudulent papermills

Hand typing on a laptop keyboard in low lighting

On 17 April 2016 Elisabeth Bik, a microbiologist at Stanford University, published a paper that shocked the world of medicine – and also shook the foundations of scientific publishing. Working with Ferric Fang from the University of Washington in Seattle and Arturo Casadevall from the Johns Hopkins School of Medicine in Baltimore, she conducted a huge study into image duplication and manipulation covering more than 20,000 published papers in 40 journals published between 1995 and 2014.

Together, the team documented 782 instances of image duplication – where the same photo, graph or data is reused improperly to represent different experiments – as well as 196 published papers that contained “duplicated figures with alteration”. Before the paper, Bik had anonymously been submitting reports on plagiarism and image duplication to journal editors, which she was motivated to do after discovering that someone had plagiarized her own work.

But following the paper’s publication, Bik became a scientific “sleuth-in-chief”, kickstarting a whole industry of so-called amateur scientific sleuths, to which she provided advice and mentorship. In 2024 she was awarded the Einstein Foundation Award for “identifying misconduct and potential fraud in scientific publications, highlighting science’s problems policing itself”. She donated the €150,000 prize money to the non-profit Center for Scientific Integrity to create a fund that supports fellow sleuths.

Bik’s work was a wake-up call not only for academics, but also for scientific publishers, journal boards and journal editors to focus on, and hopefully halt, scientific misconduct. IOP Publishing, for example, which publishes Physics World, employs a team of six research-integrity officers handling misconduct cases, which has become a far bigger problem than 10 or 20 years ago. Back then, examples of scientific misconduct, which mostly involved data fabrication, plagiarism or self-plagiarism, were notorious – certainly in physics – for their rarity.

One high-profile outlier involved the Bell Labs physicist Hendrik Schön, whose work promised to revolutionize the fields of organic electronics, superconductivity and nanotechnology. He published several high-profile papers in journals such as Nature and Science, but some scientists gradually began to notice that data in some of his figures appeared to have been duplicated. An independent committee was set up to investigate and in 2002 it found that Schön had fabricated data and falsified reports in 16 of 24 papers published between 1998 and 2001.

More recently, condensed-matter physics was hit by another high-profile case in which Ranga Dias claimed to have discovered superconductors that could operate at high pressures and ambient temperatures. A subsequent investigation by the University of Rochester in New York, where Dias was employed, concluded that he had committed misconduct, including data fabrication.

While misconduct generally used to be carried out by an individual looking for academic notoriety, it has now evolved into a co-ordinated and commercial activity that is tapping into science’s dependence on metrics when it comes to prestige and career progression. Referred to as “papermills”, these businesses sell authorships, citations, data and even produce full papers. Such papermills have evolved incredibly quickly to evade publisher checks and the peer-review process. Papermills also often market their services to students, promising guaranteed acceptance and citations.

Few people at the time of Bik’s discovery, however, could have foreseen the growth of artificial intelligence (AI) and machine learning (ML). These developments have given bad actors a powerful new tool – letting them rapidly increase their output and also target journals that lack the necessary checks needed to stop scientific misconduct at scale.

Scientific publishing terms at a glance

Open access Where research and academic work is free for everyone to read, share and use online.

Article processing charge A fee paid by an author or their funder to make a research paper open access.

Peer review An evaluation process where academic or scientific research is scrutinized by experts in the same field before it is published. Its main goal is to check the validity, accuracy and quality of a study to ensure only credible work enters the scientific record.

Impact factor A number that shows how often articles in an academic journal are cited in other research papers. It helps measure the relative importance or rank of a journal within its field, with a higher number meaning the work published in the journal is used more often by other scientists.

Papermill A shady, profit-driven business that creates fake or poor-quality scientific manuscripts and sells co-authorship on them to researchers.

Predatory journals Deceptive, profit-driven publications that claim to be legitimate scholarly journals but bypass proper peer review, editorial oversight and quality control. Their main goal is to trick researchers into paying an article processing charge without offering real academic services.

Artificial intelligence Intelligent behaviour exhibited by machines. But the definition of intelligence is controversial so a more general description of AI that would satisfy most is: the behaviour of a system that adapts its actions in response to its environment and prior experience.

Machine learning As a group of approaches to endow a machine with artificial intelligence, machine learning is itself a broad category. In essence, it is the process by which a system learns from a training set so that it can deliver autonomously an appropriate response to new data.

Large language model An artificial intelligence program trained on massive amounts of text to predict the next word in a sequence, allowing it to write text, translate languages, answer questions and power conversational chatbots.

Dark side of science

The term “publish or perish” is a well-worn phrase in academia. It originates because scientific success is often measured by the number of high-impact articles a researcher has co-authored. Publishing in high-impact-factor journals, and the citations that often generates, can affect an academic’s career and influence job or grant applications. Some institutions have been known to even award cash bonuses for publishing in such journals; with research contracts even not being renewed when a researcher can’t keep up with the publication rate required.

This pressure to publish is partly why publishers and journals have grown so much in recent years. That is especially so for open-access journals, which remove the requirement for traditional subscriptions. Articles are instead made immediately and freely available for anyone to read, with publication costs covered by authors who pay an article-processing charge, which can typically be around £2500 per article and rise to as much as £10,000.

That cost has made scientific publishers less reliant on journal subscription fees paid by libraries and more on income earned from individual scientists. According to an analysis carried out in 2023 by researchers in Canada and Germany, scientists globally paid more than $1bn in open-access fees between 2015 and 2018 to the big five academic publishers: Elsevier, Sage, Springer Nature, Taylor & Francis, and Wiley.

But as the popularity of open-access journals has risen, so too has the growth of “predatory” journals. They exploit the open-access model – and the need for scientists to boost their publication records – by taking publication fees but not carrying out a proper peer-review process, if at all.

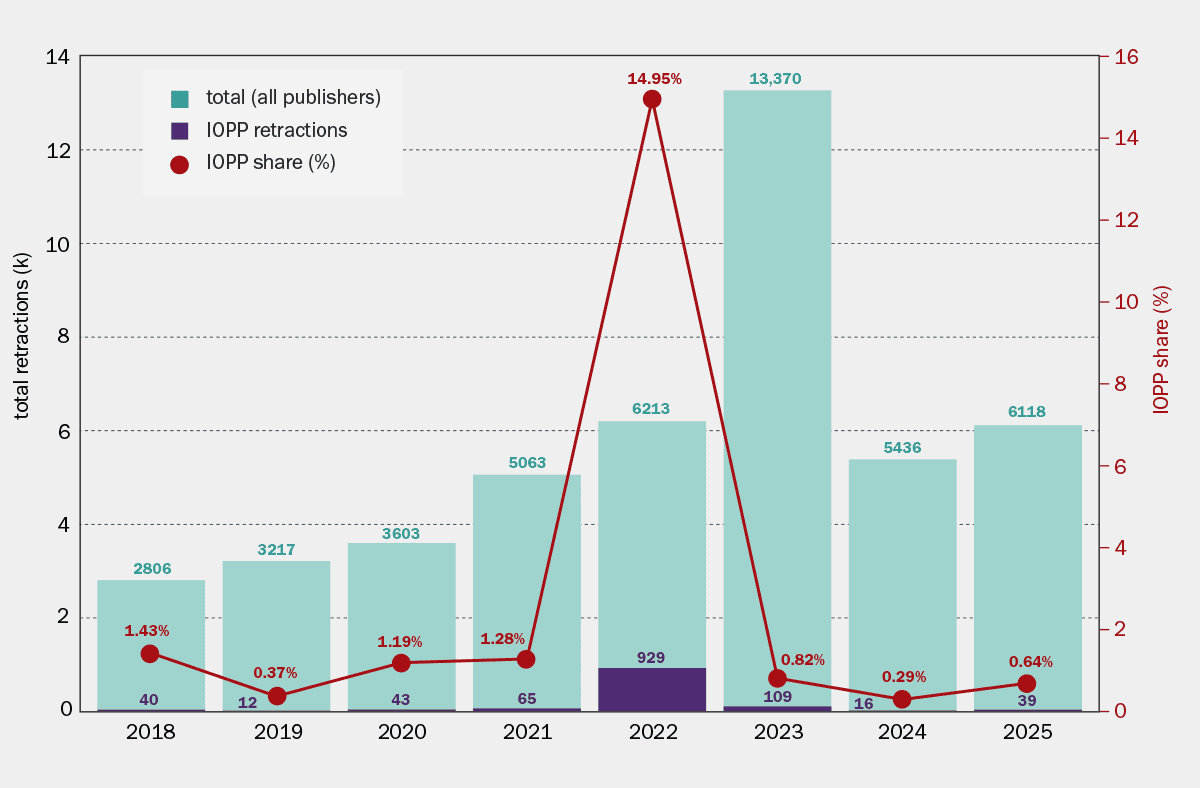
A study in 2025 by researchers at Northwestern University found that the publication of fraudulent science, aided by papermills, is now at a point where it is outpacing the growth rate of legitimate scientific publications. According to the Retraction Watch Database, which is now part of the not-for-profit organization Crossref, some 13,000 papers globally were retracted in 2023, compared to roughly 6000 in 2022 and 5000 in 2021 (see figure 1). There are now more than 60,000 retractions in the Retraction Watch Database, with estimates of the number of papermill papers that did manage to make it into the scientific record at 10 times that number.

1 Fighting back

Chart of retractions per year 2020 to 2025

Papermill activity in the early 2020s led to a significant rise in the number of retracted articles, according to data from Retraction Watch. Publishers subsequently built up research integrity teams and developed new tools to tackle the issue, but it still remains a significant challenge within scholarly publishing.

Part of that increase has been the huge growth in the use of AI tools and techniques. AI is particularly potent in microscopy, where generative AI has made it simple to generate fake images of any microscopy technique within minutes that are indistinguishable from real pictures. Indeed, it is estimated that between 1999 and 2024, about 10% of papers published in cancer research were from papermills. An analysis carried out in 2023, meanwhile, found that about 400,000 papers across all disciplines – representing about 2% of all published papers – were from papermills.

In 2022 Anna Abalkina, a research-integrity sleuth and social scientist at the Free University of Berlin, spotted papers with author e-mail addresses that had domains that did not match where the academic institution was based. In a subsequent analysis the papermill – which was dubbed Tanu.pro and is one of the largest in Europe – was found to have produced 1517 papers between 2017 and 2025. It also listed more than 4500 researchers affiliated with around 460 universities across 46 countries. The majority of the authors were in Ukraine, Kazakhstan and Russia.

The trouble that scientific publishers have is that Al allows a paper to be produced at the click of a button, which comes with some unintended consequences. In 2021 computer scientist Guillaume Cabanac from the University of Toulouse and colleagues discovered the use of “tortured phrases” in thousands of research paper thanks to algorithms taking the names of scientific terms rather too literally. Examples include “Sun oriented force” for solar energy, “motor vitality” for kinetic energy or “counterfeit consciousness” for artificial intelligence.

Cabanac began his efforts charting scientific misconduct in 2020 by working with the computer scientist Cyril Labbe to spot gibberish in computer-science papers that were automatically generated using SCIgen, a piece of software that can produce a scientific paper with just a few prompts. “My research began to move towards the quantitative study of science and so we began to collaborate,” notes Cabanac. The pair’s work led to thousands of papers being retracted with Cabanac adding that the scale of use of these tortured phrases in the literature was “a surprise”.

Cabanac says that as AI tools have improved, there are fewer papers with such phrases being published, and spotting misconduct now involves different “smoking guns”. In 2023, for example, Cabanac was one of the first to identify the so-called “regenerate response” fingerprint in dozens of publications. This specific phrase is the label of a button on ChatGPT and while many publishers allow authors to use large language model (LLM) tools to help them produce manuscripts, they must declare it. The problem was that many authors did not make such a declaration, but left the fingerprints of LLM use in their manuscript.

Cabanac says that the latest misconduct smoking gun can be found in bibliographies and the growing use of hallucinated references – citations to other papers that have been simply made up by an LLM. Along with data falsification, other forms of scientific misconduct include citation manipulation, in which irrelevant or unnecessary references are added to boost the citation figures of a colleague or other author. This can also be reciprocal, in which groups of scholars cite each other’s work.

Some fields suffer more than others. In mathematics, for example, the number of research papers and general citations are quite low, which makes citation numbers more prone to manipulation. In 2023 data firm Clarivate announced it would exclude the entire field of mathematics from their influential list of “highly cited researchers” due to the issue of citation manipulation – a decision it reversed two years later.

Run of the papermill

The boom in AI techniques and papermills has been a real headache for publishers, with papermill “attacks” resulting in mass retractions in recent years. Such attacks involve co-ordinated, industrial-scale assaults on academic journals, flooding editorial offices with large batches of fake, plagiarized or completely fabricated research manuscripts. While some papermills function in the so-called “shadow market”, others are officially registered businesses, or mimic legitimate businesses with a website offering services.

Although papermills have targeted all types of journals including open access and subscription and any publisher regardless of size, they have mostly focused on conference proceedings and special issues. They make for easy targets thanks to their softer-touch peer review and use of “guest editors” who are responsible for overseeing the peer-review process for the issue.

Illustration of two people at desks piled high with paper

In 2022, for example, IOP Publishing retracted nearly 500 articles in one go, of which the vast majority – 463 articles – came from the Journal of Physics: Conference Series. In 2024, meanwhile, the Swiss National Science Foundation stopped paying article-processing charges for articles published in special issues over quality concerns.

Yet the problem is not solely focused on conference proceedings and special issues. In 2023 the Public Library of Science (PLOS) retracted more than 100 papers from its flagship journal PLOS One over manipulated peer review. That same year, Hindawi and its parent company Wiley identified some 1200 articles that had compromised peer review and were retracted – a few months after Hindawi had announced that it would retract 511 articles across 16 journals for manipulated peer review.

Wiley then announced it would end the Hindawi brand name, costing the company up to $40m in lost revenue, and compelling it to integrate its 200 journals into Wiley’s 2000 journal portfolio. Yet the issues didn’t go away for Wiley, and in March 2025 the publisher retracted a further 250 papers.

Fighting AI with AI

Since the issue of papermills has come to a head in the last few years, publishers are fighting back (see box “How IOP Publishing is tackling the rise of papermills”) and the industry as a whole is taking action. The Committee on Publication Ethics (COPE) – a non-profit organization founded in 1997 that aims to define best practices and promote integrity in scholarly publishing – has issued new guidance on the use of AI in publishing.

Publishers are also pooling their resources into the STM Integrity Hub, which is run by the International Association of Scientific, Technical & Medical Publishers (STM). This cloud-based platform offers services that publishers can use to examine a variety of patterns that are indicative of papermills or other research integrity concerns, serving as an “early warning system” for integrity issues.

Futuristic-looking computer circuit with an attachment labelled "AI agent"

Antonia Seymour, chief executive of IOP Publishing, which is a member of STM, thinks that the rise in fraudulent papers is one of the most concerning issues for the whole scholarly ecosystem, with initiatives like the STM Integrity Hub being critical. “All publishers are being attacked by these bad actors trying to infiltrate the system with fraudulent papers,” she says. “The STM Integrity Hub is about combining signs of fraud not just from our corpus of content, but from other publishers as well.”

Other programmes supporting research integrity are Silverchair and Morressier, which check submission criteria such as missing author information (for example, e-mail address and institutional affiliation), missing ethics statements or missing keywords; and also confirms author identities using ORCiD. Somewhat ironically, they both use AI to beat AI by running the text through AI tools to check for tortured phrases, fraud and plagiarism as well as analysing citations.

Last year, the Science family of journals, run by the American Association for the Advancement of Science, adopted the use of Proofig, an AI-powered image-analysis tool, to screen for manipulation. ImageTwin is another programme that can detect image duplication and manipulation as well as spot AI-generated content.

Cabarnac, meanwhile, has worked with the French National Centre for Scientific Research (CNRS) to develop an online bibliography checker called bibCheck. “I’ve personally used bibCheck to flag hallucinated references in manuscripts I have reviewed,” says Cabarnac. “Finding these informed my decision to immediately reject.”

How IOP Publishing is tackling the rise of papermills

Many publishers have had to respond to the rise of papermills and fraudulent papers (see main text). That includes building up internal integrity teams and investing in new technology to manage the huge numbers of allegations and corrections.

“Retraction reporting is often reliant on self-declaration by publishers, therefore these figures are likely underestimating the scale of retractions out there,” says Kim Eggleton, research integrity manager at IOP Publishing, which publishes Physics World. “We’re of the opinion that retracted articles should be very clearly marked and we report all our retractions to Retraction Watch and PubPeer.”

Since 2023 IOP Publishing has also donated revenues from author-processing charges (APC) that it has earned from retracted works to charity, supporting Research4Life, which helps researchers in low- to middle-income countries to access published work.

Thanks to technological developments, and the work of some “scientific sleuths”, it is becoming easier to spot problematic papers. At the same time, that brings challenges to work through them all, contacting the authors and giving them a chance to explain.

At the start of 2021 IOP Publishing had one part-time position handling cases of misconduct; now it has one research integrity manager as well as six research integrity officers, all of whom are full time and fully trained to guidelines outlined by the Committee on Publication Ethics. The organization has also strengthened its screening process for conference organizers and invested in new technology.

IOP Publishing rejects about 55% of roughly 7000 submissions each month before they have even been sent for peer review. About 700 of those rejected papers are due to research integrity concerns. IOP Publishing’s research integrity team, which works on cases raised both before and after publication, typically has hundreds of papers under investigation at any one time.

But it is not only the papers themselves that can be fraudulent; there are even fraudulent peer-review reports. IOP Publishing has developed a machine-learning tool to detect duplicate peer-review reports – where the same reviewer report is sent for multiple submissions. The most egregious examples of this are “review mills”, organizations churning out fake reviews, often to inflate citations for a paying customer.

Until now, such patterns in reviewer reports had been difficult to identify, but the new tool automatically flags duplicate reviews to editorial teams. Indeed, since its pilot in 2024, the tool has processed around half a million reviewer reports dating back to 2020, identifying nearly 2500 cases where more than 60% of the content closely matched other reviews. These included instances in which reports were reused across multiple manuscripts or submitted under different reviewer names.

Any duplicate report submitted is flagged for investigation to IOP Publishing’s research integrity team. “This tool is a powerful addition to our efforts to defend high peer-review standards and weed out bad actors who try to manipulate the peer-review process,” says Eggleton. “It reflects our commitment to tackling unethical reviewing practices head-on and reinforces our role as a trusted, transparent and responsible publisher.”

Researchers are aware that the problem will not resolve itself and that publishers also cannot do all the fraud prevention alone. There are calls for researchers to undergo compulsory training in research ethics, and for journals to require raw instrument file datasets as a criterion for publication, as well as having dedicated conference sessions on combating AI risks. In 2025 Sense about Science and Taylor & Francis released a research integrity toolkit, created with and for early-career researchers, that answers common questions and provides practical advice.

Some have suggested that replication could and should be incentivized, perhaps by journals inviting a research group to replicate studies that are getting considerable attention in their journal (for example, studies with suspected AI-generated images), or inviting the replicating group to submit their replication for publication in the same journal. The replication study could then be linked to the original publication, and given an appropriate level of prominence.

But all these approaches take time and money. After several years of large numbers of retractions, in 2024 the number of retractions globally dropped back down to 5000 (see figure 1) – although many will still see that as being too much and others still estimate that figure to be much larger. The reality is that a lot of fraudulent material still exists in the scientific record, and may never come to light or be removed. Indeed, of the 782 papers that Bik found problematic in her analysis, only 177 have so far been retracted, with 42 having an expression of concern and 256 having been corrected. The remaining 307 remain in the scientific record untouched.

That is an issue that Seymour at IOP Publishing says must be resolved. While organizations like Clarivate are trying to clean up the scholarly record by potentially delisting a journal if it has found to be publishing too much fraudulent content, that can actually be a disincentive for publishers to go and find cases of fraudulent research in their journals. “Transparency and correcting the record is really important,” adds Seymour. “But at the moment, we’ve got quite a lot of sticks for publishers and perhaps not enough carrots.”

Dirty magnetite nanoparticles keep cleaning up dyes

Each year, approximately 5000 tonnes of dyes (about 50 times the weight of a blue whale) are discharged into industrial wastewater. These dyes block light from reaching aquatic plants and animals, cause unpleasant odours and pose risks to human health. Congo red, for instance, is notably persistent in the environment. Another dye, methyl orange, is difficult to remove using standard biological or chemical treatments and has been linked to cancer and DNA damage. Researchers in Egypt and the US are devising a new method to clean up such contamination.

One of the well-established routes for cleaning wastewater from dyes is using nanoparticles (of similar size to a small virus) with high surface area, which gives the dye molecules plenty of places to adsorb onto the nanoparticle surface. It’s especially useful if the nanoparticle has magnetic properties – then it’s possible to remove nanoparticles with adsorbed dyes from water using a magnet. The nanoparticles can then be washed and reused, for up to four cycles, enabling the same material to be used again and again instead of being thrown away.

Ideas for breakfast

Lead researcher Hebatullah Hassan Farghal from The American University in Cairo and her team have synthesized magnetite nanoparticles (particles made from a naturally magnetic form of iron oxide) directly in dye-polluted water. As the particles form, they pull the dye molecules out of the water and onto their own surfaces – meaning that the water is left with less dye in it. The researchers then used those same “dirty” nanoparticles to capture two entirely different dyes afterwards. This route, described in RSC Advances, skips the usual “make-wash-dry-treat” sequence. Instead, it offers a more efficient, simpler and greener way to create a working wastewater adsorbent.

Farghal’s previous research work had been on magnetic adsorbents. “The idea for this paper came exactly one or two days after my PhD defence,” she explains. “While I was having breakfast, I realized adsorbent synthesis requires time and cost…I then went to the lab and started my experiments to find that it was successful.”

Catch and catch again

First, Farghal loaded the nanoparticles with two dyes – congo red (CR) and bromocresol green (BCG) – as they formed in the wastewater. More than 90% of both dyes stuck to the particles and the loaded particles grew slightly larger (about 34 nm, compared with 26 nm for plain magnetite). Later, the same “dirty” particles went on to adsorb almost 80% of methylene blue (MB) from a single-dye system after about 3 h, dropping to just over 50% when a second dye, methyl orange (MO), was mixed in.

To reuse the particles after adsorption of MB, the researchers rinsed them in alcohol, which pulled the trapped blue dye molecules back off. They repeated this four times without any drop in performance, and none of the originally loaded dyes leaking out in the process. They note that MB removal worked best at high pH, where the nanoparticles become negatively charged (while MB molecules are positively charged). This electrostatic attraction gave the main mechanism an extra boost.

Simulations second the results

There are several different mechanisms that can happen when a dye molecule attaches to the surface of a nanoparticle. The two most common types are chemisorption, where the molecule forms new chemical bonds with the surface, and physisorption, a weaker attraction more like static cling – no permanent bond is formed, and the molecule can be pulled off relatively easily.

Several lab measurements, including infrared spectroscopy of the particle surface, already hinted that physisorption is the main mechanism responsible for binding CR, BCG and MB molecules to nanoparticles. This weak binding is also why the ethanol wash could strip the dye back off without damaging the particle.

To confirm this idea, the team also ran a computational method called density functional theory (DFT) on a single dye molecule sitting on a magnetite surface. All dyes bound with similar strength. The simulations also showed electrons flowing in opposite directions depending on the dye’s charge – from the negatively charged CR and BCG toward the surface, and from the surface toward the positively charged MB – the same charge attraction seen in the lab.

The researchers point out that DFT and experimental outcomes cannot be compared quantitatively, only qualitatively, since the first one examines a perfect molecule on an ideal surface and the second one concerns real-world conditions. They note that the DFT analysis was carried out by Ahmed A Abokifa and Mohamed S Mohamed from the University of Illinois Chicago, with Mayyada El-Sayed supervising the wider study.

Outside of the lab

In standard tap water or saline (3% NaCl), the story gets more complicated. The researchers increased the adsorbent dose by roughly 15 times – from 0.67 to 10 g/l – to try to compensate for real-world conditions. This worked in saline, but removal in tap water was only about half of what it was in distilled water, likely because calcium, magnesium and other substances naturally present in tap water compete with the dyes for space on the particle’s surface.

“Though the dose significantly increased in tap water and saline, this dose is still applied in the literature,” Farghal says, adding that her future investigation will try to close that gap and reduce costs.

Still, one thing works in the material’s favour: making the particles is cheap. Producing 1 kg costs around $3730 – roughly eight times cheaper than other nanomaterials sometimes used for the same purpose, such as cobalt ferrite (which costs roughly $30,100 per kilogram).

Farghal says her next research will involve “circular economy approaches that will be outside the box.” Circular economy is an approach in which waste from one process becomes a resource for the next – that waste doesn’t have to be wasted. This study is itself an example of that thinking: dye-polluted water became the raw material for a new, useful adsorbent.

Einstein’s equivalence principle put to two new tests

A new quantum test of the weak equivalence principle performed on the China Space Station using cold atom interferometry is the most precise to date, yielding an uncertainty of 2.8 x 10⁻⁸ and a test result of around –2.7 x 10⁻⁷. Meanwhile, a separate team in Israel, Germany and the UK has measured an object’s quantum phase in freefall in the laboratory and confirmed that Einstein’s equivalence principle holds here too.

The weak equivalence principle (WEP), or the “universality of freefall”, is an important pillar of Albert Einstein’s general theory of relativity, in which mass and gravity are intimately linked to the curvature of space–time. The WEP states that, in the absence of other forces, all objects fall with the same acceleration under the influence of gravity regardless of their mass or composition. In other words, gravitational mass (the m in F = GMm/r2, where F is the gravitational attraction between two masses placed a distance r apart and G is the gravitational constant) and inertial mass (the m in F = ma, where a is the acceleration produced by the force F) are the same.

Precisely measuring this principle is crucial since any detected violation could point to new physics. It is also important for continuing to corroborate the theory of general relativity, which may be incomplete because it appears to be fundamentally incompatible with another well-tested theory: quantum mechanics. Today, tests of the WEP using macroscopic bodies have reached extraordinary precision – at the 10−13 level on Earth and 10−15 in space. These latest studies investigate the principle in the quantum realm.

Cold atomic interferometry

Conventional interferometry works by splitting a coherent beam of light and then recombining the different components at a detector. If the two components are in phase when they recombine, the interference is constructive and the two components reinforce each other. However, if the two components are out of phase, they cancel each other out, leading to a characteristic pattern of bright and dark fringes. Atomic interferometry is similar but relies on beams of atoms rather than beams of light.

Cold atom interferometry (CAI), which is atomic interferometry at ultracold temperatures of just above absolute zero, has found applications in inertial sensing and fundamental physics research. It also turns out to be a powerful technique for testing the WEP.

There is a problem with using CAI on Earth, however, because our planet’s gravity limits the interference time of the atom beams to just a few seconds. Experiments in microgravity allow this time to be extended to minutes, but because the resolution of a WEP test scales inversely with the square of the interference time, even longer interference times are needed to achieve the required precision (10−17 or more). This necessitates a permanent microgravity environment, something that is only possible in space.

Clouds of billions of 85Rb and 87Rb atoms

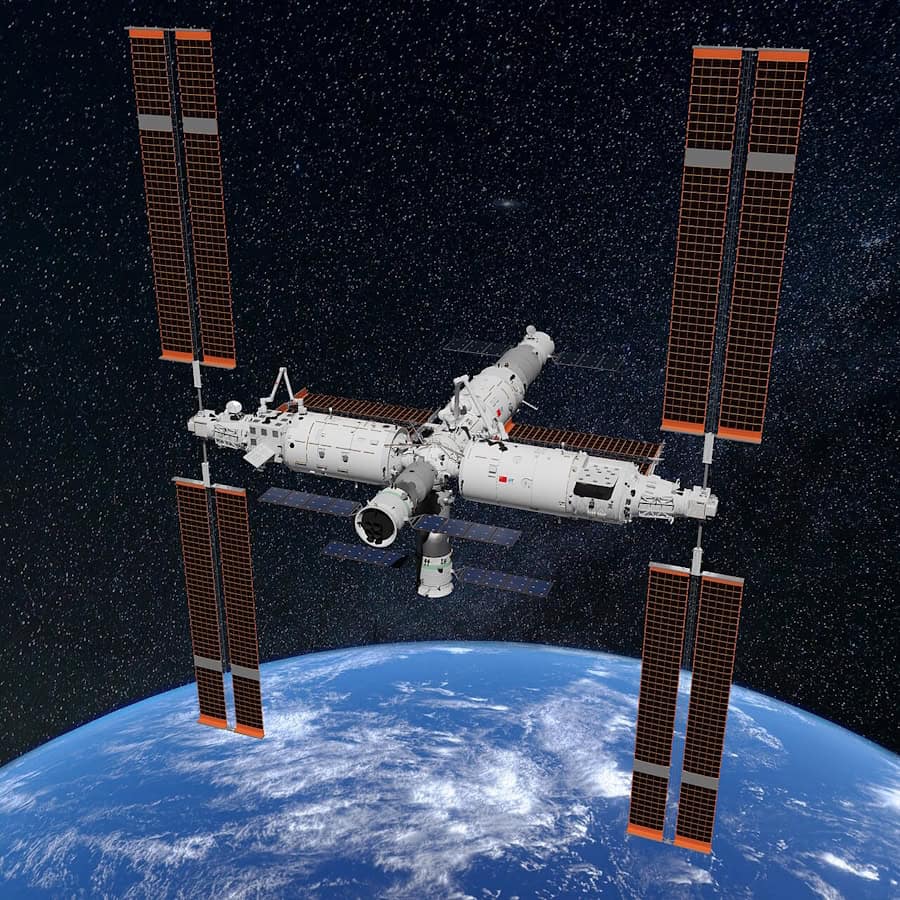
In the new work, detailed in Science Advances, a team of physicists led by Mingsheng Zhan from the Chinese Academy of Sciences, Hefei National Laboratory and Wuhan Institute of Quantum Technology sent their experiments to be performed onboard the China Space Station, using the cold atom interferometer installed on its High Microgravity Level Research Rack. This instrument contains clouds of billions of 85Rb and 87Rb atoms that interfere when probed with counterpropagating Raman lasers reflected by a piezo tilt mirror.

The China Space Station

By exciting and detecting the fluorescence of the isotopes sequentially at slightly different times, the researchers obtained two sets of symmetric interference images, one from the 85Rb atoms and one from the 87Rb atoms. Measuring the differential phase of these images – after suppressing the residual acceleration of the space station and effects from vibrations – allowed them to calculate the difference in the acceleration between the two isotopes in the vertical, freefalling direction.

After running their experiment for 280 days, during which time the researchers acquired more than 9700 pairs of interference fringes, they obtained a test result of around –2.7 x 10⁻⁷, after correcting for errors.

“We believe that our technique will have a significant impact,” says Zhan. “First, it demonstrates that an integrated interferometer meeting the requirements of in-orbit operation is possible, giving the community confidence to continue with even more technically demanding space-based interferometry experiments that aim for ever increasing precision. The technology developed in this project will also itself help advance atom-interferometry-based instruments, such asinertial navigation systems.”

Measuring an object’s quantum phase in freefall

Meanwhile, physicists at the Ben-Gurion University of the Negev, the University of Ulm and the University of Oxford have also used CAI, this time to measure an object’s quantum phase in freefall. They confirm that the effect is the same as predicted by Einstein’s equivalence principle (EP), which states that for an observer in freefall, gravity should locally disappear.

In their work, also detailed in Science Advances, the researchers used a completely novel version of the CAI technique that they call the Quantum Galileo Interferometer (QGI) – in honour of Galileo Galilei’s discoveries regarding the laws of freefall. The experiment, which was carried out at Ben-Gurion University, again makes use of clouds of 87Rb atoms cooled to just above absolute zero.

The researchers began by applying microwave pulses to put the ultracold atoms – which were placed 113 µm below the surface of an atom chip containing current-carrying wires that produce magnetic field gradients – into a quantum superposition. This meant that each atom effectively travels along two different paths at once. One part of the atomic wave responded to the magnetic fields such that an applied upward force exactly counteracted the downward pull of gravity and the wave was held stationary in the apparatus – that is, static relative to Earth. This part of the wave is referred to as the reference atomic wave (or wavepacket). The second part of the wave was sent upwards in a ballistic trajectory.

A magnetic cannon and parachute

Realising this ballistic trajectory, affected only by gravity, required a “magnetic cannon” and a “magnetic parachute”, explains Ron Folman, who is one of the leaders of this study. “After the short-duration magnetic cannon, we switched this part of the wave into a state that is almost unaffected by the magnetic field so that it could fall freely under gravity. And at the end of the fall, we used another precisely controlled magnetic pulse to stop the relative motion between the two waves and reunite the two parts so that they interfered with each other.”

That interference allowed the researchers to measure the tiny difference in quantum phase accumulated while one was falling and the other was held still — two frames that may be referred to as the Einsteinian and the Newtonian frames, respectively. This means that when both parts of the wave have the same velocity, the transformation between the wavefunction in a Newtonian (laboratory) frame of reference and the wavefunction of the same object in an Einsteinian frame that freefalls with the same acceleration, involves a transformation phase known as a gauge phase.

According to their experiments, the gauge phase measured by the researchers is the same as the one predicted when Einstein’s EP is applied to such a quantum wave, so confirming the principle for these quantum objects and at these low masses and energies.

“Some members of our team,” notes Folman, “including Nobel laureate Sir Roger Penrose, expect this co-existence between general relativity and quantum mechanics to break for objects with higher masses. Indeed, the Ben-Gurion University group is now repeating the same experiment with nanodiamond particles to test this hypothesis,” he tells Physics World.

The observation, says study co-leader Vlatko Vedral at Oxford University’s department of physics, constitutes a fundamental test of the interface between quantum theory and gravity. “The connection between these two pillars of modern physics remains one of the most important open questions in physics, and it is thus of paramount importance to understand the phenomenon of freefall and the EP in the quantum domain.”

Impact of VC on high temperature cycling of LFP/Gr cells

Want to take part in this webinar?

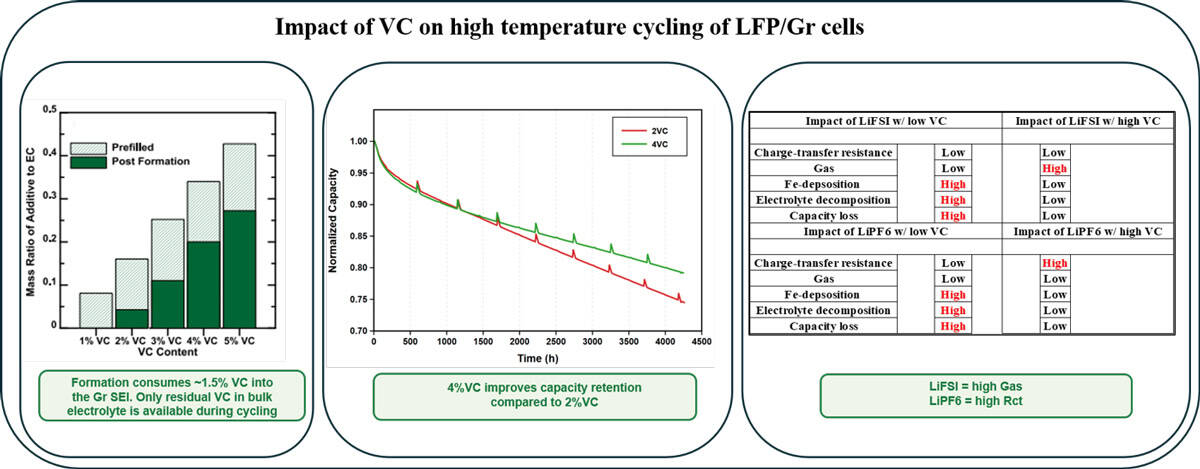
With the growing adoption of LiFePO4 (LFP)/Graphite (Gr) cell chemistry in electric vehicles and grid energy storage, understanding and enhancing its performance under high-temperature conditions has become increasingly critical. In this study, various concentrations of vinylene carbonate (VC) (1% to 5%) were introduced to LFP/Gr pouch cells cycled at 70°C to evaluate their impact on cell lifetime. Additionally, two different lithium salts, LiFSI and LiPF6, were investigated. Upon reaching the end-of-life (80% capacity retention), detailed post-mortem analyses were performed, including qNMR and GC-MS to determine changes in electrolyte composition, micro X-ray fluorescence (μXRF) to quantify Fe deposition on the negative electrode, and electrochemical impedance spectroscopy (EIS) to assess charge-transfer resistance.

Various LFP/Gr pouch cells were evaluated, encompassing four distinct graphite types, two LFP surface area variations, and two cell form factors. The results demonstrate that higher VC concentrations significantly improve cell lifetime, reduce Fe dissolution and suppress electrolyte degradation pathways, including the formation of ethyl methyl carbonate (EMC) and dimethyl 2,5-dioxahexane carboxylate (DMOHC). Furthermore, while LiFSI-based LFP/Gr cells exhibit enhanced performance in certain metrics, they suffer the production of gas at 70°C, which can be mitigated by incorporating LiPF6 salt.

Want to take part in this webinar?

Saad Azam headshot

Saad Azam is a battery scientist whose research focuses on improving the lifetime, safety and performance of lithium-ion batteries for electric vehicles and grid energy storage. He completed his PhD at Dalhousie University in the Jeff Dahn research group, where his work centered on electrolyte additives, high-temperature degradation, transition-metal dissolution, gas evolution and long-term cycling of LFP/graphite and NMC/graphite pouch cells. His research combines electrochemical testing with advanced post-mortem methods, including qNMR, GC-MS, EIS, and micro-X-ray fluorescence, to connect cell performance with chemical degradation mechanisms. His recent work in the Journal of The Electrochemical Society examines how higher concentrations of vinylene carbonate improve the lifetime of LFP/graphite pouch cells cycled at 70°C.

Copyright © 2026 by IOP Publishing Ltd and individual contributors