Giant leaps for knowledge

The world has changed since 1969. Home computers did not exist, colour televisions were up-and-coming, and telephones only came attached to a wall. Indeed, it is often said that a single modern smartphone contains more processing power than the computers that sent Neil Armstrong, Michael Collins and Buzz Aldrin to the Moon in July 1969. Yet, despite 50 years of advancing technology here on Earth, the scientific legacy of NASA’s Apollo missions is far from over.

Take the three laser ranging retroreflectors that were put on the Moon by astronauts from Apollo 11, Apollo 14 (January–February 1971) and Apollo 15 (July–August 1971). Despite being on the Moon for almost half a century, the devices are still in operation. Comprising an array of corner-cube reflectors, each device is around the size of a small suitcase – the Apollo 15 array being the largest with 65 × 105 cm of reflectors. Using Earth’s telescopes, scientists can aim a laser beam at the arrays and detect the reflected photons to gain accurate measurements of the distance between the Earth and the Moon (see “How high the Moon”).

This experiment has contributed to our understanding of the Moon’s orbit, the variation in its rotation related to distribution of mass, the Earth’s rotation rate and the Earth’s precession of its spin axis. It’s even been used to test Einstein’s general theory of relativity. It’s also revealed the rate the Moon is receding from the Earth (3.8 cm per year and counting) – a rate that contributes to theories about the Moon’s origin since you can extrapolate in the other direction.

“The Moon has moved since we put the laser reflectors on it and it’s consistent,” says NASA’s chief scientist Jim Green, a physicist who has worked at the agency for the last 40 years. “If it’s constantly moving away, it must have been closer [in the past]. And so we’ve now done the analysis to determine the Moon was created very close to the Earth and from an impact. That helps support one of our theories about the Moon and how it was created.”

An origin story

This lunar-creation theory – the giant impact hypothesis – involves another planet called Theia, which is thought to have been a similar size to Mars and travelled in the same orbit as an early Earth. Gravity attracted Theia and Earth together, producing an enormous collision that created the Earth as we know it and our Moon.

There is also a rival theory, which says that the Moon formed from debris orbiting the Earth. But whatever exactly happened, one thing is clear. “When [things] settled out, the Moon was just above a place we call the Roche limit,” says Green, referring to the minimum distance at which a satellite, such as the Moon, can exist while orbiting a larger body. “It formed outside an area that’s three Earth radii away. Right now, the Moon is 60 Earth radii away,” Green continues. “So that means if you were standing on the Earth at that time, which I wouldn’t recommend because it was just a mess, the Moon would have been 16 times larger in the sky than it is today.”

Given the closeness of the Moon, it follows that at that time, one Earth day was a mere five hours long. Green uses the classic analogy of a spinning ballet dancer who spins faster when her arms are closer to her body. “As the Moon moved away, the Earth had to slow down – just like the ballet dancer slows down when she moves her arms away from her – to conserve angular momentum,” he says.

“We had the basic concepts for theories about how the Earth and the Moon are put together,” Green explains, “but now we’re putting the next big steps on it.” In other words, this one experiment, placed on the lunar surface half a century ago, has not only given us continual measurements relating to the physics of the Earth and the Moon, but also continues to influence and inform scientific ideas.

Short but extraordinary

The Apollo 11 mission was a relatively short affair. After Armstrong’s famous first step onto the Moon’s surface, he and Aldrin ventured no more than 60 m from the lunar module and travelled just 1 km in total. Within three hours they were safely back inside the Eagle. The mission was after all a proof of concept and, apart from the political statement, its primary aim was to pilot a crewed landing on the Moon and return home safely.

Apollo 11 was a proof of concept and its primary aim was to pilot a crewed landing on the Moon and return home safely

The scientific experiments performed during Apollo 11 were therefore limited. Alongside the retroreflectors, Armstrong and Aldrin deployed a suite of experiments that each took only 10 minutes to set up and were designed to send data to Earth after the astronauts had left. The package included a Passive Seismic Experiment, which was sensitive enough to pick up the astronauts’ footsteps and even Armstrong tossing and turning in his hammock. It ran for three weeks after deployment, registering “moonquakes” and meteoric impacts, and consequently provided information about the Moon’s interior.
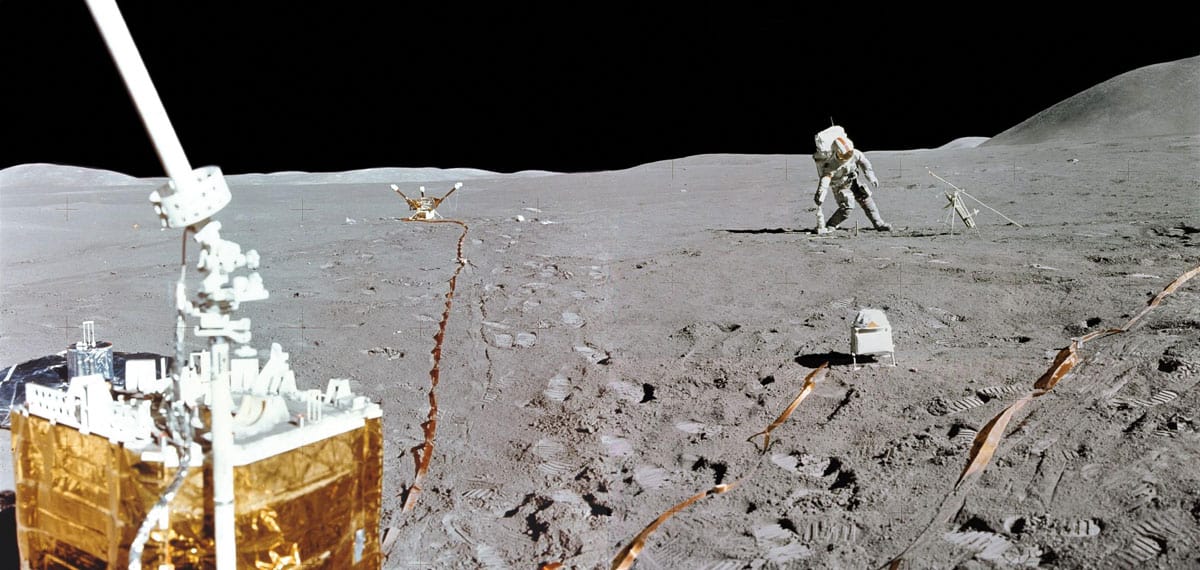
Alsep

The mission also had a detector that measured the accumulation of lunar dust and the radiation damage to the solar cells that were powering the experiment and communication devices. In addition, Armstrong and Aldrin collected samples of the solar wind using sheets of aluminium foil on a pole (switched to platinum foil on Apollo 16). Facing the Sun, the foils were exposed for different periods of time to check for variations in the make-up of the wind. They were then returned to Earth where scientists found isotopes of noble gases, which varied in quantity according to the wind intensity. The astronauts’ helmets also had cosmic-ray detectors that were analysed after they returned to Earth.

The mission was a huge achievement, but anyone hoping for evidence of life was disappointed. After returning to Earth, the astronauts, spacecraft and samples underwent a 21-day quarantine while the Lunar Receiving Laboratory sterilized the containers of samples and analysed sections of lunar rock using spectrometers and microscopes for gases, chemical and physical properties as well as testing for radioactivity and biological life. The lab reported that: “No micro-organisms of extraterrestrial origin were recovered from either the crew or the spacecraft.”

Upscaling the science

Science on the first crewed landing may have been a secondary objective, but in November 1969 it took centre stage with Apollo 12. The primary objectives this time included inspecting, surveying and sampling the Moon, and deploying the first full Apollo Lunar Surface Experiments Package (ALSEP). Excluding investigations that took place from lunar orbit and on the journeys to and from the Moon, the six Apollo missions that landed on the lunar surface performed a total of 53 experiments. However, the number and type of experiments varied from mission to mission.

For instance, Apollos 12, 14 and 15 had a Suprathermal Ion Detector Experiment to measure the flux, mass and relative energy of positive ions with energies less than 50 eV. The sources of these ions included the solar wind and atmospheric gases that were ionized by ultraviolet radiation. Increased levels were also recorded shortly after the Passive Seismic Experiments (deployed by missions 11, 12, 14, 15 and 16) registered meteoroid impacts. Higher-energy particles were studied using Apollo 14’s Charged Particle Lunar Environment Experiment, and the particle-track cosmic-ray detectors of Apollo 16 (April 1972) and Apollo 17 (December 1972).

Apollos 12, 14 and 15 also performed a Cold Cathode Ion Gauge Experiment to measure the pressure of the Moon’s tenuous atmosphere. While Apollo 12’s experiment lasted just a few weeks, those for 14 and 15 continued returning data to Earth from 1971 to 1975. Apollo 17 went on to measure the constituents of the atmosphere with the Lunar Atmospheric Composition Experiment, revealing that the primary gases present are neon, helium and hydrogen. When analysed in conjunction with seismic measurements, researchers found that levels of argon-40 increased during periods of high seismic activity. It is thought that the gas is produced by the decay of radioactive potassium-40 beneath the surface and is released when moonquakes create fractures.

Apollos 12, 15 and 16 included a lunar surface magnetometer, which measured the Moon’s magnetic field and contributions from external sources, namely the Earth and Sun. By measuring over several months, the fluctuating external fields could be excluded, revealing that the Moon’s own magnetic field varies over time in certain regions. Using the magnetometer observations as the Moon passes in and out of Earth’s magnetic field, it is also possible to estimate how the Moon’s electrical conductivity varies with depth via a technique called electromagnetic sounding.

The variety of science experiments deployed by the Apollo astronauts has provided clues about the lunar interior – and the data are still revealing the Moon’s secrets decades later. Take the lunar core, for example. While the Apollo magnetometer measurements did not require the Moon to have an iron-rich core, the results limited its radius to a maximum of 450 km – a figure supported by the seismic data. Meanwhile, the variations in the Moon’s rotation, observed by the laser ranging retroreflectors, constrained it further, implying that the radius is less than 350 km. But it wasn’t until 2011, when researchers re-analysed data from the Passive Seismic Experiments, that a more detailed picture of the core was achieved (Science 331 309). Using seismic array-processing to enhance faint signals in the Apollo data, the scientists were able to deduce that the lunar core is iron-rich, and consists of a solid inner ball of about 240 km in radius and a 90 km-thick fluid shell. The re-analysis also suggests that the core contains a small percentage of light elements such as sulphur, which is similar to Earth’s core.

Moon dust and spacesuits

Not all of the Apollo missions’ science objectives went as planned. On Apollo 11, Armstrong and Aldrin collected 21.5 kg of soil and rocks but did not take a lunar environmental sample or a gas analysis sample. Nor did they complete all the planned sample documentation due to the mission’s time constraints.

All the Apollo astronauts were plagued by very fine Moon dust, which coats the lunar surface and is particularly “sticky” because solar radiation strips away electrons, making it static. The dust clogged up, wore down and interfered with spacesuits and experiments alike. Apollo 11’s Passive Seismic Experiment, for example, overheated and failed because of Moon dust, while Apollo 17 astronaut Harrison Schmitt not only reported it wearing through three layers of Kevlar-like material on his boot, but also complained of “lunar dust hay fever”.

The bulky spacesuits themselves also caused problems. Apollo 16 commander John Young tripped over a cable and broke the heat-flow experiment, reminding NASA that all spacecraft hardware needed to be more durable when its operators had limited mobility and were wearing spacesuits and helmets.

Despite Young’s accident, the rest of Apollo 16 was a success. Its scientific findings included the discovery of two new auroral belts around Earth and the first photograph of the geocorona in the hydrogen wavelength. The mysterious geocorona – part of the Earth’s outer atmosphere – is a gaseous cloud of hydrogen atoms that are luminous in far-ultraviolet light. The images confirmed that the hydrogen geocorona could be detected above the interplanetary Lyman alpha background – radiation emitted by distant galaxies from neutral hydrogen. Intriguingly, it was discovered in 2019 that this atmosphere extends beyond the Moon (J. Geophys. Res. Space Phys. 10.1029/2018JA026136), which means that the astronauts were actually within the geocorona too.

Members of the Apollo 16 crew also measured the composition of the lunar surface while they were in orbit, using X-ray fluorescence spectrometers (to look at magnesium, aluminium and silicon) and gamma-ray spectrometers (to identify thorium, iron and titanium). An alpha-particle spectrometer detected radioactive radon emission from the Moon and identified regions, such as the Aristarchus Crater, with higher activity, indicating areas where there is more uranium in the Moon’s crust.

Bigger steps

As the Apollo missions progressed, the time the astronauts spent on the surface during extravehicular activities (EVAs) – excursions out of the lunar module – increased and so did the science. From Apollo 15 they even took a battery-powered buggy – the Lunar Roving Vehicle – that let them explore further. By Apollo 17, NASA moonwalkers spent a record 22 hours performing EVAs, travelling a cumulative distance of about 35.9 km, performing 10 science experiments and collecting an impressive 741 rock and soil samples, including some from as deep as 3 m below the surface.

As the Apollo missions progressed, the time the astronauts spent on the surface increased and so did the science

In total, the Apollo astronauts brought back 382 kg of lunar rocks and soil. These pieces of lunar regolith ranged from volcanic basalt and ancient rocks from the Lunar Highlands, to breccia – sedimentary rocks containing fragments of other rocks or minerals – formed from the impacts that produced the distinctive craters visible from Earth. Soil samples from both Apollo 11 and 12 were even used on Earth to grow plants or exposed to seeds. Tests were done on 35 species and the conclusion was that lunar material was not harmful to plants.
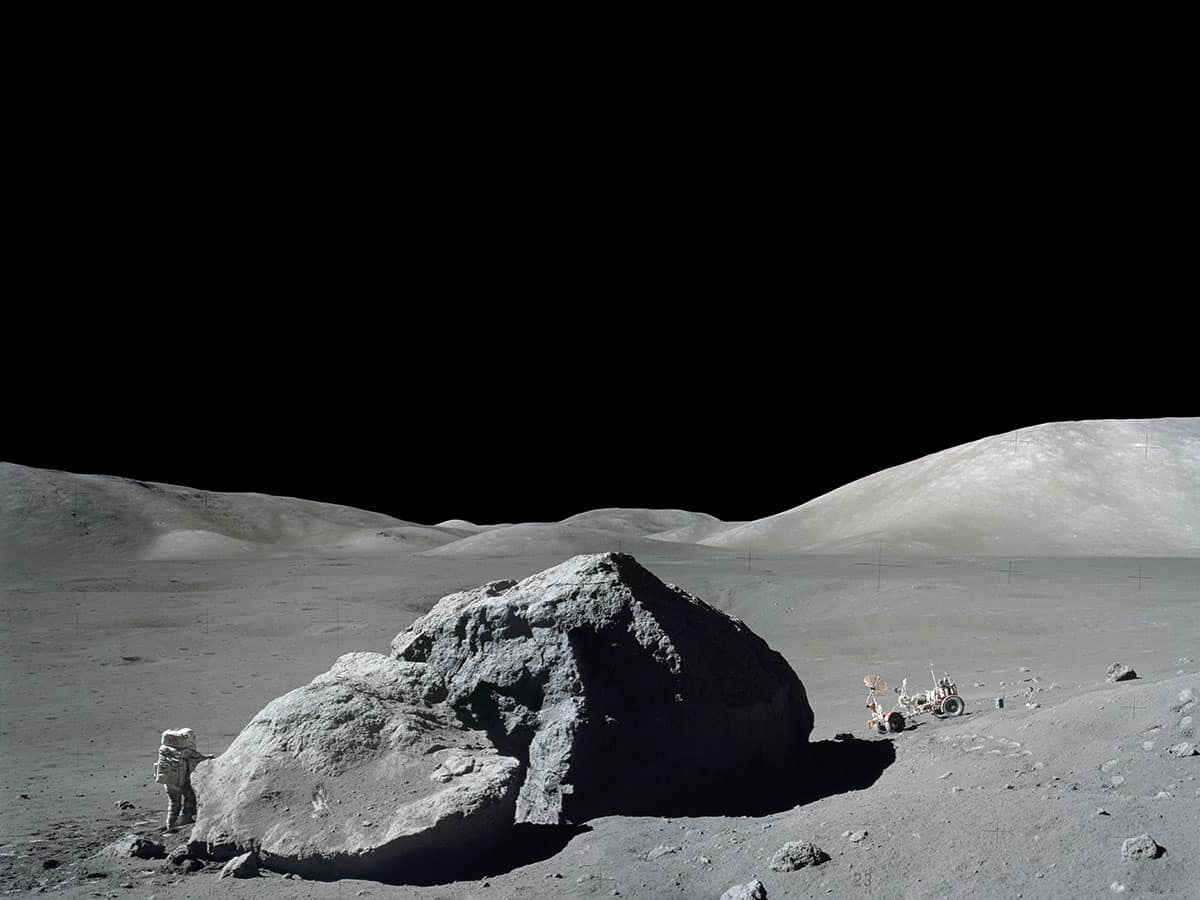
Harrison Schmitt EVA

Apollo 12’s cache included the Bench Crater meteorite – the first meteorite to be found on another world. But the largest sample of them all was from Apollo 14. “It was roughly the size of a water melon,” says Katherine Joy, a lunar geologist at the University of Manchester in the UK. She studies samples from the Apollo missions, supplied by NASA, and was part of a team that analysed the Bench Crater meteorite in 2013.

“From the Apollo samples we’ve learnt how the Moon’s crust formed,” Joy says. “The white areas of the Moon probably formed in a magma ocean. The early Moon was very hot and then it formed a crystalline crust out of that magma ocean – and that’s useful as it tells us how other planets have generated a crust.”

Considering images from the Moon show astronauts on a monotonously grey surface, it is the colours beneath the dust that Joy finds surprising while working with Apollo samples. “Some of the rocks are beautiful and crystalline,” she explains. “Some are brilliant white, some are brown, some are green. Some have large crystals that you can see with your eyes.”

A grey Moon full of colours

Despite all the science experiments, the only astronaut on the Apollo programme to have trained as a scientist is Harrison Schmitt, who got a PhD in geology at Harvard University in 1964. As part of the Apollo 17 mission, he and fellow crew member Gene Cernan were the last human beings to walk on the Moon. During the mission, Schmitt got extremely excited when he spotted some soil that was not grey, famously shouting: “It’s orange. It’s orange!” The orange colour was due to volcanic glass formed within the soil, though it can take on other hues too. “Some of the lunar soil is black, some is grey,” Joy explains. “There’s this beautiful bottled green soil from Apollo 15 that’s also volcanic glass. Ancient volcanoes covered the lunar surface with their pyroclastic products.”
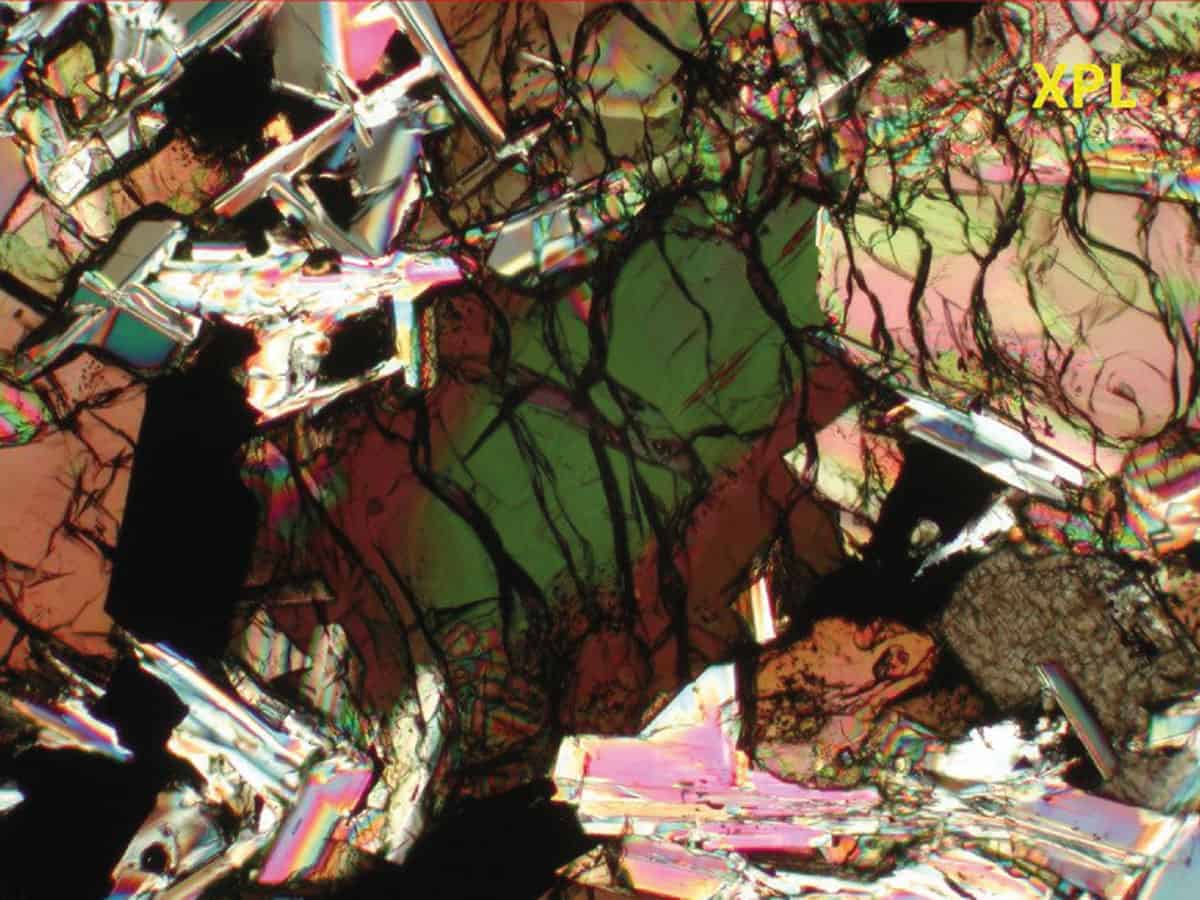
Lunar sample

Once the lunar samples were back on Earth, NASA allowed teams of scientists around the world to study them, which led them to deduce that the Moon once had active volcanoes on its near side during a period 3–3.8 billion years ago. “The black stuff is basalt like you get in Hawaii or Iceland,” Joy continues. “The white areas are made up of anorthosite, which is similar to granite. It’s a rock that’s dominated by a mineral called feldspar and the significance of that rock is that most of the Moon is made of it and it was formed in that earliest phase of the magma ocean. Then everything got bashed by impact so it’s all a big mix.”

Watery Moon

The lunar samples, when first analysed, registered small concentrations of volatiles – elements and compounds with low boiling points that vaporize easily. This includes nitrogen, hydrogen, carbon dioxide, methane and water, so it was assumed that the Moon was dry.

However, in 2010 this assumption came into question when a team led by Jeremy Boyce, at Caltech in the US, studied grains of the calcium phosphate mineral, apatite, within lunar sample 14053 – a chunk of basalt collected by Apollo 14 (Nature 466 466). Using an ion microprobe, the team discovered hydrogen in the form of structurally bound hydroxyl groups (OH) – implying that water could be present beneath the lunar surface. Indeed, in terms of the hydrogen, sulphur and chlorine content, the Apollo 14 apatite was indistinguishable from volcanic rock found on Earth, suggesting they were made through similar processes. Although this doesn’t mean the Moon is rich in water like Earth, it demonstrates that lunar geological processes can make at least one hydrous mineral.

The hypothesis that the Moon might not be as dry as we originally thought was confirmed in perhaps one of the greatest recent discoveries about our neighbour. In 2018 Shuai Li at the University of Hawaii and colleagues found direct evidence of water ice in regions of permanently shadowed craters at the lunar poles (PNAS 115 8907). The finding was accomplished through optical methods and has implications for any future human presence or base on the Moon – especially for producing energy with hydrogen fuel cells using in situ resources.

Those trips to the Moon will depend a lot on the information and experience gained by the Apollo programme. And, as we develop and improve our analysis techniques, the Apollo samples and data could reveal more secrets. We may this year be celebrating the 50th anniversary of that famous “giant leap for mankind”, but the legacy of the Apollo missions is living on.

Astronaut hindsight

Harrison Schmitt

In April 2019 I attended a symposium at the US National Academy of Sciences in Washington to celebrate the 50th anniversary of the Universities Space Research Association, which had been set up in 1969 for scientists to study the lunar rock and soil brought back by the Apollo missions. One of the speakers was a former senator from New Mexico: Apollo 17 astronaut and trained geologist Harrison Schmitt. He showed a recent image of the Moon taken of his craft’s landing site by NASA’s Lunar Reconnaissance Orbiter – a mission that has been continuously mapping the Moon for the last 10 years. It revealed the dark grey dune tracks left by the lunar rover wheels while travelling for samples, which are still visible due to the lack of wind or atmosphere on the Moon.

Apollo 17’s Active Seismic Experiment deployed at the site showed that the regolith under Schmitt’s space boots was about 10–12 m deep. “Quite a bit deeper than elsewhere,” he pointed out.

When talking about deploying the scientific suite of instruments that made up his mission’s Apollo Lunar Surface Experiments Package (ALSEP), Schmitt was surprisingly harsh on himself. “Why didn’t I deploy the ALSEP right here,” he said, pointing to a region near the lunar lander that was obviously more exciting to a geologist like himself, “instead of walking 50 to 80 metres and putting it in a not-quite-so-good spot? And I can’t tell you.” Waiting for the laughter to die down, Schmitt, then 83, added: “Things look very different when you’re down in the craters.”

During that final mission, in late 1972, Schmitt and his fellow astronaut Gene Cernan also collected a sample core from the Taurus-Littrow Valley. It was sealed and has been left untouched since then. Earlier this year, it was announced that geologist Chip Shearer, from the University of New Mexico, will soon be unsealing the core to study it using the latest available techniques. The result is likely to further our scientific understanding of the Moon.
Did post-Haiyan disaster relief boost fishing pressure?

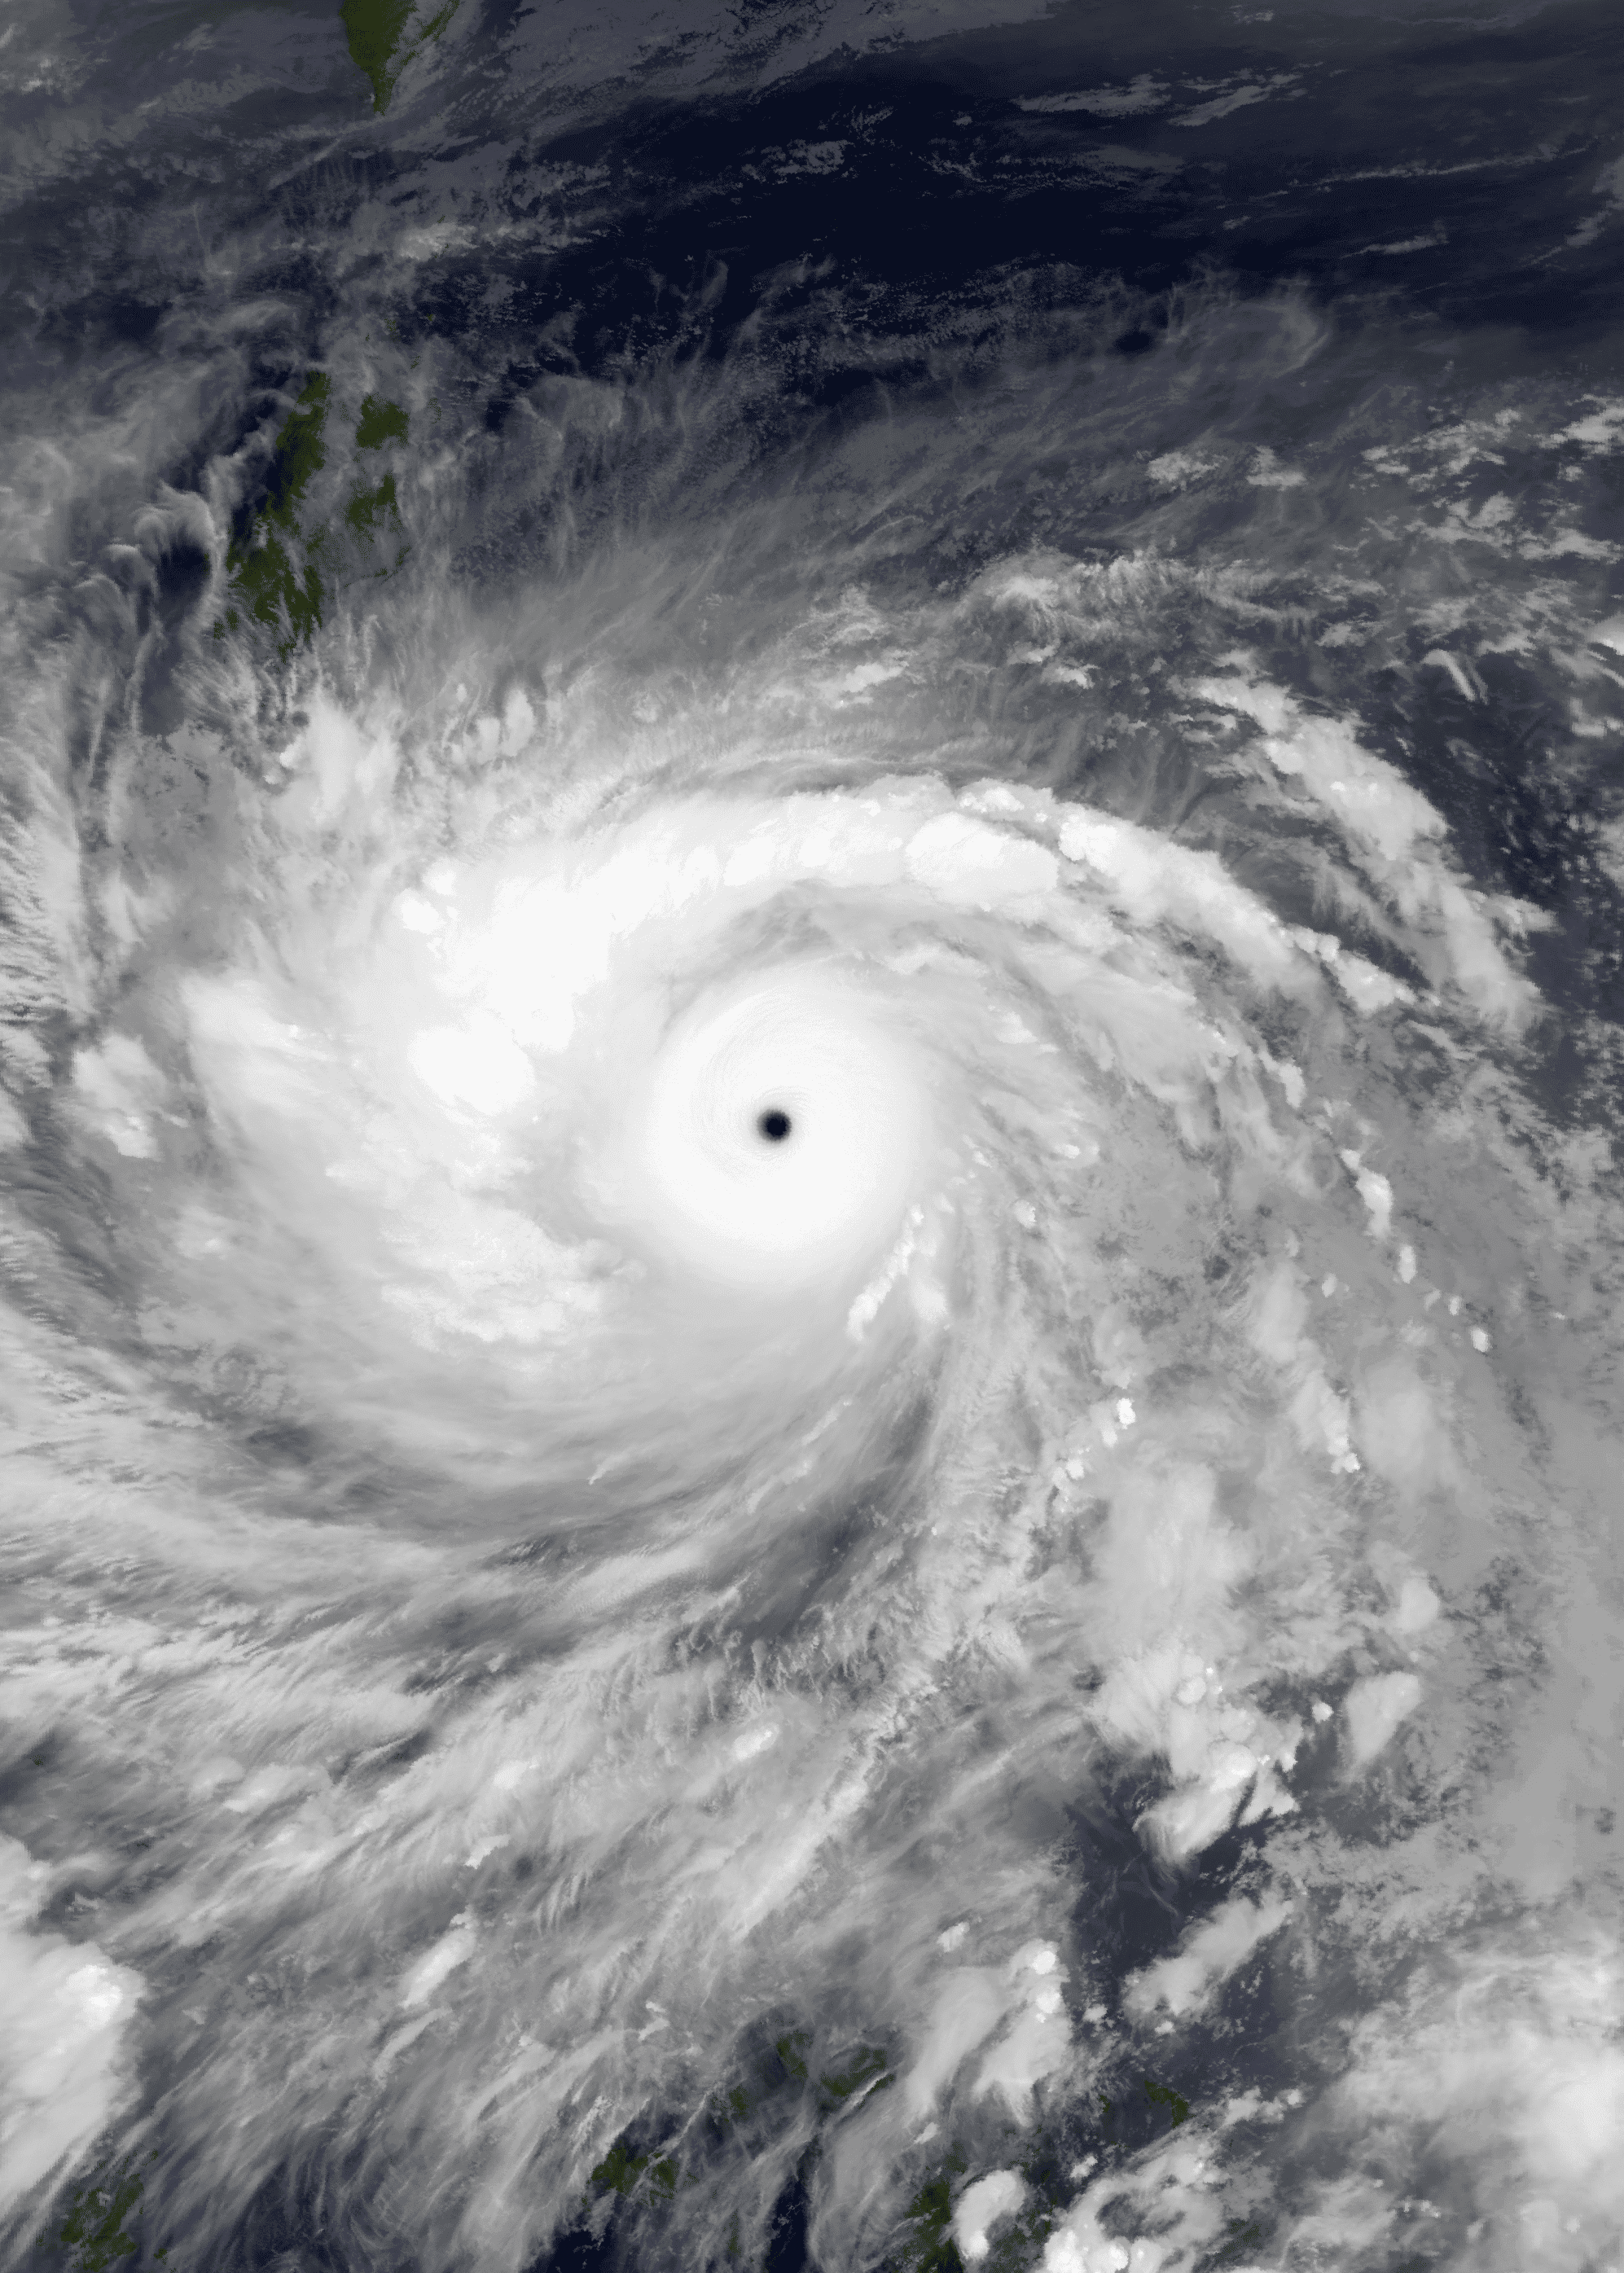
Satellite image of typhoon Yolanda

In November 2013 super typhoon Yolanda devastated much of Southeast Asia and killed over 6300 people. Known internationally as Haiyan, the tropical cyclone was one of the most powerful ever recorded.

Diego Boleche, a fisher and seaweed farmer from the village of Cagaut in the Philippines, and his family were lucky to survive; Yolanda destroyed their fishing boat and nets. Eventually Boleche managed to make himself another boat. However, the combination of typhoon-damaged reefs and competition from fellow fishers meant that he struggled to catch enough fish to feed his family, let alone pay the bills.

The fishing industry was particularly hard-hit by the super typhoon and Boleche’s story is a familiar one. After Yolanda many fishing families had to borrow money or rely on grants to rebuild their livelihoods. In many cases fishers found themselves in a precarious situation: lacking savings to tide them through the disaster, not having sufficient credit-rating to take out a bank loan and without access to any kind of income support. Instead they were forced to rely on informal loans from their patrons, handouts from aid agencies, and borrowing from loan-sharks.

This somewhat haphazard way of re-financing the fishing industry after Yolanda has had knock-on effects. Although patron-client relationships may help people recover from the immediate aftermath of a natural disaster, a new study indicates that they may also erode long-term sustainability, particularly if climate change makes disasters like Yolanda more frequent.

Liz Drury O’Neill from Stockholm Resilience Centre in Sweden and colleagues gathered data from Philippine fisherfolk, fish traders, NGO representatives and municipal- and provincial-level government officials in September 2015, approximately two years after the super typhoon, and October 2017. They asked about the impact of Yolanda on people and their livelihoods, what measures they had to take to respond to the disaster, and what changes they had seen over time.

The research uncovered an inequity in disaster relief for coastal fishing communities. Many fishers reported how those with political connections to local government received donated boats more quickly. Due to previous overfishing problems, donors were urged to give only small boats to avoid the fishing pressure of larger boats on dwindling stocks. But this well-meaning directive appears to have backfired, resulting in a far greater number of boats in total.

“There are a lot more boats after Yolanda,” explained one fisher. “Before, every Thursday market day there was lots of space to land at the port, now you have to tie up ten boats back and then climb across them all.”

In addition, this homogenization of the fishing fleet has constrained the choice of fishing grounds because small vessels are less able to cross open channels or move away from local reefs.

Fish traders, meanwhile, found themselves pressurised into acting quickly to secure their supply of fish. “If they didn’t get cash for the clients quick enough then the fishers transferred to other patrons,” says Drury O’Neill. “The traders turned to informal finance options if they didn’t have the cash flow themselves, which were mainly their own patrons in the bigger cities like Manila or Iloilo and then the loan sharks around Concepcion and Estancia.”

Writing in Environmental Research Letters (ERL), Drury O’Neill and her colleagues conclude that whilst the donations, patronage and aid helped to mitigate short-term vulnerabilities, they also compounded previous problems, including already declining fisheries, weak governance and lack of financing options, and potentially undermined the long-term sustainability of the fishery resource. With climate change likely to bring more extreme weather events, this kind of scenario could become more common. The authors suggest that the patron-client relationship must be taken into account when implementing disaster relief packages.

“Governments and NGOs can minimise the dependence on patronage and economic vulnerability of fishers by better engaging with managers and representatives closer to the ground,” says Drury O’Neill. She also points out how natural disasters can deepen the indebtedness loop associated with patronage, and that perhaps this can be broken by supporting finance schemes that offer people new options.

In Diego Boleche’s case that is exactly what happened. He was given technical training and a cash grant from international NGO WorldFish, enabling him to diversify and start a sustainable milkfish farm. Today he and his family are better off than before and the fish farm gives them security and independence.

  • Diego Boleche was not directly involved in Drury O’Neill’s research but his story illustrates the issues explored.

Artificial muscles go with the twist

Artificial muscles could be employed in a host of applications, including miniaturized medical devices, robotics and smart textiles that respond to changes in their environment. Most such muscles created to date, however, are heavy and cumbersome while being relatively slow to actuate. Three research groups are now reporting on new fibre-based designs for artificial muscles that are lightweight and fast.

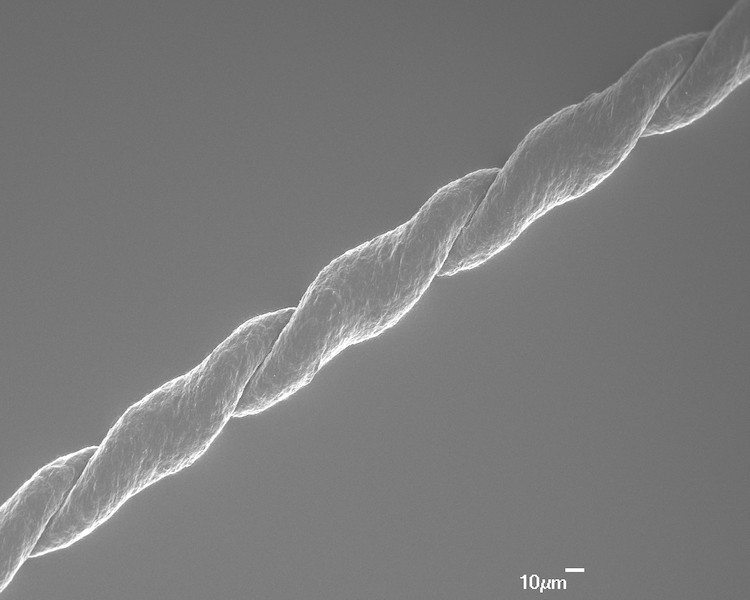
A team led by Polina Anikeeva of the Massachusetts Institute of Technology has used a drawing technique to create a two-faced polymer fibre that can be activated by heat and which can lift more than 650 times its own weight while withstanding strains of more than 1000% over thousands of use cycles. Bundles of the individual fibres can lift even heavier loads – just like their biological counterparts.

The researchers say they can produce the artificial muscle in large quantities – on the scale of hundreds of metres – with lateral dimensions ranging from microns to millimetres. This means that the technology could be used in applications ranging from the microscale (for example, in medical microrobots for surgery) to the macroscale (for example, lightweight prosthetic limbs).

Bilayer sandwich

The researchers made their fibres by first fabricating a preform, which is a macroscale model of a fibre that is then heated and stretched so that its length extends to hundreds of metres and cross-sectional features reduce by 10 to 10,000 times. They used a bilayer sandwich of two materials – cyclic olefin copolymer elastomer (COCE), which is a stretchable elastomer with a low thermal expansion coefficient, and polyethylene (PE), which is another standard, non-stretchable polymer with a higher thermal expansion coefficient.

“Once we have drawn our fibres, we can stretch them by up to 1000%,” explains Anikeeva. “During this process, the elastomer stretches but the other polymer plastically deforms permanently. Once we release the tension, the elastomer then attempts to contract, but the other polymer cannot – which results in the fibre curling into a spring. This is our fibre-based muscle.”

When the researchers apply heat to the material, the polyethylene tries to expand even further, but the low-thermal expansion elastomer does not expand as much. This produces a further tightening of the spring, which is the mechanism underlying actuation.

Lightweight and fast

Since they are made from polymers, the new artificial muscles are lightweight. They can also operate at modest temperature changes with a response time that is as short as tens of milliseconds, allowing for high-speed operation.

Anikeeva and colleagues also coated their fibre-based muscles with meshes of conductive metal nanowires, which when stretched or compressed change their resistance. They can thus be used for strain feedback, which means that they can measure the exact force, degree of deformation or the actuation temperature they experience.

The devices still require an externally applied heat stimulus for actuation though, which is obviously not ideal for engineering applications. “We are thus looking to integrate internal heating elements into our artificial muscles,” Anikeeva tells Physics World. “And since fibre-based fabrication is applicable to many materials with diverse properties, we could embed additional functionalities – such as optical features – into our devices.”

The possibilities for this type of artificial muscle are virtually limitless, says study lead author Mehmet Kanik, because any combination of two materials with different thermal expansion coefficients could work.

Sheath drives muscles

A second team, led by Ray Baughman of the University of Texas at Dallas, has designed another type of fibre made from polymer yarns that can generate 40 times more mechanical energy per second than can human muscle and nine times more than can the highest power alternative electrochemical muscles made to date.

CNT yarn and SRAM

Baughman and colleagues built on their previous work on guest-filled carbon nanotube (CNT) yarn muscles and polymer-fibre muscles, which, while showing remarkable performance, did suffer from a few problems. For one, the central region of the muscle contributed little to muscle contraction even though energy was applied to the entire structure.

“We have now overcome this drawback by driving the muscle using a sheath – which can be an inexpensive coiled yarn or fibre core,” explains Baughman. “The sheath on our new electrochemical muscle generates 1.98 kW/kg of average power during muscle contraction. When thermally driven, we can obtain a full-cycle average contractile power output of 9.0 kW/kg and 12 muscle contractions per second for a muscle with a polymer sheath and a coiled CNT yarn core. To compare, human muscle has a contractile power of just 50 W/kg.”

The researchers employed several different polymers as the sheath materials. For example PEO-SO3 which is a blend of poly(ethylene oxide) and a copolymer of tetrafluoroethylene and sulphonyl fluoride vinyl ether, responds to ethanol vapour. Polyurethane responds to heat, and carbon nanotube (CNT) sheaths swell in response to electrochemical charges.

Inner core provides stiffness

The inner core of the structure provides muscle strength and stiffness and directs the twisting motion of the fibre. “In the simplest structure, which can be used in smart textiles, we make our sheath-run artificial muscles (SRAMs) using a commercially available low-cost twisted yarn (nylon, for example) as the core and a commercially available polymer as the sheath,” Baughman tells Physics World. “We dissolve the sheath polymer in a solvent that will not infiltrate into the core, coat it on the core polymer to the appropriate thickness (the size of which is important for performance). We then add sufficient twist to introduce coiling into the sheath-coated yarn while the sheath polymer is in a deformable state.”

Making the electrochemical sheath-run muscle is slightly more complicated, he says. Here, the researchers twist a cylindrically configured carbon nanotube sheet stack around a core fibre (which is a nylon yarn in the present work) until the yarn fully coils.

Host of applications

These SRAMs could find use in a host of applications. These include microscale actuators that intelligently control flow in fluidic circuits and macroscale arrays of actuators for humanoid robots and exoskeletons. Sheath-run muscles that harvest chemical or thermal energy as mechanical energy, which is then converted to electrical energy, is also an interesting possibility for powering remotely-communicating sensors, for example, and harvesting electrical energy from industrial waste streams.

“They might also be used in textiles that respond to temperature and moisture (like sweat) by changing their porosity,” adds Baughman. “We are also investigating this ability to respond intelligently to the environment for smart drug delivery systems that would detect the presence of antigens, for example, and react by contracting to release the appropriate drug.” The researchers say they have already obtained promising early stage results for such devices.

Untethered high-energy micro-engine

A third research team, led by Jinkai Yuan and Philippe Poulin at the University of Bordeaux in France has made an untethered high-energy micro-engine composed of shape memory nanocomposite fibres. These fibres are twisted to store mechanical energy that can then be released on demand by applying a small temperature change.

Twisted PVA fibre

“Untethered control is a big challenge for today’s robotics, particularly for implants and undersea vehicles,” says Yuan. “Our concept provides a new route toward untethered actuation, control and propulsion in robotics.”

The researchers made their twisted shape memory nanocomposite fibres from the shape-memory polymer polyvinyl alcohol (PVA) as a matrix filled with dispersed graphene oxide platelets. The graphene oxide nanosheets play an important role in improving the torsional properties of the fibre thanks to their unique rigid 2D structure. This allows the fibre to store more mechanical energy within the fibre before it fractures.

Untwisting releases mechanical energy

The PVA can be programmed to adopt a certain shape – such as a highly twisted conformation as in this case – at high temperature. It is then thermally quenched to fix the twisted shape. In this work, the researchers introduced twist into the fibre at thousands of turns per metre of fibre length, with a rotation speed of several tens of revolutions per minute (rpm). When heated to just above the programming temperature, the mechanical energy stored by the twisted fibre is quickly released as it recovers its straight shape by untwisting.

The coiled structure can retain its shape without being tethered because of the glassy non-equilibrium conformation of the helically-configured polymer chains, Yuan tells Physics World.

“The other good thing about the twisted shape memory nanocomposite fibres is that they have a distinctive temperature memory feature that allows us to tune the operation temperature over a large range and release the stored energy in a stepwise fashion,” he adds. “This means that they show a maximum recovery torque and rotation speed at a well-defined temperature – that at which they were previously deformed.”

Record work density

The shape-memory nanocomposite fibres are able to deliver a record work density of around 2.8 kJ/kg and can operate for at least 10 cycles before failing. They could also potentially be coupled to elastic yarn-like cores to provide a torque that allows them to repeatedly actuate like an artificial muscle.

“Our devices based on shape-memory fibres can fit in small spaces and reliably rotate with high speed,” says Yuan. “This means they could be used in micro-robotics, laboratories-on-a-chip, smart textiles and miniaturized medical devices, to name but a few examples.”

The Bordeaux team says that it is now trying to introduce reverse actuation into its fibres.

All three groups report their work in Science. Full details of Anikeeva’s team research is here, Baughman and colleagues’ here and Yuan and Poulin’s here.

Ruptured oxygen-infused microbubbles combat tumour hypoxia

When ruptured by ultrasound, oxygen-filled microbubbles increase the partial pressure of oxygen in malignant tumours, helping to reduce hypoxia. The technique could enhance tumour response to radiotherapy by reducing the radioresistance of hypoxic cancer cells.

Researchers at Thomas Jefferson University have demonstrated that ultrasound-induced microbubble rupture, followed immediately by radiotherapy, significantly impeded the growth of breast cancer brain metastases in mice and extended survival compared with radiotherapy alone. This pilot study establishes the feasibility of further development of the technique for potential clinical use (J. Ultrasound Med. 10.1002/jum.15031).

Led by John Eisenbrey, the research team analysed the outcomes of 15 nude mice assigned to one of five treatment groups. All mice had received injections of brain-seeking breast cancer cells into the right hemispheres of their brains and developed tumours.

A control group received no treatment whatsoever. A second group received 10 Gy of low-linear energy transfer radiation to their tumours, under cone-beam CT guidance. Three groups received microbubble injections before irradiation at 10 Gy: two were injected with oxygen-carrying microbubbles, one of which underwent ultrasound-triggered microbubble rupture immediately before radiotherapy, while the final group was injected with nitrogen-carrying microbubbles, followed by ultrasound-triggered microbubble rupture.

Following treatment, the researchers performed 3D ultrasound on the mice twice weekly to record tumour response. They calculated tumour volume using 3D B-mode imaging and 3D mapping software. The group receiving ultrasound-ruptured oxygen-infused microbubbles before radiotherapy had the lowest tumour growth, with tumour volumes increasing by 41% of their original size seven days following treatment.

In comparison, tumours treated with oxygen-carrying microbubbles that were not ruptured before radiotherapy exhibited a mean increase of 383% (±226%) in volume. This growth was similar to that of the mice who only received radiotherapy, who showed a mean increase of 337% (±214%).

Interestingly, mice who received ultrasound-ruptured nitrogen-infused microbubbles prior to irradiation also fared better, with only an 80% increase in tumour volume. However, their survival outcomes were poorer than those with oxygen-infused ultrasound-ruptured microbubbles: 3.1 weeks compared with 4.0 weeks, respectively.

The control group survived a median of 2.9 weeks following injection of breast cancer cells. The groups that received radiation only and oxygen-infused microbubble injection followed by radiation had similar median survival outcomes, at 3.9 and 3.7 weeks respectively.

Lauren Delaney

While this pilot study demonstrates the potential positive impact of ultrasound-ruptured oxygen-infused microbubbles, the challenge of tissue oxygenation remains. Lead author Lauren Delaney tells Physics World that the team’s next challenges are to identify methods to deliver more oxygen to the tissues, so that cells can be better sensitized to radiation, and to increase the time during which the cells and tissues are oxygenated. This could enable patients to benefit from increased radiosensitivity during the time span of a radiotherapy treatment.

“One approach that we are considering is the inclusion of tumour mitochondrial respiration inhibitors in the microbubble shell, which will help sensitize the cells to radiation therapy while also interfering with aerobic respiration in the target cells,” says Delaney. “We hope this will prolong the effect of microbubble oxygen delivery long enough to be clinically viable.”

“We could also look into modifying the microbubble fabrication process to produce microbubbles with larger diameters of up to 8 μm,” she added. “And we could investigate augmenting radiotherapy applications where the radiation is already present, such as brachytherapy.” The team is currently investigating the feasibility of each of these approaches.

Delaney says that in future in vivo work, the researchers hope to use high-intensity focused ultrasound, both to visualize microbubbles within brain tissue and to ensure effective microbubble rupture for tissue oxygenation. Meanwhile, they are currently investigating use of an immunocompetent tumour model to overcome tissue hypoxia during radiotherapy. “Research using syngeneic tumour models can help better replicate the tumour microenvironments and immune responses in human patients,” she explains.

Looking ahead to clinical applications of this technique, Delaney emphasizes that the main issue to overcome is the duration of tissue oxygenation, so that patients can retain the benefit of increased radiation sensitivity in the interim time between receiving microbubbles, being scanned with ultrasound to rupture the microbubbles, and then receiving radiation therapy.

“We also need to scale up the production of the microbubbles with a more consistent and mechanized approach, so that we can produce sterile uniform populations of oxygen-loaded microbubbles,” she adds.

After this, preclinical trials could begin, followed by formal clinical trials with cancer patients.

Insect-inspired microscope takes videos of blood cells in motion

A microscope that can track the real-time motions of individual blood cells throughout the entire brains of living mice has been created by Qionghai Dai at Tsinghua University in China and colleagues.

Their real-time, ultra-large-scale, high-resolution (RUSH) system combines a large field of view, with high spatial and temporal resolution. The microscope could be used for medical and biological imaging, allowing researchers to observe the complex, ever-changing characteristics of active living systems. The ability to acquire such videos could prove to  be incredibly useful in medical imaging, since the complex dynamics of individual parts in biological systems are almost impossible to measure using conventional techniques.

A conventional optical microscope can either have a large magnification (high spatial resolution) or a large field of view (FOV) but not both. In 2016, a team of researchers UK unveiled a “mesolens” microscope, which offered both features. Their imaging platform stitches together images taken by 15 extremely precise optical elements. This minimizes the aberrations plaguing previous designs of confocal microscopes and allowed the system to image sub-cellular details across an entire mouse embryo.

Vast amounts of data

Now, Dai’s team have gone one step further with their RUSH system, which captures large FOV, high resolution videos of time-varying biological dynamics. In doing so they have overcome an important challenge:  at large FOVs and high resolutions, a video microscope will generate vast amounts of data that must be handled in an efficient way.

Dai and colleagues dealt with this data deluge by designing the RUSH objective lens to imitate the compound eyes of insects. This was done by arranging the microscope’s optical elements in a concave mosaic. When taking images, the sample plane was magnified onto the curved surface, before the images taken by each element were conveyed to an array of planar sensors, where they were stitched together to rebuild the original image. This setup reduced aberrations even further compared with previous platforms, allowing the researchers to take videos at centimetre-scale FOVs, micron resolution, and with a data throughput as high as 5.1 gigapixels per second.

With their setup, Dai’s team used fluorescent dyes to track the motions of individual white blood cells throughout the entire brains of active living mice, at speeds of up to 30 frames per second. They say that with further improvements, their updated RUSH platform could allow for the functional imaging of activity in intercellular networks, as well as the structural imaging of cellular dynamics in cultured cells, human brain tissues and awake, behaving animals. This would ultimately open up new opportunities for improved diagnoses and treatments, including high-speed screening for pathogens, as well as real-time imaging of tumour metastasis and neuron activity.

The new microscope is described in Nature Photonics.

Artificial intelligence smartens up cancer care

More people around the world are being diagnosed with cancer every year. Thankfully, researchers and clinicians continue to devise ever more effective and sophisticated techniques to combat the disease, resulting in better patient outcomes and improved survival rates for most forms of cancer. But both of these important trends have created a data challenge in the clinic: how to collect, process and analyse increasing amounts of data to extract the useful information that will deliver the most effective treatment plans and the best outcomes for patients.

Artificial intelligence is emerging as a vital tool to tackle this data deluge. Using computer algorithms to search for important signals in the noise can reduce treatment times, improve the quality of care, and make the best use of valuable resources. “We have demonstrated that AI can make work more efficient without compromising on quality of care, and in many cases it can improve the care that patients receive,” says Corey Zankowski, senior vice-president of Oncology Software Solutions at Varian, which is focusing on developing and delivering intelligent cancer care solutions. “This application of AI to healthcare will continue to expand to new workflows, reaching across all disciplines of oncology, including multidisciplinary care delivery and patient symptoms management.”

Zankowski is confident that AI can make a real difference in all types of clinical scenarios. AI can allow cancer-care teams to make faster and better informed decisions, speeding up the treatment process and making the experience less stressful for patients. It can increase the scope for more personalized treatment planning, and ensure that all patients benefit from best practices as well as the collective experience of oncology care teams. AI could also transform the ability of clinical teams to use and learn from their patients’ data, creating holistic views to enhance both the treatment and the outcomes.

Zankowski says that Varian has been working with customers in all parts of the world to understand their specific challenges, and has partnered with some of them to create the huge datasets needed to build effective AI software. “With AI algorithms tailored to the specific needs of clinicians and patients, we hope to spread best practices globally and improve treatments for all cancer patients.”

Artificial intelligence reaches the clinic

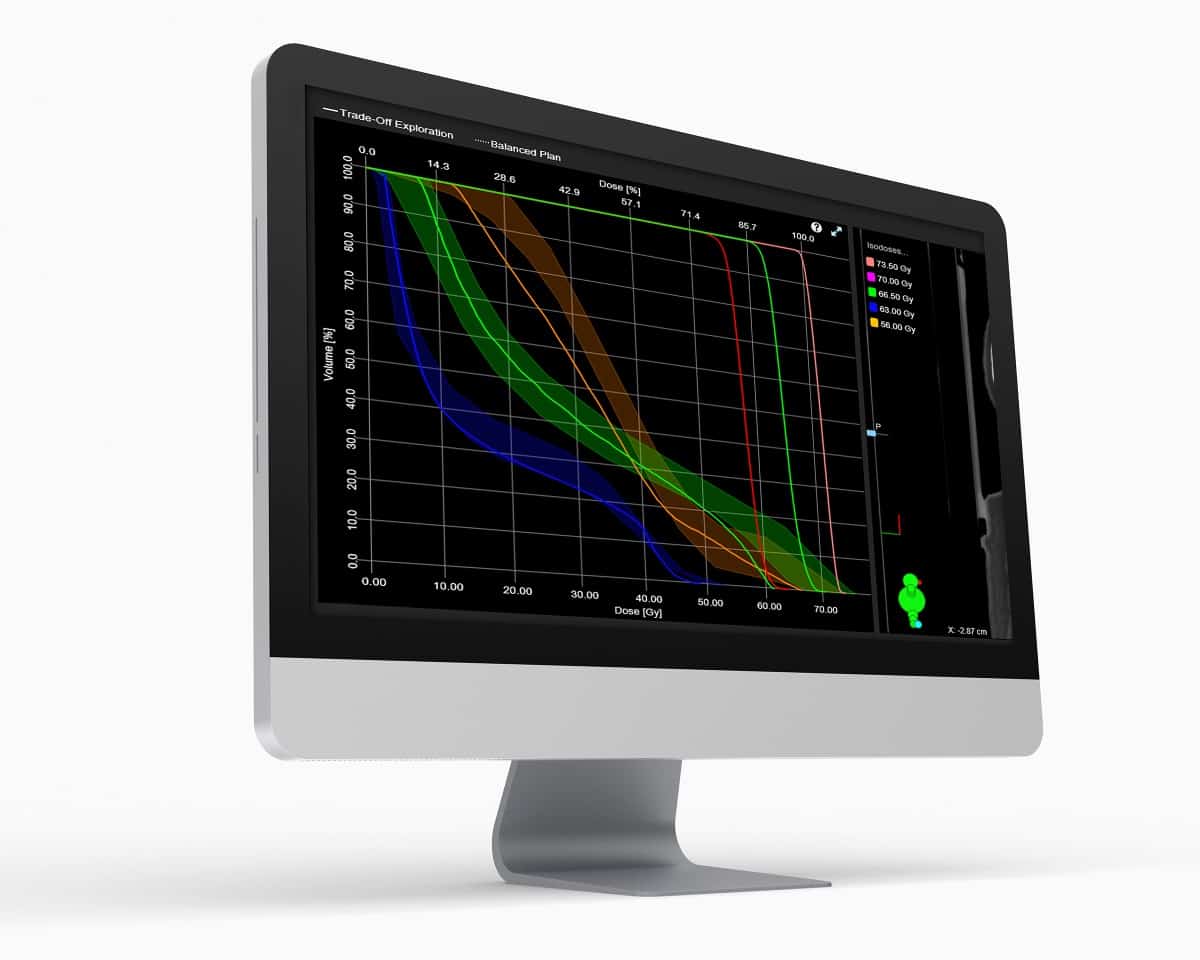
Zankowski explains that existing oncology software has already brought machine intelligence into the clinic. As an example, Varian introduced RapidPlan knowledge-based treatment planning in 2014, which speeds up treatment planning and aims to deliver more consistent results by using machine learning to create preconfigured treatment plans based on data obtained from previous clinical experience. This software uses dose and anatomy information from existing plans to predict a more optimal dose distribution for new patients, based on their contoured anatomy.

RapidPlan can predict dose distributions

“RapidPlan creates consistent, high-quality plans for personalized radiation therapy,” says Zankowski. “It moves beyond templates, leveraging clinical expertise to quickly build the right plan for virtually all types of radiation therapy.” To improve predictions for patients, Varian’s research and engineering teams are exploring distributed learning concepts in which algorithms are trained across several hospitals, but without the patient data leaving the hospital.

The capabilities of RapidPlan can be further enhanced by combining it with multi-criteria optimization (MCO), a tool available within Varian’s Eclipse treatment-planning software that allows clinicians to explore what happens when they alter different clinical criteria. This enables oncologists to better optimize each treatment plan based on the uniqueness of each patient and their condition, delivering high-quality results by combining human intelligence with the machine learning provided by RapidPlan.

“While RapidPlan helps us know what should be achievable for a patient based on previously planned patients, MCO can help us tailor that plan based on the individual patient’s unique clinical circumstances,” explains Suzanne Currie, a medical physicist and the lead clinical scientific lead at the Beatson West of Scotland Cancer Centre in Glasgow, UK. “Using these two tools we are able to sculpt the dose and optimize our plans in ways we were not able to before.”

Varian is bringing intelligence to the clinic in other ways too. Its 360 Oncology system allows cancer-treatment teams to collect and access all clinical data recorded for each of their patients, enabling better co-ordination between different specialities and enabling improvements in the quality of care. The system also supports clinical decisions by comparing treatment options and using predictive intelligence to make recommendations based on calculations of dose, toxicity and quality of life.

We can help hospitals to navigate this transformative technology, empowering them with the insights they need to improve clinical operations and workflow, and to optimize patient care and outcomes

Corey Zankowski

Varian’s role, says Zankowski, is to give clinicians the tools they need to unlock the power of their data at every step of the process – from pre-diagnosis through to treatment and post-treatment care. Its Noona software application, for example, is a smart, cloud-based software that allows patients to report any symptoms they experience outside of the clinic in a structured way. Importantly for medical teams, it incorporates intelligent algorithms to help identify those patients who need urgent care, while also keeping track of any patient concerns for discussion at future visits to the clinic.

Towards a smarter future

But Zankowski says that this is just the beginning of what will be possible with AI in healthcare. Already Varian is exploring the possibilities of adaptive radiotherapy, in which the treatment plan could be constantly updated in response to clinical changes in the patient. The first step towards this goal is to automate tasks that humans do slowly, such as image contouring in treatment planning. “AI could be used to perform mundane and time-consuming tasks in treatment planning, such as contouring the healthy organs and tissues for image-guided radiotherapy,” he explains. “That would allow the oncologist to concentrate on contouring the tumour.”

Intelligent software should also enhance the ability of clinicians to assess whether the treatment plan should be changed, allowing any adjustments to be made more quickly and so improve the efficacy of the treatment. Further in the future, AI could also be used to mine large clinical datasets to detect early signs of patients who are responding to treatment, and those who are not. “Patterns in the data might emerge from analyses done by intelligent machines that can look at data from hundreds of thousands or millions of cases,” he explains. “Such patterns couldn’t be discerned by humans because no human could simultaneously analyse data from enough cases.”

It might be too early to make detailed predictions of how artificial intelligence will change the way cancer is treated in the future, but Zankowski is convinced that it will have a positive impact for clinicians and for patients. “Varian products, with AI embedded within them, are already changing the practice of oncology,” he says. “We can help hospitals to navigate this transformative technology, empowering them with the insights they need to improve clinical operations and workflow, and to optimize patient care and outcomes.”

Writing the QA rulebook for MR-guided radiotherapy

A new generation of MR-guided radiotherapy (MRgRT) systems – capable of visualizing the tumour target during treatment and adapting radiation dose in real-time – is set to transform workflows in the radiation oncology clinic, reducing treatment times, delivering resource efficiencies and improving patient outcomes in the process.

At the biological level, the drivers for MRgRT are also compelling. Tumour shape and position relative to healthy tissue evolve over the course of treatment and can even change during an individual treatment session. The ability of MRgRT to detect those changes and adapt therapy accordingly – in effect, helping clinicians to “see what they treat” in real-time – means that radiation oncology teams are now able to improve the precision of radiation delivery, more effectively treating the tumour while sparing healthy tissue.

Put simply, MRgRT opens the door to personalized medicine tailored to the unique requirements of each patient – for example, adapting radiation delivery to treat tumours that respond rapidly to treatment as well as those that prove unresponsive to standard doses of radiation. That ability to capture the tumour and its environment “on the fly” will, in turn, make it possible to increase the radiation dose to diseased tissue without damaging adjacent organs at risk and other critical structures.

QA best practice

It’s still relatively early days for MRgRT, however, and what constitutes clinical best practice is very much work in progress – not least in terms of defining a rigorous and standardized approach to MRgRT system installation, acceptance, commissioning and ongoing quality assurance (QA).

At the American Association of Physicists in Medicine (AAPM) Annual Meeting in San Antonio, Texas, this week, Modus QA, a Canadian supplier of QA solutions for radiation oncology, will put those MRgRT QA procedures front and centre when it unveils a raft of new features for QUASAR MRI4D, its MR-safe, programmable 4D phantom.

Key areas of emphasis for this latest version of the MRI4D motion phantom include support for QA of MR-linac motion-tracking algorithms and beam latency measurements. Further QA innovation is also in the works for the tracking of complex, deformable motion associated with tumour volumes.

Ultimately, the goal for Modus is to provide the QA tools needed to support radiotherapy OEMs and their early-adopting customers with the clinical roll-out of MRgRT systems. Bringing breakthrough techniques into the clinic requires reliable, end-to-end QA – and in the case of adaptive MRgRT that means MRI-compatible 4D phantoms that make it possible to test the ability of novel MR imaging sequences to track a wide range of tumour motion in the patient (for example, when the patient breathes or when there’s peristaltic motion through the digestive tract).

QA should be simple and quick. It shouldn’t be something that takes our customers a long time.

Enzo Barberi, director of MR product development at Modus QA

The QUASAR MRI4D is designed to do just that on the ViewRay MRIdian and Elekta Unity MR-linacs (as well as other MRI systems such as the Philips Ingenia for MR simulation QA). Thanks to the compact design, users can place the MR-safe 4D phantom in the bore of the magnet to acquire images on low- and high-field strength MRI systems with no induced artefacts or RF noise. Interchangeable inserts are also available for a range of radiotherapy QA procedures spanning imaging, treatment planning, targeting, dosimetry and delivery.

“We spent a lot of time ensuring the simplicity of the set-up for the MRI4D with respect to the MRgRT workflow,” says Enzo Barberi, director of MR product development at Modus. “QA should be simple and quick. It shouldn’t be something that takes our customers a long time, whether they’re MRgRT OEMs or clinical early-adopters.”

Algorithm QA

Several of those MRgRT early-adopters are already using the MRI4D for their end-to-end QA, says Barberi, with particular focus on the motion-tracking algorithms used to “gate” the MR-linac’s treatment beam – i.e. rapidly switching the treatment beam on/off as the tumour moves in and out of the radiation field as a result of the patient’s breathing.

To enable these tests, the motion phantom includes a series of rigid targets that can be mounted centrally or offset in an insert to mimic numerous trajectories of a tumour in the body, including those seen during breathing. The insert can move in a linear fashion in and out of the phantom or can combine linear motion with an offset and twist of the target to follow a complex 3D path along the x, y and z directions.

“What we’ve seen in some cases is that this complex motion can confound the MRI tracking algorithms very easily,” says Barberi. “As a result, OEMs and early-adopters are using the motion phantom in the optimization, validation and commissioning of their motion-tracking algorithms.”

Barberi also highlights a work-in-progress R&D initiative to develop a deformable insert for the MRI4D – mirroring the complexity and 4D deformation that tumours are subjected to as a result of motion in the body. “We’re collaborating with STARLIT partners Utrecht University Medical Centre [in the Netherlands] and Elekta Canada to evaluate our tools that allow users, for example, to optimize image-tracking algorithms to follow deformable structures,” says Barberi. “This could be a huge benefit in future with the advent of real-time beam-tracking of the tumour.”

That focus on complex motion and deformation will also be invaluable for OEMs and their customers as they work together on the next generation of tracking algorithms to support faster MR imaging sequences and higher resolutions. “Watch this space,” adds Barberi. “We’ll have one of our proof-of-concept deformable prototypes at our AAPM exhibition booth this week.”

Meanwhile, other MRI-linac sites are using the MRI4D phantom in combination with dosimetry inserts to calculate and measure the dose that is administered to a moving target, ensuring that the treatment beam is actually hitting this moving target and not surrounding healthy tissue. Modus currently offers ion-chamber holders, says Barberi, with a film-cassette holder on the verge of being released.

Minimizing latency

Another new feature of the MRI4D relates to the gating of the MR-linac treatment beams to minimize the effects of patient motion – chiefly from the breathing cycle. With this in mind, the phantom can now provide accurate determination of beam-on and beam-off latency – a feature that will ultimately help to optimize MRgRT gating windows and minimize dosimetric errors.

“The lower the latency the better the job we’re doing in terms of maximizing dose to the target volume and minimizing dose to healthy tissue,” explains Barberi. “We’re not there yet, but down the road – maybe 5–10 years from now – there will be treatment functionality we don’t need – like gating, like breath-hold, possibly even patient immobilization. There are exciting, game-changing innovations taking shape in terms of fast onboard imaging, motion correction and real-time adaptive beam therapy.”

Modus QA is part of the ViewRay partner programme and the Elekta/Philips STARLIT (System Technologies for Adaptive Real-time MR image-guided Therapies) consortium. The aim of these initiatives is to provide next-generation enabling QA and dosimetry capabilities for MRgRT.

Modus QA will be exhibiting on booth 516 at the American Association of Physicists in Medicine Annual Meeting (San Antonio, TX) on 14–17 July.

Advanced microscopy pioneer leaves broad ranging legacy

Cell reproduction, disease detection and semiconductor optimization are just some of the areas of research that have exploited the atomic force microscope. First invented by Calvin Quate, Gerd Binnig and Christoph Gerber in the mid 1980s, atomic force microscopy (AFM) brought the atomic resolution recently achieved by the scanning tunnelling microscope to non-conducting samples, and helped to catalyse the avalanche of science and technology based on nanostructures that now permeates all aspects of modern life from smartphones to tennis rackets. On 6 July 2019 Calvin Quate died aged 95 at his home in Menlo Park, California.

Long before the development of AFM, Quate’s research had made waves in microscopy. 1978 had seen the announcement of the scanning acoustic microscope, which achieved the sensitivity of optical microscopy but probed samples so softly that it could image the interiors of living cells without damaging them. The technique uses high frequency sound waves in place of light, which penetrate deep into structures to image internal structures non-destructively. It is widely used in quality control of electronic component assembly among other applications such as printed circuit boards and medical products.

Although I later focused on optical and nanophotonic techniques, my own brief foray into microscopy began with a Master’s project on atomic force microscopy. Later while celebrating 30 years of the atomic force microscope at IOP Publishing, I had the chance to visit co-inventor Christoph Gerber at his University in Basel, Switzerland. He described how the idea had emerged during the Oberlach workshop where the first successful images with the scanning tunnelling microscope were announced. “Gerd Binnig came up with the idea to measure interactive forces between the tip and the sample surface and maybe this could be done by introducing a cantilever with an integrated tip,” says Gerber. “We took it from there and designed and developed the first AFM based on the latest development of the STM.”

While scanning tunnelling microscopy uses tunnelling electronic currents to image the surfaces of conducting samples, AFM uses an atomic sharp tip attached to a cantilever that gently feels the topography as it scans in a similar way to the stylus of a record player.  “When we published the paper in ’86 obviously lots of people picked up on it because it seemed to be so easy at the time just to scratch the surface with a stylus incorporated on a cantilever to get atomic resolution,” says Gerber. He describes how the first atomic resolution with the AFM was with a development from Quate’s group at Stanford University. “Calvin Quate had some extremely talented young pre-docs and postdocs and they developed the first cantilever from silicon, so this was batch microfabrication. It didn’t have a tip at that time – an integrated tip – but we were able to get the first atomic resolution on graphite just with the edge of that cantilever.”

One of Quate’s students Sang-Il Park went on to establish a successful business in atomic force microscopes at Park Systems. I had the chance to visit their labs too a few years ago, in Seoul, South Korea, where the company continues to push the capabilities of the technology.

The Leland T Edwards Professor of Engineering, emeritus, and a professor of applied physics at Stanford, Quate had accrued a panoply of awards over the course of his career, including the National Medal of Science, the Kavli Prize, the Rank Prize for Opto-Electronics and the Medal of Honor from the IEEE, as well as election to the National Academy of Engineering in 1970, the National Academy of Sciences in 1975 and Britain’s Royal Society in 1995. His legacy will continue for decades to come.

  • This was edited on Monday 15th July 2019 to include reference to the legacy of Quate’s students.

Vexillologist ponders the Moon, Jodrell Bank is UNESCO Heritage Site, particle physicist sings the praises of argon

This month marks the 50th anniversary of the Apollo 11 Moon landing, which famously involved the planting of an American flag on the lunar surface. In “An astronomical accomplishment”, we meet the vexillologist Annie Platoff who is a leading expert on flags that have been placed on the Moon. Based at the University of California, Santa Barbara, Platoff explains that putting a flag on the Moon was a significant technological accomplishment. “For me, the flag on the Moon is an excellent example of something that seems very, very simple, but once you really start thinking about it, you realize is very complex,” see says. In the article, she explains how several factors came together to make the flag look like it was flapping in a non-existent lunar breeze.

Keeping with the space theme, the UK’s Jodrell Bank Observatory has just been added to UNESCO’s World Heritage List. Located about 20 miles south of Manchester, the site was first used to detect radio waves from space in 1945 using surplus military radar equipment. The equipment had originally been installed at the University of Manchester but was moved by astronomer Bernard Lovell because of interference from nearby tram lines. The iconic Lovell radio telescope was built in 1957 and has become a much-loved landmark.

Above is a video recorded inside the ProtoDUNE neutrino detector by the particle physicist and vocalist Anastasia Basharina-Freshville. She is singing “We’ll fill it with argon”, which explains why the noble gas is used to detect the elusive particles. Enjoy!


Merging neutron stars could resolve Hubble constant crisis sooner than previously thought

The puzzling inconsistency between different measurements of the Hubble constant, which describes rate of expansion of the universe, could soon be better understood thanks to a new technique for analysing the explosive merger of two neutron stars.

Conflicting measurements of the Hubble constant arise from two different methods that have been used to measure the parameter. One involves observing stellar explosions called type Ia supernovae and the other involves fitting cosmological models to the cosmic microwave background (CMB) radiation.

The supernova method gives a Hubble constant of 73.5 km/s/Mpc, where a parsec (pc) is 3.26 light-years. This means that a point one million parsecs from Earth is expanding away from Earth at a rate of 73.5 km/s. Meanwhile, analysis of the European Space Agency’s Planck spacecraft’s observations of the CMB suggest a Hubble constant of 67.4 km/s/Mpc. While there are uncertainties in both measurements, the disagreement between the two values is statistically significant.

New physics?

The conflict suggests that either there is a flaw (or flaws) in how one or both measurements are made and interpreted; or that some sort of new physics is at work. Either way, solving the mystery will reveal new and potentially useful information and physicists are therefore keen on developing new and independent ways of calculating the Hubble constant.

One promising method it to study the gravitational waves and light that are produced in the merger of two neutron stars. This involves measuring the strength of the gravitational wave signal – which gives the distance to the merger – and the redshift of the light, which gives the speed at which the merged object is moving away from Earth. Such measurements are now possible thanks to the LIGO and Virgo gravitational-wave detectors, which have already seen one merger (called GW170817) and should see more.

The main challenge in using this technique is that the observed strength of the gravitational waves depends strongly on Earth’s relative orientation to the orbital plane of the neutron stars before they merged. If we happen to be looking along the direction perpendicular to the orbital plane, we will see the strongest signal. If not, the signal strength will be weaker. Therefore, the angle of inclination between the perpendicular and our direction of view is needed to calculate the distance to the merger.

Many mergers needed

One way of determining this angle is to measure the polarization of the gravitational waves. Earlier this year Stephen Feeney of the Flatiron Institute in New York City, Hiranya Peiris of University College London and colleagues showed that an accurate determination of the Hubble constant could be made in this way by studying approximately 50 neutron-star merger events.

Now, astronomers led by Kenta Hotokezaka of Princeton University have developed a new way of measuring the angle and have used it to analyse data from GW170817. It involves studying the relativistic jet of particles that blasts out of the black hole that was created by the merger. This jet should be perpendicular to the orbital plane and can be studied by observing the strong radio signal it emits.

Hotokezaka and colleagues developed a technique for measuring the opening angle of the jet, which defines how the jet spreads out as it moves away from the black hole (see figure). Once they had the opening angle, they can work-out the inclination angle required to calculate the Hubble constant.

Using data from GW170817 they obtain a Hubble constant of 70.3 km/s/Mpc. The uncertainty in the result is fairly large so their result overlaps both the CMB and supernovae values – so clearly just one merger observation is not enough to solve the mystery. However, Hotokezaka’s group estimate that a sample of just 15 gravitational wave events for which the opening angle can be measured should be enough to provide a meaningful value of the constant.

Middle ground

A likely outcome is that the neutron-star measurements will agree with either the CMB or supernovae value. However, Hotokezaka tells Physics World, “we think it is still possible that the true value [of the Hubble constant] is somewhere between the two”. If the value of the Hubble constant as measured by gravitational waves were to stay around 70.3 km/s/Mpc, it would imply that either there are inaccuracies in both the supernovae and CMB methods, which seems unlikely, or that new physics is involved.

Nobel laureate Adam Riess of the Johns Hopkins University and the Space Telescope Science Institute leads a project called SH0ES that measures the Hubble constant using type Ia supernovae. He says that the new technique is “promising for getting a result from gravitational waves sooner, due to the lower error per object”.

Indeed, it could take only another 5-10 years to detect enough gravitational wave events with observable afterglows, particularly if the forthcoming Japanese Kamioka Gravitational Wave Detector and LIGO India can team up LIGO and Virgo.

Hotokezaka and colleagues describe their work in Nature Astronomy.

Copyright © 2026 by IOP Publishing Ltd and individual contributors