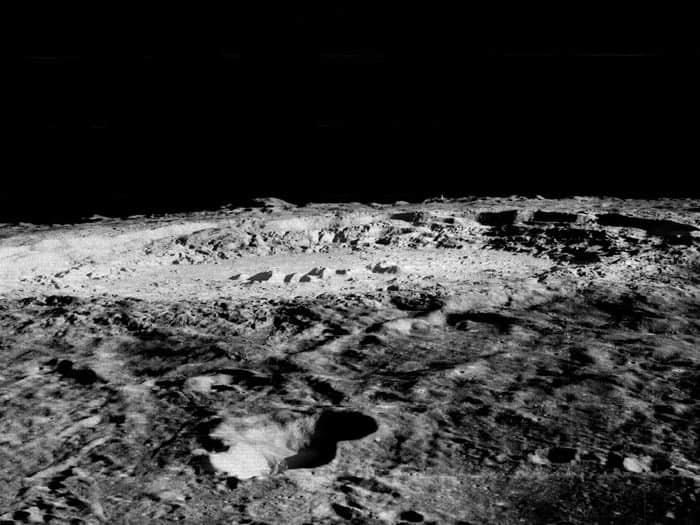
What’s in a moon?

Look up at the heavens after the Sun goes down, and one object in the Earth’s night sky will outshine all the others combined: our Moon. Although traditional stories ascribe many human and animal behaviours to the Moon – such as “lunacy”, nighttime howling and even menstrual cycles – those have long been debunked by science. Still, the Moon is much more than a pretty light in the sky, and is responsible for many phenomena beyond the tides. Predating humanity by some 4.5 billion years, our giant lunar companion is almost as old as the solar system itself. Without it, planet Earth just wouldn’t be the same.

When our solar system first formed, our infant Sun was surrounded by a collection of gas and dust: our protoplanetary disc. As gravitation worked to clump that matter together and grow it into planets, radiation from our star worked against us, blowing much of that material back into interstellar space. In the aftermath of our chaotic infancy, a system of spinning planets and smaller bodies remained, all orbiting the Sun in a great gravitational dance. Over time, they pushed and pulled on each other, with some objects migrating and others getting kicked out entirely. Eventually, the remaining survivors evolved into the configuration we recognize today, giving us our eight major planets.

Giant impact

Some planets may have formed with moons right from the outset, like Jupiter’s largest satellites. Others wound up capturing smaller bodies that became gravitationally drawn to their vicinity, like Neptune’s Triton or Saturn’s Phoebe. But these are the gentler options available for creating moons, and nature is not always gentle. As these massive bodies sped through the solar system during its infancy, they occasionally smashed into one another, colliding with energies far exceeding even the catastrophic impact that wiped out the dinosaurs.
Moon formation

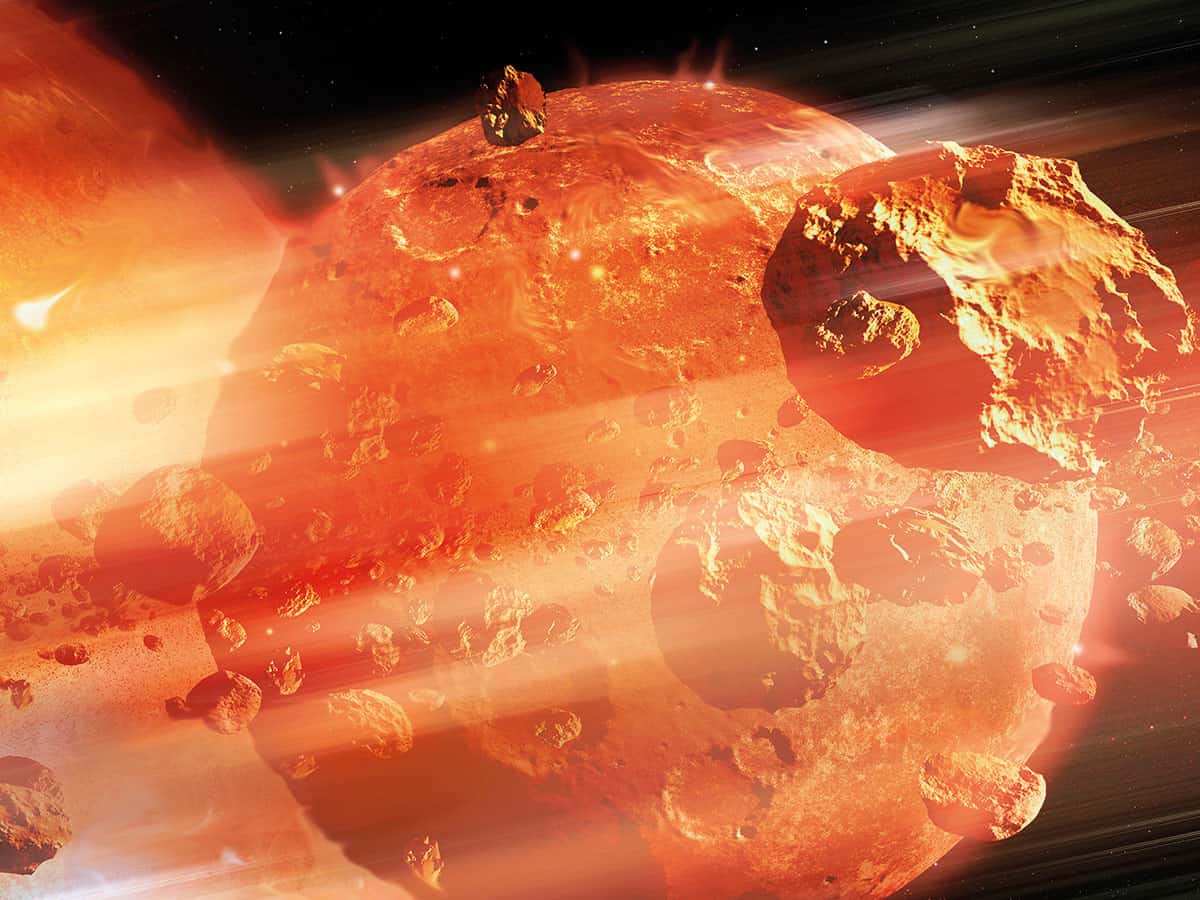
These giant impacts may be rare today, but would have occurred quite frequently during our solar system’s infancy. Back at the beginning, none of the rocky planets would have had moons, as these inner worlds are too small to either form with a moon, or capture one via their gravity. But a large impact on one of these worlds would kick up debris that would coalesce in orbit around the planet, capable of forming one or more satellites. When scientists first brought up this possibility as the origin of Earth’s large moon, few took the idea seriously.

But then something happened: between 1969 and 1972, we actually went to the Moon six times, and returned samples from it. Surprisingly, we found that the Moon had the same stable isotope-ratios that the Earth does, indicating a common origin. The properties of the Moon’s core match those of the Earth’s interior, and the Moon’s orbit around the Earth is oriented with – rather than against – our planet’s rotational axis. Modern simulations of collisions can reproduce not only our own Earth–Moon system, but the satellites of other small worlds, such as the two moons of Mars (there may have been a larger, third moon that fell back onto the red planet) or the five satellites of Pluto. After countless generations of wondering how and when our Moon was created, science has given the answer: a fast, energetic collision, some 4.5 billion years ago.

Missing moon

It was likely mere cosmic coincidence for the young Earth to experience such an impact, and a completely random outcome of it left us with such a large, natural satellite. In fact, relative to the size of the Earth, our Moon is more massive than any other planet–moon combination in the solar system. Indeed, it’s enough to make one wonder what would be different on our world if we didn’t have our Moon.

Although it shines only because of reflected sunlight, the Moon is by far the brightest object in Earth’s night sky. In its full phase, the Moon is 14,000 times brighter than Venus, the second-brightest object in our sky. From an ideal dark-sky site, the human eye is capable of viewing up to 6000 stars at once; along with the Milky Way, a handful of distant galaxies, and even zodiacal light – the diffuse glow of sunlight scattered by interplanetary dust. A full Moon can wipe practically all of that away, eliminating everything except perhaps the brightest 10% of stars from humanity’s view. Without a Moon, we would be rid of one of the biggest natural impediments to pristine, dark skies every night of the year from every location on Earth.

But we would also lose the stellar show that is an eclipse – indeed, we would no longer have eclipses of any type. Solar eclipses require the Moon to pass between the Earth and Sun, blocking out part (during a partial or annular eclipse) or all (during a total eclipse) of the Sun’s light from a particular set of locations on Earth, and they’re one of the most spectacular natural phenomena to occur on our world. Lunar eclipses occur when the Moon passes into the shadow created by the Sun shining on the Earth. Without our Moon in the sky, none of these celestial events would occur for us.

Time and tide

Another consequence of not having the Moon would be that the duration of a day wouldn’t change over time. It’s hard to believe, but our planet’s rate of rotation has slowed down tremendously over its history. Back when dinosaurs roamed the Earth millions of years ago, a single day took only 22 hours, rather than the modern 24. Billions of years ago, when single-celled organisms were the only life-forms around, our planet completed a full 360° rotation in under 10 hours. And our calendar, so well-calibrated today, will require further changes as time goes on. In another 4 million years, Earth’s rotation will slow significantly enough that we’ll no longer need leap days. The reason for this is that the Moon exerts a frictional force on the spinning Earth, causing its rotation to slow over time, and causing the Moon itself to slowly spiral away. If our Moon suddenly disappeared, Earth’s rotation rate would never change over time; it would be 24 hours per day from now until the Sun itself runs out of fuel.

Our tides would also be tiny compared to the ones we experience today. If you live near the oceanic coast – particularly by a bay, sound or inlet – you’ll notice enormous differences between high and low tide. The primary cause of the oceans bulging, and the rotation of the Earth causing two high tides and two low tides per day, is the gravitational effect of the Moon. The Sun also pulls on the oceans, but with only one-third of the effect of the Moon. During full and new moons, where the Sun, Earth and Moon are aligned, we get the highest high tides and the lowest low tides: spring tides. When the Sun, Earth and Moon form right angles, during a half-moon phase, we have neap tides, which have only half the tidal differences of spring tides. Without our Moon altogether, the tides would always be a constant, paltry size: a quarter the magnitude of spring tides and half the magnitude of today’s neap tides.

Most disturbingly of all, our Earth’s axial tilt would be unstable without our Moon. Earth currently spins on its axis with a 23.4° inclination to the plane in which we revolve around our Sun. Over tens of thousands of years, this tilt changes: from as little as 22.1° to as much as 24.5°. This relative stability is largely due to our Moon, which carries so much angular momentum that it prevents our rotational axis from changing by very much. Planets like Mars, which rotate with nearly the same period as Earth, but have no large moon to stabilize their rotation, see their axial tilts change by 10 times the amount that Earth’s does. If we didn’t have a Moon, our tilt could exceed 45° at times, making us more like Uranus: a world that rotates on its sides. The poles wouldn’t always be cold; the equator might not always be warm; ice ages would migrate across the globe every few thousand years. Without a Moon, a long-term stable climate might not be possible at all on our world.
Space exploration

A greater leap

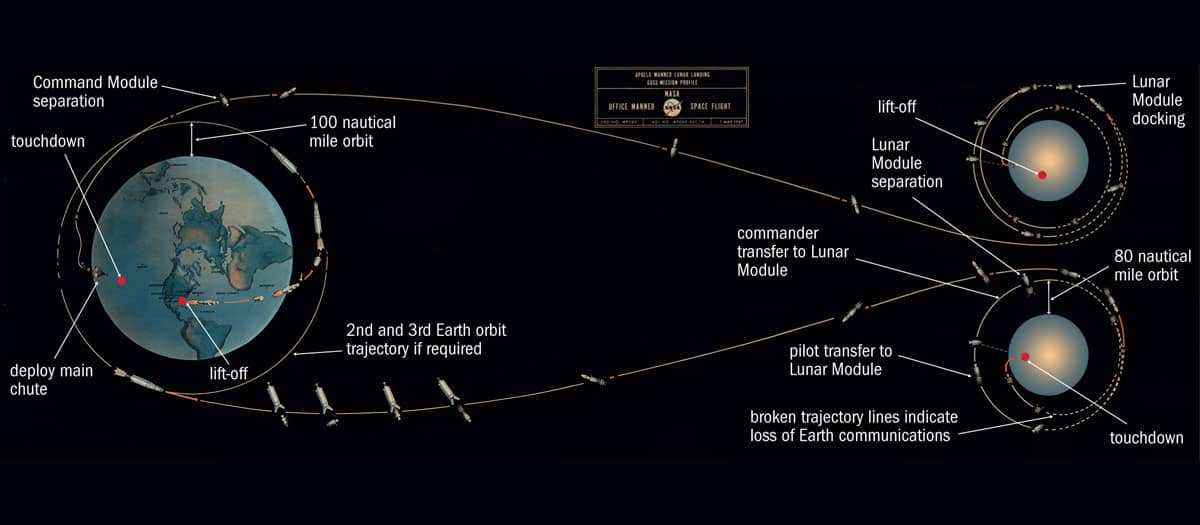
Finally, space exploration would have a much, much more difficult time reaching a world beyond our own. As soon as we developed the rocketry capabilities for crewed spaceflight to escape from Earth’s gravitational pull, we set our sights on our nearest neighbour. The Moon has a slew of advantages over any other potential target for a human landing on it. It has no atmosphere, meaning that there are no winds to contend with upon take-off or landing. It rotates slowly, so any mission under 14 days in duration could spend the entire time in sunlight. And most importantly, it’s close to Earth. A conventional, chemical fuel-driven rocket can make the journey in just three days; a communications signal at the speed of light can make the round-trip journey in 2.5 seconds. The Moon is a mere 385,000 km away, on average; whereas the next-closest planets, Venus and Mars, are approximately 100 times more distant, even during optimal alignments. Our Moon is a natural stepping-stone to the solar system, and the universe. Without it, our first small step on another world would have required a far greater leap for humankind.

There are still so many open questions we have about our Moon, and about moons in general. What was the collision that created our Moon like? How large was the object, where did it originate, and how quickly did it strike our world? Simulating the possibilities has led us away from the “giant impact hypothesis” – the idea that an ancient co-orbiting world dubbed Theia collided with our planet – and towards a new structure known as a synestia: a hypothesized torus of debris that coalesces into one or more objects. Ongoing and future studies of the lunar surface composition and its interior properties may yet reveal further information about the formation of the Moon, shedding light on what occurred during our solar system’s earliest times.

Many moons

There was no guarantee for our planetary history to have unfolded as it did. Collisions between massive bodies are rare, infrequent, and random. If we were to create practically identical conditions to the ones that existed in our early solar system, yielding an Earth–Moon system is just one of many possibilities. We could have had no moons at all, similar to Venus or Mercury. We could have formed a moon close by, which would have broken up and fallen back to Earth; perhaps we’d have developed a giant ridge along our equator, similar to Saturn’s Iapetus, or an enormous oceanic basin, like we find on Mars. We could have even wound up with many other combinations of naturally sized satellites, such as a single large moon along with many smaller moons, like those possessed by modern-day Pluto.

Multiple moons would give rise to a number of fascinating consequences on Earth. Finding true darkness could become an enormous challenge, as light from the reflected sunlight off of an array of moons might illuminate the night in an inescapable fashion. Periodic lunar alignments could create catastrophically large tides on occasion, making certain locations on Earth either challenging for human habitability, or a true surfer’s paradise. Even phenomena reserved for the satellites of the gas giants – like moons eclipsing other moons or causing double or even triple eclipses on the planetary surface – could have been commonplace here at home. We’d even have multiple nearby worlds to study, explore and provide additional clues concerning the origin and formation of planetary systems.

In reality, we have only one natural satellite to keep the Earth company as we journey around our Sun, and it’s been with us for the latter 99% of the solar system’s history. Our world, and the life that inhabits it, is forever changed by the presence of our nearest neighbour. As we celebrate the 50th anniversary of humanity’s first touchdown onto the lunar surface, we also celebrate the knowledge of all the ways our Moon continues to influence our planet. Without it, our skies, orbit, oceans, space programme and more just wouldn’t be the same.
Weak measurements track single nuclear spins

Nuclear magnetic resonance (NMR) spectroscopy is an invaluable technique for analysing the structure of molecules and for imaging their spin densities in 3D. The technique works by placing the sample in a strong magnetic field, which causes atomic nuclei with a non-zero magnetic moment (their spin) to align parallel or anti-parallel to the field. If the spins are tilted perpendicular to the field, by applying radiofrequency waves, they start to oscillate (or precess) along the external magnetic field direction. This free precession generates an electromagnetic signal that can then be measured using an induction coil.

There are downsides to the technique, however. For one, it requires strong magnetic fields, and it is also relatively insensitive – requiring at least 1012 to 1018 atomic nuclei to produce a detectable signal.

New approach

Physicists at ETH Zurich led by Christian Degen have now developed a new approach to NMR that allows them to directly track the precession of single nuclear spins. Until now, they were not sure that this was even possible because of an effect called quantum back-action, which is the disturbing effect that a measurement itself introduces onto the state of the quantum system being measured. In general, measurements in quantum mechanics are usually projective, which means that a measurement projects (or collapses or disturbs) the state of the quantum system it is measuring.

In their experiments, Degen and colleagues used the spin of an electron in a nitrogen-vacancy (N-V) centre in diamond as a sensor to measure the precession of carbon-13 nuclei. A N-V centre is an imperfection in the diamond lattice and occurs when two carbon atoms are replaced with a vacancy and a nitrogen atom. It is essentially a tiny magnet isolated from its surroundings.

Overcoming the disturbing effect of quantum back-action

The quantum back-action effect means that the researchers were unable to track the precession continuously. This is because the measurements induce two important effects: decoherence and frequency synchronization with the detector (or sampling clock as it is known). Decoherence results in a measurement-induced decay of the signal, explains team member and lead author of the study, Kristian Cujia. And synchronization with the detector occurs for sampling rates that are commensurate with the precession frequency of the nuclear spin.

To overcome these problems, the ETH Zurich physicists developed a new measurement technique to detect the spin of the carbon-13 atom through a series of rapid, periodic weak measurements performed one after the other. This approach meant that the measurements were not fully projective – that is, they only partially disturbed the state of the spin being measured, explains Cujia. The original precession could thus be measured.

Towards atomic-scale analysis

The researchers say that their technique “could pave the way to remarkable advances in NMR technology” and potentially allow them to directly record the spectra of individual molecules and analyse structures at the atomic level. Indeed, they have already identified the 3D position of the carbon-13 nuclei in their diamond lattice with atomic-scale resolution.

“We see our strategy of sequential/periodic weak measurements as being the equivalent of inductive detection in conventional NMR,” Cujia tells Physics World. “It could thus benefit from the many existing NMR protocols and methods to study systems on the molecular scale.”

Such detailed NMR measurements could lead to completely new insights in many areas, adds Degen, as has already been the case with conventional NMR spectroscopy in recent decades.

Full details of the research are reported in Nature 10.1038/s41586-019-1334-9.

Machine learning collaborations accelerate materials discovery

In 1863 five members of the Chōshū han in Japan made a secret journey to University College London in the UK to study. At the time of their departure, travel overseas was illegal in Japan, nonetheless all five students made an impact on the University that is commemorated to this day, and returned to establish institutions that augured a new era in their homeland, including the National Mint, the Japanese railways and the first prime minister. In the same spirit of international collaborations fostering pioneering innovations, materials and data scientists met at the Japanese Embassy in London on Friday 21 June during the “Season of Culture” to discuss “Global Trends in Research on Data-driven Discovery in Materials Science”. The event was the 10th scholarly colloquium organized by the journal Science and Technology of Advanced Materials (STAM).

Developments in data present an interesting example in science diplomacy where science and technology may facilitate a diplomatic agenda that in turn serves the interests of science. Speaking to attendees at the embassy, Teruo Kishi, science and technology adviser to the Minister for Foreign Affairs in Japan described a programme the Japanese government has recently begun promoting to strengthen the global digital economy – “Data Free Flow with Trust”. The initiative aims to establish global rules and norms for data sharing to prevent digital databases and institutions from fragmenting and becoming less productive. “The engine for growth, if you think about it, is fuelled no longer by gasoline but more and more by data,” added Kishi, quoting the words of the Japanese prime minister Shinzo Abe at a World Economic Forum earlier in 2019.

interview with Teruo Kishi, Advisor

Data quantity and quality

The work at the National Institute of Materials Science (NIMS) in Japan exemplifies the benefits extensive data can offer materials research. NIMS is a global leader in nickel-based materials research, having developed alloys with world record creep rupture performance with respect to temperature since the mid-1980s. The secret to this success, suggested NIMS president and STAM editor-in-chief Kazuhito Hashimoto in his presentation at the embassy, can be attributed to the high-quality nickel alloy samples safeguarded at NIMS for almost 40 years.

“Both data quality and quantity are important,” Kazuhito told attendees, a point that becomes ever more pertinent in an age where machine learning algorithms are making increasingly significant contributions to materials science. How these algorithms reach their results is not always obvious. However, feeding in large quantities of data, “trains” the algorithms to identify overarching trends from which they can then extrapolate the likely outcomes of unfamiliar scenarios. As such they have become powerful tools for materials discovery, but as the old adage goes “rubbish in, rubbish out”. As well as high quantities of data to train the algorithms, high quality is imperative.

interview with Kazuhito Hashimoto, President

Machine learning in data science

So what materials science projects could benefit from machine learning? NIMS researcher and STAM board member Ryo Tamura also described work at NIMS using machine learning to find new molecules that not only offer valuable properties but can be physically synthesized, as well as a smell sensor that identifies the ratio of ethanol and methanol – very similar organic molecules – and water, using two channels to diminish the machine learning error. Even the uncertainties in machine learning calculations can be useful. Tamura also described how he and his colleagues had used  uncertainty sampling with points of least confidence to generate phase diagrams.

James Elliott, a researcher at the University of Cambridge and STAM board member highlighted some of the artificial algorithms that have raised eyebrows in the worlds of chess, shoji and even Go, where world champions have all now met their match against machines. Like other machine learning algorithms, programs like Alpha Go have been trained on previous human and machine games, but the new player in the field – Alpha Zero – trains on no other input but the rules of the game, from which it then plays itself to train. Could this type of algorithm discover new materials based on just the rules of physics, Elliott asked attendees?

He went on to describe work using machine learning to complement more conventional ab initio calculations. One example stems from the shorter run times of machine learning calculations, which means they can highlight what ab initio calculations to run for more efficient numerical research. Work in Elliott’s group has helped to understand how the layers of graphite slide over each other, a process which despite its prevalence in systems ranging from a carbon nanotube space elevator to the humble pencil, until recently remained poorly understood.

interview with James Elliott, speaker

Data demands

While a physical hoard of nickel samples stretching back over four decades of materials science may be hugely beneficial to researchers at NIMS, it is easier to share and strengthen that advantage with digital data repositories. In the spirit of Data Free Flow with Trust and recognizing the demand for high-quality data in materials science, NIMS has launched a Materials Database project expected to run from 2017-2021 to automatically collect data from participating scientific publications and facility data repositories.

The idea seems likely to benefit materials science in general a great deal, although whether it will cater for fields like nanomaterials remains to be seen. “If the UK and Japan are willing to create a proper database for nanomaterials – that up to now does not exist,” Francesca Baletto told Physics World. A researcher at King’s College London and attendee at the event, she highlighted that so far existing materials databases are primarily for bulk materials, whereas nanomaterials, which have many more parameters to control present more specific logging requirements.

interview with Francesca Barletto, researcher

Automatic collection of data from institutional repositories poses a range of challenges. At present institutions record data in different forms, prompting suggestions that some form of international data standardization is needed. Despite the vastness of a scheme that hopes to sort and store such large and varied collections of data, the problem of data standardization may still be more tractable than potential issues around privacy, a point that cropped up in discussions after the talks as Adarsh Sandhu, researcher at the University of Electro-Communications in Japan and STAM deputy editor, pointed out. Data Free Flow with Trust and shared materials science databases intend to deal with purely nonpersonal data. However, it is not hard to see how valuable it might be if a machine learning algorithm for driverless cars, for example, could automatically access and train on data from people’s car journeys, or how quickly that might start to impinge on people’s expectations of privacy.

interview with Adarsh Sandhu, Dep. Editor

The databases that scour the literature for data may also benefit from more scholarly journals published open access so that they are not behind a paywall online.  Despite the arguments and growing support for mandatory open access publication for all publicly funded research, points passionately voiced by the UK Research Institute’s executive chair David Sweeney, funds and procedures for universal open access have proved difficult to establish.

Flying the flag for open access is the journal STAM, which organized the colloquium on materials informatics at the Japanese Embassy and whose Editorial Board many of the speakers at the event belong to, including Ryo Tamura,  James Elliott, Adarsh Sandhu and Masanobu Naito, as well as editors in chief both past and present Teruo Kishi  and Kazuhito Hashimoto. STAM, as Naito explained, began as a shop window for research at NIMS and other institutions in Japan and now competitively represents research from across the world. An open access publication since 2008, STAM celebrates its 20th anniversary next year in 2020.

Photo credits: Embassy of Japan in the UK

Twisted light gains angular momentum through ‘self-torque’

Physicists in Spain and the US have shown that the orbital angular momentum, or twistedness, of light can be made to vary rapidly in time. The researchers demonstrated what they call “self-torque” by generating high-frequency harmonics from two intense infrared laser pulses offset very slightly in time. They argue that light with this property could in future provide an ideal tool for manipulating molecules and other nanometre-sized structures.

Spin angular momentum is a familiar property of light, being manifest in the polarization of the light. But since 1992 it has been known that light exhibits a distinct property known as orbital angular momentum (OAM). This results in a twisting of a beam’s wavefront around its propagation axis so that the light takes on a spiral shape with zero intensity at its core. A beam can in principle have any amount of twistedness, with greater twist meaning that the wavefront rotates more quickly.

Physicists are using OAM to develop a range of new technologies. The number of data channels in a fibre-optic cable can be boosted by sending down light with multiple values of OAM, just as it can be enhanced via greater frequency bandwidth. Beams with OAM can also increase the resolution of microscopy and be used to manipulate microscopic objects such as nanoparticles, quantum dots and even living cells.

Twist in time

However, until now all light beams have a had a constant twist. In the latest work, scientists at the University of Salamanca and the Institute of Photonic Sciences (ICFO) in Barcelona working with colleagues at JILA in Colorado have shown it is possible to vary the twist in time – either speeding up or slowing down the rotation of the wavefront – by creating a light pulse from high-frequency harmonics. The “self-torque” generates this variation in momentum.

“With mechanical systems you need external forces,” says Salamanca team leader Carlos Hernández-García. “But in these light beams we have the torque without the presence of external forces.”

High-frequency harmonics can be created by firing intense infrared laser pulses into a gas. This ionizes the gas and free electrons stimulate ultraviolet emissions from the gas after being accelerated by the laser’s strong electric field. The emissions occur over a wide range of harmonics, resulting in light with frequencies hundreds or even thousands of times higher than that of the laser pulses.

Topological charge

Drawing up new models of harmonic generation, Hernández-García, Laura Rego and colleagues in Salamanca realized it should be possible to use this technique to generate self-torque. What was needed, they reasoned, were two infrared pulses with different amounts of OAM (or different values of their topological charge l) separated by a very short time interval. They reckoned that by superimposing these pulses and passing them through a gas, the l values of the resulting harmonics should vary in time.

The scheme relies on the fact that high-frequency harmonics of pulses with OAM will have proportionally higher l values than the pulses themselves (given that higher frequencies force the wavefront to twist more quickly). Because the 17th harmonic, say, of an l=1 and l=2 pulse will have l values of 17 and 34 respectively, that harmonic will have its l value vary stepwise from 17 to 34 when an l=1 pulse is merged with a trailing (and as such partially overlapping) l=2 pulse.

“As the ratio between the two pulses changes in time,” explains Hernández-García, “the OAM value of the harmonic, following conservation of momentum, also changes in time”.

These ideas were then realized in the lab by Kevin Dorney and colleagues at JILA, who focused superimposed l=1 and l=2 infrared pulses, each only around 50 fs long, on to a jet of argon. One of the biggest experimental challenges was being able to observe the effects of the self-torque, given that no available technique can resolve variations in OAM over femtosecond timescales. To do that they looked for, and found, a tell-tale sign in the spatial profile of the ultraviolet laser pulse that had been predicted by the Salamanca group – a continuous change in frequency, or “chirp”, across the doughnut-shaped profile.

Excellent agreement

“The agreement with our theoretical predictions was really excellent, and that allowed us to say that the beams were generated with self-torque,” says Hernández-García.

As to how the work could be applied practically, Hernández-García is reluctant to say too much – stating only that it might benefit applications that “require the ultrafast recording of information”. But Dorney is more specific, suggesting the research might enhance studies of “chiral molecules at the nanoscale” or improve understanding of the processes taking place inside the materials used to make smart phones and hard drives.

Ben McMorran of the University of Oregon praises the researchers for their “mastery of several advanced technologies in optics”, reckoning that their work could help “control and probe the movements and orientations of electrons in materials”. But he questions the term “self-torque”, arguing that the laser pulses do not themselves generate torque but instead pass it on. “Think of these pulses not as a motor but a driveshaft,” he says.

The research is described in Science.

LGBT+ scientists consider leaving work because of discrimination

Almost a third of LGBT+ physical scientists in the UK have considered leaving their jobs because of discrimination and toxic workplace climates. That is according to a new report by the Institute of Physics, Royal Astronomical Society and Royal Society of Chemistry. It also found that one in four LGBT+ scientists do not feel they can be themselves at work.

The report – Exploring the workplace for LGBT+ physical scientists – is based on a survey of over 600 people who identify as LGBT+ or support the LGBT+ community, and who work in the physical sciences as doctoral students, university employees, teachers and industry employees. As well as a questionnaire, 12 respondents were also interviewed with the report containing a number of individual stories.

Although the survey found that 75% of LGBT+ respondents thought their working environment was comfortable and 70% said it was improving, 16% had personally experienced harassment and 30% had witnessed exclusionary behaviour. Furthermore, men tended to respond more positively than women, who in turn were more positive than individuals who are non-binary (meaning they are transgender or do not identify as either a man or a woman). Teachers, the report found, have the least access to LGBT+ networks that would otherwise help alleviate isolation, exclusion and marginalization.

Ongoing journey

The report contains several recommendations that employers, learned societies and individuals can do to make the workplace environment more welcoming for the LGBT+ community. These include bystander and unconscious bias training; including your chosen pronoun in your email signature and online profiles; and having strongly signposted codes of conduct in companies and at events.

“Our report outlines a series of actions that will help cultivate a much more positive atmosphere for us all,” says Jennifer Dyer, head of diversity at the Institute of Physics (IOP), which publishes Physics World. “From showing visible support for the LGBT+ community to participating in events and ensuring policies and practices are in place to create an inclusive environment, there is nothing to hold us back from doing this”.

The report demonstrates that much improvement is required before the physical sciences can be considered open to everyone and that science needs to be more inclusive and supportive for it to reach its full potential. Indeed, speaking at an event on 26 June at Burlington House in London to launch the report, IOP chief executive Paul Hardaker, describes it as “the beginning of a continuing journey”.

Autonomous particle accelerators, how many superheroes are needed to make a film successful?

Huge particle accelerators like the Linac Coherent Light Source (LCLS) in the US don’t run themselves – it takes a team of highly-skilled technicians and engineers to keep the lights on. Back in 2015, LCLS operators monitored the time they were spending on managing the machine and realized that the beam-tuning process was ripe for automation.

This is just one example of how automation is being used to keep accelerators up and running – and protecting them when something goes wrong. You can read more about how accelerators could become more autonomous in “The future of particle accelerators may be autonomous” by Caitlyn Buongiorno.

What is the optimum cast size in a blockbuster superhero film? Matthew Roughan, Lewis Mitchell and Tobin South at the University of Adelaide in Australia have devised a “Shannon-entropy based metric” that they say provides the answer. The trio have uploaded a preprint to arXiv that uses data from the Marvel Cinematic Universe (MCU) to test their hypothesis.  They conclude that their metric provides a “useful predictor of ‘success’ for films in the MCU".

You can read more in “How the Avengers assemble: Ecological modelling of effective cast sizes for movies”.

Wish you were here? Seven chances to experience a total solar eclipse in the 2020s

It is one of nature's most spectacular shows. Next week – for the first time in almost two years – the Earth, Moon and Sun will fall into perfect alignment and produce a total solar eclipse. The Moon's umbra (the dark part of the Moon's shadow, where the Sun is completely obscured) will touch down in the South Pacific on 2 July and, in just 2 hours 44 minutes, trace a path of totality that extends more than 11,000 km around the globe.

Yet a total eclipse is also one of nature's most elusive shows. The path of totality may be thousands of kilometres long, but it is only about 160 km wide. Plus, the umbra seems to enjoy making things complicated. For the first 10,000 km of its journey across the Earth next week, for instance, the only landmass that the umbra encounters will be the remote coral atoll of Oeno (part of the Pitcairn Islands group). And although the umbra completes its journey by crossing Chile and Argentina, the average cloud amount is more than 50% for most of this overland phase.

The point is, catching totality is not a straightforward exercise. You have to make sure you're in the right place at the right time, and it helps to pay attention to the weather prospects. There are many people who have a total solar eclipse on their list of things to do in life; there are far fewer people who manage to plan ahead, put everything together, and actually get to experience totality.

Total solar eclipses in the 2020s

With this in mind, here is a guide to the next seven total solar eclipses, which takes us up to the end of the 2020s. If you've ever wondered what it's like to watch the Sun slowly be eaten away, to feel the change in the air as totality approaches, to hear the gasps of the people around you as they behold the solar corona – "one of the most brilliant and splendid phenomena that can well be imagined" as the astronomer Francis Baily said in 1842 – it's time to start thinking ahead.

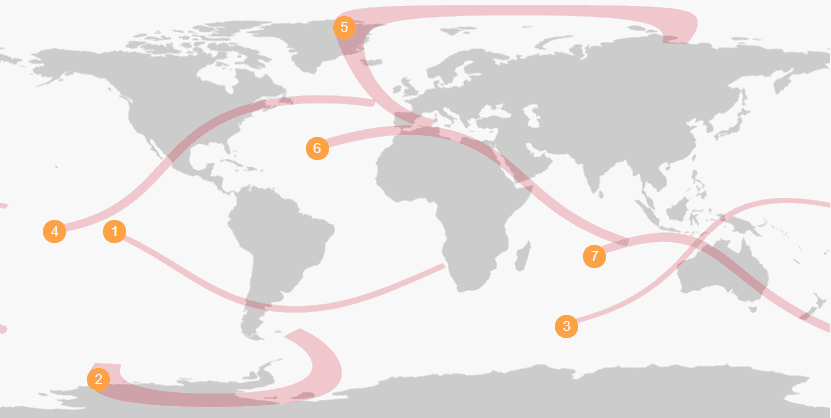
The above map shows the next seven paths of totality, and the notes below highlight some of the places that the umbra visits. The map and the following data on length of totality and average cloud cover are from timeanddate.com/eclipse.

14 December 2020: Chile and Argentina

It hardly seems fair. Next week's total solar eclipse crosses Chile and Argentina; the one after that, 17 months later, crosses the same two countries again. (Fun fact: Chile and Argentina also shared/share annular eclipses – where the moon is too far away to cover the sun completely – in 2017, 2024 and 2027.)

Where to see it

Ministro Ramos Mexía (Río Negro, Argentina)

Length of totality: 2 min 10 sec | Average cloud cover: 31%

This small village in the Patagonian province of Río Negro lies on the centre line of the path of totality, about 60 km from the point of greatest eclipse.

4 December 2021: Antartica

One of the interesting points about this eclipse, other than its inaccessibility, is the shape of the path of totality on the map. Usually, the umbra sweeps gracefully from left to right, but in the polar regions the distortions of the map can make it appear as if the umbra turns back on itself.

Where to see it

Union Glacier Camp (Union Glacier, Antarctica)

Length of totality: 49 seconds | Average cloud cover: 36%

A privately run camp that provides support to Antarctic expeditions from November to January. Access is via a flight from Punta Arenas in Chile.

20 April 2023: Australia, Timor-Leste and Indonesia

A rare hybrid eclipse. It begins as an annular eclipse over the southern Indian Ocean; turns into a total eclipse; crosses Australia's North West Cape (a 100 km-long peninsula, 1000 km north of Perth), Timor-Leste (also known as East Timor) and the sparsely populated Indonesian province of West Papua; then turns back into an annular eclipse over the western Pacific.

Where to see it

Exmouth (Western Australia, Australia)

Length of totality: 58 seconds | Average cloud cover: 16%

The largest town on the North West Cape. "Word coming out of Exmouth is that all the hotels are fully booked," says Matt Woods from the Perth Observatory, "but there'll be plenty of camping sites.”

8 April 2024: Mexico, USA and Canada

Seven years after the Great American Eclipse swept across the US from Oregon to South Carolina, the Great North American Eclipse runs from the Mexican state of Sinaloa to the Canadian province of Newfoundland and Labrador.

Where to see it

Nazas (Durango, Mexico)

Length of totality: 4 min 29 sec | Average cloud cover: 24%

The small town of Nazas is just 10 km from the point of greatest eclipse.

Dallas (Texas, USA)

Length of totality: 3 min 53 sec | Average cloud cover: 60%

Other US cities on the path of totality include Austin (Texas), Little Rock (Arkansas), Indianapolis (Indiana), Cleveland (Ohio) and Buffalo (New York).

Niagara Falls (Ontario, Canada)

Length of totality: 3 min 32 sec | Average cloud cover: 62%

The umbra will also visit Montréal in Quebec.

12 August 2026: Greenland, Iceland and Spain

An evening total eclipse across Spain, from the coast of Galicia to the island of Mallorca. "Observers should look from elevated sites or places with no tall buildings or mountains towards the west horizon," says Amelia Ortiz-Gil, an astronomer at the University of Valencia. "The sun will be quite low in the sky."

Where to see it

Reykjavík (Iceland)

Length of totality: 1 min 03 sec | Average cloud cover: 76%

Before arriving in Spain, the umbra will pass over the (possibly very cloudy) capital of Iceland.

Valladolid (Castilla-León, Spain)

Length of totality: 1 min 29 sec | Average cloud cover: 19%

"The wide flat expanses of Castilla-León will be great observing spots," says Amelia.

Valencia (Valencia, Spain)

Length of totality: 1 min 00 sec | Average cloud cover: 31%

"It's a bit early to say, but I'm sure we will organise some public observations of the eclipse in Valencia, and at our observatory in Aras de los Olmos, which is 80 km from the city at an altitude of 1300 m," adds Amelia.

2 August 2027: Atlantic, Mediterranean, Red Sea and Indian Ocean

The decade's most multinational total eclipse crosses 12 countries/territories from Morocco to the British Indian Ocean Territory. The duration of totality at the point of greatest eclipse – which reaches 6 min 23 sec near Luxor in Egypt – will be the longest until the year 2114.

Where to see it

Gibraltar (Gibraltar)

Length of totality: 4 min 29 sec | Average cloud cover: 16%

A mid-morning eclipse for the Rock of Gibraltar.

Luxor (Luxor, Egypt)

Length of totality: 6 min 22 sec | Average cloud cover: 0% (zero)

The site of the ancient Egyptian capital Thebes, Luxor is known as the world's greatest open-air museum.

Mecca (Hejaz, Saudi Arabia)

Length of totality: 5 min 16 sec | Average cloud cover: 4%

Islam's holiest city, only Muslims are allowed to enter Mecca.

22 July 2028: Australia and New Zealand

This kicks off something of a golden period for Australasian total eclipses: the umbra will cross Australia again in 2030, and both Australia and New Zealand in 2037 and 2038.

Where to see it

Mitchell Plateau (Western Australia, Australia)

Length of totality: 5 min 10 sec | Average cloud cover: 8%

The Mitchell Plateau area on Australia's north-west coast includes the point of greatest eclipse. "The Mitchell River National Park contains majestic waterfalls, Aboriginal rock art and sites of cultural significance to the Wunambal indigenous people," says Matt Woods. "It's recommended that you book your travel and accommodation early as it's a very remote part of our beautiful state."

Sydney (New South Wales, Australia)

Length of totality: 3 min 48 sec | Average cloud cover: 47%

"Sydney will give photographers fabulous places to take photos of the eclipse," reckons Matt.

Dunedin (Otago, New Zealand)

Length of totality: 2 min 51 sec | Average cloud cover: 59%

The path of totality also takes in the Otago region's main tourist towns: Queenstown and Wanaka.

Good luck with your planning, and always remember: NEVER look directly at the sun without protecting your eyes.

Ice-free Greenland possible in 1000 years

US scientists have just established that the long-term future may bring an ice-free Greenland, if melting continues at the current rate. By the year 3000 it could simply be green, with rocky outcrops. Greenland’s icy mountains will have vanished.

By the end of this century, the island – the largest body of ice in the northern hemisphere, and home to 8% of the world’s fresh water in frozen form – will have lost 4.5% of its ice cover, and sea levels will have risen by up to 33 cm.

And if melting continues, and the world goes on burning fossil fuels under climate science’s notorious “business as usual scenario”, then within another thousand years the entire cover will have run into the sea, which by then will have risen – just because of melting in Greenland – by more than seven metres, to wash away cities such as Miami, Los Angeles, Copenhagen, Shanghai and New Orleans.

“How Greenland will look in the future – in a couple of hundred years or in 1000 years – whether there will be Greenland, or at least a Greenland similar to today, it’s up to us”, said Andy Aschwanden, of the University of Fairbanks, Alaska geophysical institute.

He and colleagues from the US and Denmark report in the journal Science Advances that they used new radar data that gave a picture of the thickness of the ice and the bedrock beneath it to estimate the total mass of ice.

They then selected three possible climate outcomes, depending on national and political responses to the climate emergency, considered the rates at which glaciers had begun to flow, the levels of summer and even winter ice melt, and the warming of the oceans, and ran 500 computer simulations to form a picture of the future.

Researchers have been warning for years that the rate of ice loss in Greenland is accelerating. Ice is being lost from the ice sheet surface, in some places at such speed that the bedrock beneath, once crushed by the weight of ice, is beginning to rise.

The great frozen rivers that carry ice to the sea to form summer icebergs are themselves gathering pace: one of these in 2014 was recorded as having quadrupled in speed, to move at almost 50 m a day.

Research in polar regions is always difficult, and conclusions are necessarily tentative. On-the-ground studies are limited in summer and all but impossible in winter. The dynamic of ice loss changes, depending on conditions both in the atmosphere and the surrounding ocean.

Greenhouse gas increase

But the Fairbanks study is consistent with a huge body of other research. And the same computer simulations confirm that what happens depends ultimately on whether the world continues to heat up as a consequence of the profligate consumption of fossil fuels that increase the ratio of greenhouse gases in the atmosphere.

If carbon dioxide emissions are sharply reduced, the scientists say, the picture changes. Instead, the island could lose only up to a quarter of its ice cover by the end of this millennium, with a corresponding sea level rise of up to 1.88 m.

Another, less hopeful scenario foresees a loss of up to 57% and sea level rise of up to 4.17 m. In the worst case, the range of possible ice loss is from 72% to the lot, with the oceans higher by up to 7.28 m, all of it from the existing ice mass of Greenland.

“We project that Greenland will very likely become ice-free within a millennium without substantial reduction in greenhouse gas emissions,” the researchers conclude.

Gamma spectroscopy cuts beam-range uncertainty

Measuring the energy of gamma rays emitted during helium-ion radiotherapy could provide real-time verification of the beam’s range in the patient. Researchers in Germany and Portugal demonstrated a spectroscopy unit that can spot the signatures of 19 distinct nuclear transitions that occur when helium ions interact with various atomic nuclei near the end of the beam path. The technique will help define the size of the range error in particle therapy, allowing more precise treatments with greater sparing of healthy tissue (Med. Phys. 10.1002/mp.13594).

The advantages of particle therapy over X-ray radiotherapy are well established. Whereas photons deposit energy along their entire trajectory, irradiating large volumes before and behind the target, the dose delivered by protons and heavier ions is concentrated at the Bragg peak, just before the particles are brought to a halt by interactions with the medium.

This property of charged particles arises because their interaction cross-section increases as they slow down, meaning their range can be tuned by adjusting their initial velocity. Even with precisely controlled beam energy, however, errors from other sources – patient imaging and setup, for example – make the actual range in clinical applications uncertain.

It is necessary, therefore, to measure the beam range in vivo, so that physicists can confirm that the particles’ energy has been delivered to the correct depth in the patient. One method involves the use of PET to image the unstable isotopes created when the beam interacts with tissue. The problem with this technique is that, typically, several minutes elapse before the isotopes decay, during which time biological washout can compromise the signal. A more immediate indication can be achieved by measuring the secondary charged particles that are also produced by the beam, but as these are scattered by atomic nuclei on their way to the detector, the picture that emerges has poor spatial resolution.

Prompt gamma spectroscopy (PGS), the approach taken by Riccardo Dal Bello, at Heidelberg University and the German Cancer Research Center (DKFZ), Paulo Martins, at DKFZ and the University of Lisbon, and a team from DKFZ, Heidelberg University and the Max-Planck-Institute for Nuclear Physics in Germany, achieves the near-instant response of secondary charged-particle tracking while matching the spatial resolution of PET.

Dal Bello and colleagues fired beams of 4He, at energies similar to those used clinically, into acrylic or water targets. At 90° to the beam, at the point where they calculated the Bragg peak would be, the researchers placed a gamma spectroscope consisting of two concentric detectors.

The primary inner detector made high-resolution measurements of the energy of photons exiting the target. The outer detector was used for anti-coincidence detection, meaning that it spotted photons that had been scattered inelastically from atomic nuclei in the inner detector. In such cases, the energy recorded did not reflect the true energy of the photons that left the target, so these measurements were discarded.

Dal Bello and colleagues found that the measured spectra corresponded to specific, identifiable nuclear interactions. “The first interaction is always the collision between 4He and 16O,” says Joao Seco of DKFZ and Heidelberg University, who led the team. “Such collisions can produce a large number of nuclei at different excited levels. Therefore, from a single collision between 4He and 16O, multiple independent variables can be extracted, which can be used to estimate the energy of the collision.”

Observing the excitation states of the nuclei produced in collisions, then, gives a snapshot of the beam energy at that point on its trajectory. And because of the relationship between the energy of a particle and its range, knowing the energy at that point provides a way to determine how far the particles still have to go, and where the dose will be concentrated.

“The next step is the direct measurement of all the energy dependent cross sections for the prompt gamma production with proton, helium and carbon beams at clinically relevant energies,” says Seco. “At the moment, safety margins are added to the irradiated tumour volume to account for the range uncertainties in proton or carbon ion centres, so the first use of PGS would be to study range errors, reduce safety margins for a variety of treatment sites, and produce quantitative data.”

Will we soon see city lights glittering on distant planets?

From AbSciCon 2019 in Bellevue, Washington

Yesterday was day four of the Astrobiology Science Conference 2019 and the big news was NASA’s announcement that it will go ahead with the Dragonfly mission to explore Saturn’s moon Titan. The mission will launch in 2026 and arrive at Titan in 2034.

I watched the announcement on NASA TV with a few hundred others in the plenary ballroom at the conference hotel. A huge cheer went up as soon as Dragonfly was mentioned. Dragonfly was chosen over the proposed CAESAR comet sample-and-return mission and Dragonfly seemed the clear choice of the astrobiology community. This is not because CAESAR was uninteresting or unworthy, but because the idea of a drone flying around Saturn’s moon Titan, sampling the soil and atmosphere, was just too sweet and too romantic to resist. And space explorers are nothing if not romantic.

Now, on to the most exciting session I’ve attended so far – it was on Wednesday and was about “technosignatures.”

Astrobiologists are interested in signs of life – they call them “biosignatures” – and how these signs might arise and be detected in places like Mars, Titan and planets surrounding distant stars. I wrote about some of that in a previous blog from the conference.

Intelligent, advanced, and technologically capable

But what the public really want to see, according to one scientist here, are “technosignatures”. These are signs that intelligent, advanced, technologically capable beings exist (or existed) on another planet. Given the popularity of Star Wars, Star Trek and more recently, The Expanse, who could disagree?

Technosignatures could include evidence of megastructures – such as a Dyson sphere – surrounding a star or planet. (Hopefully you followed the saga of Tabby’s Star.) Other planetary technosignatures could include indications of artificial illumination (especially on the planet’s night side), or detection of waste heat from technological processes. Also fair game are urban heat islands, unusual shapes on the surface of a planet – perhaps like Dubai’s famous Palm Islands – or unusual albedo maps. And, of course, listening for electromagnetic signals from a planet, which is something the SETI community has been doing for years (albeit in a blunt fashion at relatively low bandwidth).

Some scientists here think that we are on the verge of being able to detect evidence of extraterrestrial technologies today, if they’re out there. Thomas Beatty, an astronomer at the University of Arizona, said “we are very close to detecting technosignatures from exoplanets” with today’s telescopes – or the next generation of instruments.

Bright lights, alien city

The proposed telescope LUVOIR could, he said, see nighttime lights (from cities) on an planet around Proxima Centauri, the closest star to Earth, only 4.3 light-years away in only 100 hours of observing time. Proxima Centauri is an M dwarf that has the exoplanet Proxima Centauri b in its habitable zone, where liquid water could exist. Svetlana Berdyugina at Albert-Ludwigs University of Freiburg in Germany talked about processing light signals to begin to distinguish potential large-scale land continents amidst an ocean background.

Imaging continents on other worlds. I don’t know about you, but that blows my mind. Check-out Berdyugina’s  2017 talk for more on this topic.

Other speakers want to use machine learning to pluck meaningful information from the immense streams of data that are, and increasingly will be, beamed back from scientific instruments and missions.

This has been one of the best, most interesting conferences I’ve ever attended in my 20 years as a science writer. Amidst all the talks and science, there has been a real sense of adventure, of pure curiosity wanting to know what is out there. The possibilities for this field seem almost endless, as large as the universe itself.

Dragonfly lands in 2034. What will come after that is being dreamed and discussed at conferences just like this one. I’m coming back next year.


Copyright © 2026 by IOP Publishing Ltd and individual contributors