Proton energies achievable in laser accelerators could be tripled by using specially designed micronozzle targets, according to computer simulations done by physicists in Japan and India. In their design, the electric field generated in the micronozzle would be funnelled towards the outgoing protons, allowing the acceleration to proceed for much longer. The researchers believe that the research could be useful in nuclear fusion, hadron therapy and materials science.
Conventional accelerators use oscillating electric fields to drive charged particles to relativistic speeds. The Large Hadron Collider at CERN, for example, uses radio-frequency oscillations to achieve proton energies of nearly 7 TeV.
These accelerators tend to be very large, which limits where they can be built. Laser acceleration, which involves using high-energy laser pulses to accelerate charged particle, offers a way to create much more compact accelerators.
Crucial to inertial confinement
Laser acceleration is crucial to inertial confinement fusion, and high energy proton beams produced by laser accelerators are used in scientific laboratories for a variety of scientific applications including laboratory astrophysics.
The standard techniques for laser acceleration involve firing a laser pulse at a proton target surrounded by metal foil. Solid hydrogen only exists near absolute zero, so the proton target can be a hydrogen-rich compound such as a hydride or a polymer. The femtosecond laser pulse concentrates a huge amount of energy into a tiny area and this instantly turns the target into a plasma. The light’s oscillating electromagnetic field drives electrons through the plasma, leaving behind the much heavier ions and creating a huge electric field that can accelerate protons.
In the new work, physicist Masakatsu Murakami and colleagues at the University of Osaka in Japan, together with researchers at the Indian Institute of Technology Hyderabad, used computer modelling to examine the effect of changing the shape of the metal surrounding the target from a simple planar foil to a two-headed nozzle, with the target placed at the narrowest point. During the first stage of the acceleration process, the wide head of the nozzle behaves like a lens, concentrating the electric field from a wide area to produce an enhanced flow of hot electrons towards the centre. This electric current on the nozzle enhances ablation of protons from the hydrogen rod, kicking them forward into the vacuum.
“Just like a rocket nozzle”
Subsequently, the electrons keep moving through the “skirt” of the nozzle, creating a powerful electric field that, owing to the nozzle’s shape, remains focused on the accelerating proton pulse as it travels away into the vacuum. “With the single hydrogen rod and the single foil, the protons are accelerated only during the laser illumination,” explains Murakami. “However, interestingly with the micronozzle target, the acceleration keeps going even after the laser pulse illumination…Most of the plasma expands in a small volume together with the protons – just like a rocket nozzle,” he says. Whereas the standard proton energies achievable with a laser accelerator today are around 400 MeV, the researchers estimate that their micronozzle design could allow energies into the gigaelectronvolt regime without changing anything else.
Murakami has been studying nuclear fusion for 40 years and believes that “this method will be used for fast ignition of laser fusion”. However, he says, its potential uses go far beyond this. Proton beam therapy generally uses protons with energies of 200–300 MeV to treat cancer by delivering a high dose of radiation to the tumour and a much lower dose to surrounding healthy tissue. “Even higher energy is required to target cancers that are located in deeper parts of the body,” he says. The technique could also be useful for materials science techniques such as proton radiography or for simulation of the physics of astrophysical objects such as neutron stars. “I’m planning to do proof of principle experiments in the near future,” says Murakami.
Accelerator physicist Nicholas Dover of Imperial College London describes the work as “very interesting,” adding, “This target that they propose is a very complex thing to make. It would be a big project for a target fabrication lab to generate something like this – it’s not something we just cook up in our lab. Having these numerical optimizations is really helpful for us.” He notes, however, that one reason accelerator physicists often use planar targets (essentially pieces of kitchen foil) is the need to replace them in every shot. In scientific applications, this may not matter, he says. Applications in fields like medicine, however, would probably require the development of mass production facilities to fabricate the targets economically.
Light has always played a central role in healthcare, enabling a wide range of tools and techniques for diagnosing and treating disease. Nick Stone from the University of Exeter is a pioneer in this field, working with technologies ranging from laser-based cancer therapies to innovative spectroscopy-based diagnostics. Stone was recently awarded the Institute of Physics’ Rosalind Franklin Medal and Prize for developing novel Raman spectroscopic tools for rapid in vivo cancer diagnosis and monitoring. Physics World’s Tami Freeman spoke with Stone about his latest research.
What is Raman spectroscopy and how does it work?
Think about how we see the sky. It is blue due to elastic (specifically Rayleigh) scattering – when an incident photon scatters off a particle without losing any energy. But in about one in a million events, photons interacting with molecules in the atmosphere will be inelastically scattered. This changes the energy of the photon as some of it is taken by the molecule to make it vibrate.
If you shine laser light on a molecule and cause it to vibrate, the photon that is scattered from that molecule will be shifted in energy by a specific amount relating to the molecule’s vibrational mode. Measuring the wavelength of this inelastically scattered light reveals which molecule it was scattered from. This is Raman spectroscopy.
Because most of the time we’re working at room or body temperatures, most of what we observe is Stokes Raman scattering, in which the laser photons lose energy to the molecules. But if a molecule is already vibrating in an excited state (at higher temperature), it can give up energy and shift the laser photon to a higher energy. This anti-Stokes spectrum is much weaker, but can be very useful – as I’ll come back to later.
How are you using Raman spectroscopy for cancer diagnosis?
A cell in the body is basically a nucleus: one set of molecules, surrounded by the cytoplasm: another set of molecules. These molecules change subtlety depending on the phenotype [set of observable characteristics] of the particular cell. If you have a genetic mutation, which is what drives cancer, the cell tends to change its relative expression of proteins, nucleic acids, glycogen and so on.
We can probe these molecules with light, and therefore determine their molecular composition. Cancer diagnostics involves identifying minute changes between the different compositions. Most of our work has been in tissues, but it can also be done in biofluids such as tears, blood plasma or sweat. You build up a molecular fingerprint of the tissue or cell of interest, and then you can compare those fingerprints to identify the disease.
We tend to perform measurements under a microscope and, because Raman scattering is a relatively weak effect, this requires good optical systems. We’re trying to use a single wavelength of light to probe molecules of interest and look for wavelengths that are shifted from that of the laser illumination. Technology improvements have provided holographic filters that remove the incident laser wavelength readily, and less complex systems that enable rapid measurements.
Raman spectroscopy can classify tissue samples removed in cancer surgery, for example. But can you use it to detect cancer without having to remove tissue from the patient?
Absolutely, we’ve developed probes that fit inside an endoscope for diagnosing oesophageal cancer.
Earlier in my career I worked on photodynamic therapy. We would look inside the oesophagus with an endoscope to find disease, then give the patient a phototoxic drug that would target the diseased cells. Shining light on the drug causes it to generate singlet oxygen that kills the cancer cells. But I realized that the light we were using could also be used for diagnosis.
Currently, to find this invisible disease, you have to take many, many biopsies. But our in vivo probes allow us to measure the molecular composition of the oesophageal lining using Raman spectroscopy, to be and determine where to take biopsies from. Oesophageal cancer has a really bad outcome once it’s diagnosed symptomatically, but if you can find the disease early you can deliver effective treatments. That’s what we’re trying to do.
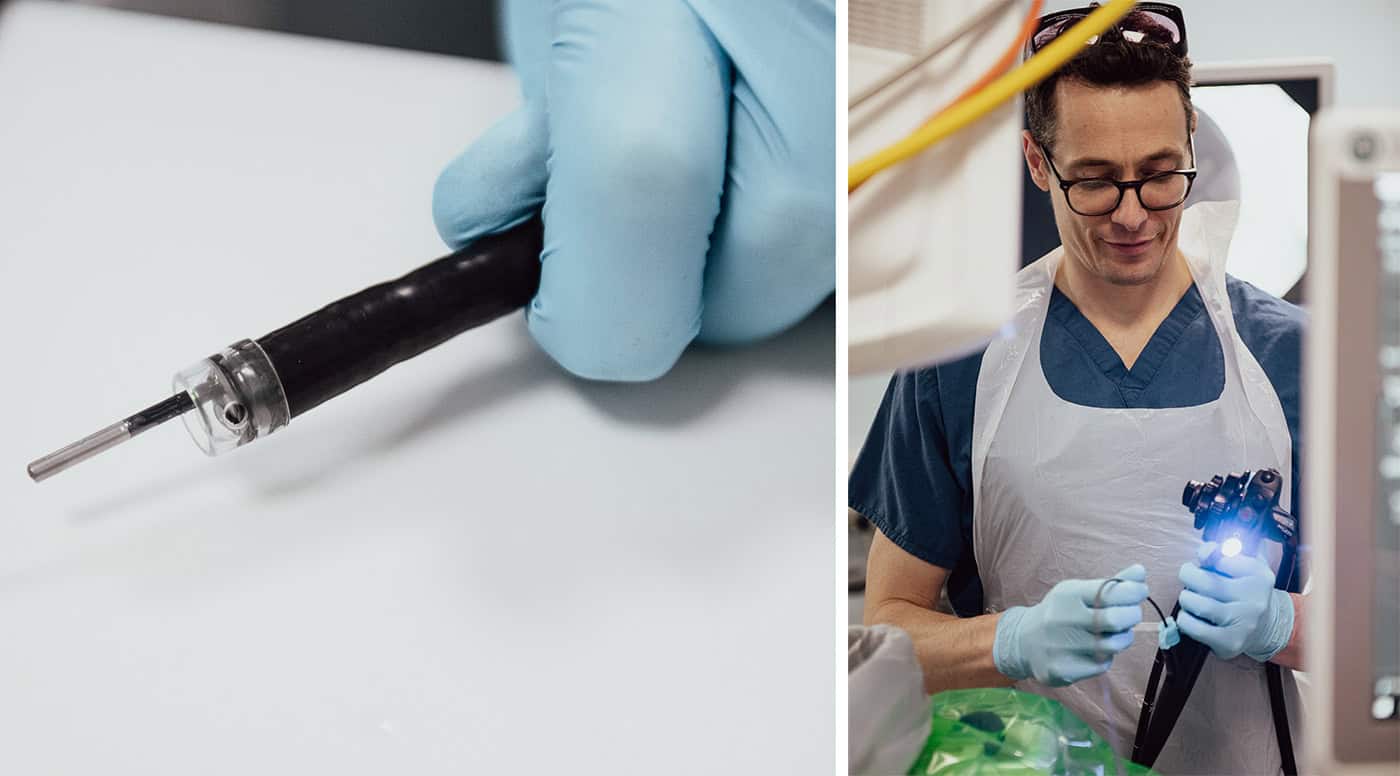
Tiny but mighty (left) A Raman probe protruding from the instrument channel of an endoscope. (right) Oliver Old, consultant surgeon, passing the probe down an endoscope for a study led by the University of Exeter, with the University of Bristol and Gloucestershire Hospitals NHS Foundation Trust as partners. (Courtesy: RaPIDE Team)
The very weak Raman signal, however, causes problems. With a microscope, we can use advanced filters to remove the incident laser wavelength. But sending light down an optical fibre generates unwanted signal, and we also need to remove elastically scattered light from the oesophagus. So we had to put a filter on the end of this tiny 2 mm fibre probe. In addition, we don’t want to collect photons that have travelled a long way through the body, so we needed a confocal system. We built a really complex probe, working in collaboration with John Day at the University of Bristol – it took a long time to optimize the optics and the engineering.
Are there options for diagnosing cancer in places that can’t be accessed via an endoscope?
Yes, we have also developed a smart needle probe that’s currently in trials. We are using this to detect lymphomas – the primary cancer in lymph nodes – in the head and neck, under the armpit and in the groin.
If somebody comes forward with lumps in these areas, they usually have a swollen lymph node, which shows that something is wrong. Most often it’s following an infection and the node hasn’t gone back down in size.
This situation usually requires surgical removal of the node to decide whether cancer is present or not. Instead, we can just insert our needle probe and send light in. By examining the scattered light and measuring its fingerprint we can identify if it’s lymphoma. Indeed, we can actually see what type of cancer it is and where it has come from.
Novel needle Nick Stone demonstrates a prototype Raman needle probe. (Courtesy: Matthew Jones Photography)
Currently, the prototype probe is quite bulky because we are trying to make it low in cost. It has to have a disposable tip, so we can use a new needle each time, and the filters and optics are all in the handpiece.
Are you working on any other projects at the moment?
As people don’t particularly want a needle stuck in them, we are now trying to understand where the photons travel if you just illuminate the body. Red and near-infrared light travel a long way through the body, so we can use near-infrared light to probe photons that have travelled many, many centimetres.
We are doing a study looking at calcifications in a very early breast cancer called ductal carcinoma in situ (DCIS) – it’s a Cancer Research UK Grand Challenge called DCIS PRECISION, and we are just moving on to the in vivo phase.
Calcifications aren’t necessarily a sign of breast cancer – they are mostly benign; but in patients with DCIS, the composition of the calcifications can show how their condition will progress. Mammographic screening is incredibly good at picking up breast cancer, but it’s also incredibly good at detecting calcifications that are not necessarily breast cancer yet. The problem is how to treat these patients, so our aim is to determine whether the calcifications are completely fine or if they require biopsy.
We are using Raman spectroscopy to understand the composition of these calcifications, which are different in patients who are likely to progress onto invasive disease. We can do this in biopsies under a microscope and are now trying to see whether it works using transillumination, where we send near-infrared light through the breast. We could use this to significantly reduce the number of biopsies, or monitor individuals with DCIS over many years.
Light can also be harnessed to treat disease, for example using photodynamic therapy as you mentioned earlier. Another approach is nanoparticle-based photothermal therapy, how does this work?
This is an area I’m really excited about. Nanoscale gold can enhance Raman signals by many orders of magnitude – it’s called surface-enhanced Raman spectroscopy. We can also “label” these nanoparticles by adding functional molecules to their surfaces. We’ve used unlabelled gold nanoparticles to enhance signals from the body and labelled gold to find things.
During that process, we also realized that we can use gold to provide heat. If you shine light on gold at its resonant frequency, it will heat the gold up and can cause cell death. You could easily blow holes in people with a big enough laser and lots of nanoparticles – but we want to do is more subtle. We’re decorating the tiny gold nanoparticles with a label that will tell us their temperature.
By measuring the ratio between Stokes and anti-Stokes scattering signals (which are enhanced by the gold nanoparticles), we can measure the temperature of the gold when it is in the tumour. Then, using light, we can keep the temperature at a suitable level for treatment to optimize the outcome for the patient.
Ideally, we want to use 100 nm gold particles, but that is not something you can simply excrete through the kidneys. So we’ve spent the last five years trying to create nanoconstructs made from 5 nm gold particles that replicate the properties of 100 nm gold, but can be excreted. We haven’t demonstrated this excretion yet, but that’s the process we’re looking at.
This research is part of a project to combine diagnosis and heat treatment into one nanoparticle system – if the Raman spectra indicate cancer, you could then apply light to the nanoparticle to heat and destroy the tumour cells. Can you tell us more about this?
We’ve just completed a five-year programme called Raman Nanotheranostics. The aim is to label our nanoparticles with appropriate antibodies that will help the nanoparticles target different cancer types. This could provide signals that tell us what is or is not present and help decide how to treat the patient.
We have demonstrated the ability to perform treatments in preclinical models, control the temperature and direct the nanoparticles. We haven’t yet achieved a multiplexed approach with all the labels and antibodies that we want. But this is a key step forward and something we’re going to pursue further.
We are also trying to put labels on the gold that will enable us to measure and monitor treatment outcomes. We can use molecules that change in response to pH, or the reactive oxygen species that are present, or other factors. If you want personalized medicine, you need ways to see how the patient reacts to the treatment, how their immune system responds. There’s a whole range of things that will enable us to go beyond just diagnosis and therapy, to actually monitor the treatment and potentially apply a boost if the gold is still there.
Looking to the future, what do you see as the most promising applications of light within healthcare?
Light has always been used for diagnosis: “you look yellow, you’ve got something wrong with your liver”; “you’ve got blue-tinged lips, you must have oxygen depletion”. But it’s getting more and more advanced. I think what’s most encouraging is our ability to measure molecular changes that potentially reveal future outcomes of patients, and individualization of the patient pathway.
But the real breakthrough is what’s on our wrists. We are all walking around with devices that shine light in us – to measure heartbeat, blood oxygenation and so on. There are already Raman spectrometers that sort of size. They’re not good enough for biological measurements yet, but it doesn’t take much of a technology step forward.
I could one day have a chip implanted in my wrist that could do all the things the gold nanoconstructs might do, and my watch could read it out. And this is just Raman – there are a whole host of approaches, such as photoacoustic imaging or optical coherence tomography. Combining different techniques together could provide greater understanding in a much less invasive way than many traditional medical methods. Light will always play a really important role in healthcare.
This article is based on a session at the Institute of Physics’ Celebration of Physics in April 2025.
Dynamic PET imaging is an important preclinical research tool used to visualize real-time functional information in a living animal. Currently, however, the temporal resolution of small-animal PET scanners is on the order of seconds, which is too slow to image blood flow in the heart or track the brain’s neuronal activity. To remedy this, the Imaging Physics Group at the National Institutes for Quantum Science and Technology (QST) in Japan has developed an ultrasensitive small-animal PET scanner that enables sub-second dynamic imaging of a rat.
The limited temporal resolution of conventional preclinical PET scanners stems from their low sensitivity (around 10%), caused by relatively thin detection crystals (10 mm) and a short axial field-of-view (FOV). Thus the QST team built a system based on four-layer, depth-encoding detectors with a total thickness of 30 mm. The scanner has a 325.6 mm-long axial FOV, providing total-body coverage without any bed movement, while a small inner diameter of 155 mm further increases detection efficiency.
“The main application of the total-body small-animal PET (TBS-PET) scanner will be assessment of new radiopharmaceuticals, especially for cardiovascular and neurodegenerative diseases, by providing total-body rodent PET images with sub-second temporal resolution,” first author Han Gyu Kang tells Physics World. “In addition, the scanner will be used for in-beam PET imaging, and single-cell tracking, where ultrahigh sensitivity is required.”
Performance evaluation
The TBS-PET scanner contains six detector rings, each incorporating 10 depth-of-interaction (DOI) detectors. Each DOI detector comprises a four-layer zirconium-doped gadolinium oxyorthosilicate (GSOZ) crystal array (16×16 crystals per layer) and an array of multi-anode photomultiplier tubes. The team selected GSOZ crystals because they have no intrinsic radiation signal, thus enabling low activity PET imaging.
The researchers performed a series of tests to characterize the scanner performance. Measurements of a 68Ge line source at the centre of the FOV showed that the TBS-PET had an energy resolution of 18.4% and a coincidence timing resolution of 7.9 ns.
Imaging a NEMA 22Na point source revealed a peak sensitivity of 45.0% in the 250–750 keV energy window – more than four times that of commercial or laboratory small-animal PET scanners. The system exhibited a uniform spatial resolution of around 2.6 mm across the FOV, thanks to the four-layer DOI information, which effectively reduced the parallax error.
In vivo imaging
Kang and colleagues next obtained in vivo total-body PET images of healthy rats using a single bed position. Static imaging using Na18F and 18F-FDG tracers clearly visualized bone structures and glucose metabolism, respectively, of the entire rat body.
Moving to dynamic imaging, the researchers injected an 18F-FDG bolus into the tail vein of an anesthetized rat for 15 s, followed by a saline injection 15 s after injection. They acquired early-phase dynamic PET data every second until 27 s after injection. To enable sub-second PET imaging, they used custom-written software to subdivide the list-mode data (1 s time frame) into time frames of 0.5 s, 0.25 s and 0.1 s.
Dynamic PET images with a 0.5 s time frame clearly visualized the blood stream from the tail to the heart through the iliac vein and inferior vena cava for the first 2 s, after which the tracer reached the right atrium and right ventricle. At 4.0 s after injection, blood flowed from the left ventricle into the brain via the carotid arteries. The cortex and kidneys were identified 5.5 s after injection. After roughly 17.5 s, the saline peak could be identified in the time-activity curves (TACs).
At 0.25 s temporal resolution, the early-phase images visualized the first pass blood circulation of the rat heart, showing the 18F-FDG bolus flowing from the inferior vena cava to the right ventricle from 2.25 s. The tracer next circulated to the lungs via the pulmonary artery from 2.5 s, and then flowed to the left ventricle from 3.75 s.
The TACs clearly visualized the time dispersion between the right and left ventricles (1.25 s). This value can change for animals with cardiac disease, and the team plans to explore the benefit of fast temporal resolution PET for diagnosing cardiovascular and neurodegenerative diseases.
The researchers conclude that the TBS-PET scanner enables dynamic imaging with a nearly real-time frame rate, visualizing cardiac function and pulmonary circulation of a rat with 0.25 s temporal resolution, a feat that is not possible with conventional small-animal PET scanners.
“One drawback of the TBS-PET scanner is the relatively low spatial resolution of around 2.6 mm, which is limited by the relatively large crystal pitch of 2.85 mm,” says Kang. “To solve this issue, we are now developing a new small-animal PET scanner employing three-layer depth-encoding detectors with 0.8 mm crystal pitch, towards our final goal of sub-millimetre and sub-second temporal resolution PET imaging in rodent models.”
A bumper crop of measurements of the expansion rate of the universe have stretched the Hubble tension as taut as it has ever been, with scientists grappling with trying to find a solution.
Over 500 researchers have come together in the “CosmoVerse” consortium to produce a new white paper that delves into the various cosmological tensions between theory and observation. These include the Hubble tension, which is the bewildering discrepancy in the expansion rate of the universe, referred to as the Hubble constant (H0).
Predictive measurements made by applying the standard model of cosmology to the cosmic microwave background (CMB) give H0 as 67.4 km/s/Mpc. In other words, every volume of space a million parsecs across (one parsec is 3.26 light years) should be expanding by 67.4 kilometres every second.
Yet that’s not what Hubble’s law – which tells us the expansion rate based on a given object’s velocity away from us and its distance – says, as demonstrated by the CosmoVerse White Paper.
“The paper’s been getting a lot of attention in our field,” Joe Jensen of Utah Valley University tells Physics World. “You can easily see that the vast majority of measurements fall around 73 km/s/Mpc, with varying uncertainties.”
There’s no known reason why local measurements of H0 (based on supernovae observations) should differ from the CMB measurement. This discrepancy leads to two possibilities. Either there are unknown systematic uncertainties in measurements that skew the results, or cosmology’s standard model is wrong and new physics is needed.
A lot at stake
The highest rung on the cosmic distance ladder is a type Ia supernova – a white dwarf explosion. They have a standardizable brightness that makes them perfect for judging how far away they are, based on their luminosity curve. These measurements are calibrated by lower rungs on the ladder, such as Cepheid variable stars or the peak brightness of red giant stars (referred to as the “tip of the red giant branch”, or TRGB).
If the tension is real, then different calibrators should still give the same result. One of the few outliers is found in a new paper published in The Astrophysical Journal by the Chicago–Carnegie Hubble Program (CCHP) led by the University of Chicago’s Wendy Freedman.
CCHP’s latest paper uses the TRGB to arrive at a best value of 70.39 km/s/Mpc when combining measurements from the James Webb Space Telescope (JWST) – which is able to better resolve red giant stars in other galaxies – with Hubble Space Telescope data.
The CCHP team argue that this result is in line with the CMB measurements and removes the tension. However, their conclusion has met opposition.
“Their result is sort of in the middle of the Hubble tension, so I’m surprised that they would say they rule it out,” Dan Scolnic, an astrophysicist at Duke University in the United States, tells Physics World.
At a meeting of the American Astronomical Society in January 2025, Scolnic declared that the Hubble tension was now a crisis. CCHP’s results do not dissuade him from this conclusion.
“For some reason they don’t include a number of supernovae in their sample that they could have,” says Scolnic. “Siyang Li [of Johns Hopkins University] led a paper [on which Scolnic is a co-author] that showed that if one uses their TRGB measurements, and the complete sample of supernovae, one goes back to higher H0.”
Freedman did not respond to Physics World‘s request for an interview.
Different approaches
Jensen has also led a team that recently conducted measurements of H0 using TRGB stars, but in a different way by looking for surface brightness fluctuations (SBF).
“SBF is a statistical method that measures the brightnesses of red giant stars even when they cannot be measured individually,” says Jensen.
Individual stars in galaxies cannot be resolved at great distance – their light blends together, and the more distant the galaxy, the smoother this blend is. We describe this blended light as the galaxy’s surface brightness, and fluctuations are statistical in nature and result from the discrete nature of stars.
In old elliptical galaxies, the surface brightness is dominated by red giant stars, which are evolved Sun-like stars. Measuring the SBF therefore provides a value for the TRGB, from which a distance can be determined.
Using JWST images to measure the SBF of 14 elliptical galaxies, then using those to calibrate the distances to 60 more distant ellipticals, and then using that calibration to determine H0, Jensen’s team arrived at a value of 73.8 km/s/Mpc.
“The reason that we don’t get the same answer [as CCHP] is that we are not using the same JWST calibrators, and we don’t use type Ia to measure H0,” says Jensen.
This contradicts CCHP’s main assertion, which is that there must be unknown systematic uncertainties in either the type Ia supernovae or the Cepheids. Jensen’s team use neither, yet still find a tension.
Perhaps the most convincing evidence for the tension comes from the TDCOSMO (time-delay cosmography) team, who utilize gravitationally lensed quasars to measure H0.
Quasars fluctuate in brightness over a matter of days. When light from a quasar takes paths of varying lengths around a lensing object, it produces multiple images that have time lags relative to one another. The expansion of space can extend this time delay, providing a completely independent measure of H0.
In 2019 the H0LiCOW project used six gravitational lenses to arrive at a value of 73.3 km/s/Mpc. This result came with some scepticism. So they formed the new TDCOSMO consortium and “went on a six-year journey to see if their original measurement was okay,” says Scolnic.
TDCOSMO’s final conclusion is 72.1 km/Mpc/s, strongly supporting the tension. However, in all these measurements there’s wriggle room from various known measuring uncertainties.
“It’s important to remember that the uncertainties put us in only mild disagreement,” says Jensen. “I expect that we will soon know if the disagreement can be explained by the mundane choices of calibration galaxies and processing techniques.”
If it cannot, then the inescapable conclusion is that there’s something wrong with our understanding of the universe. Figuring that out could be the next great quest in cosmology.
The first spectacular images from the Vera C Rubin Observatory have been released today showing millions of galaxies and Milky Way stars and thousands of asteroids in exquisite detail.
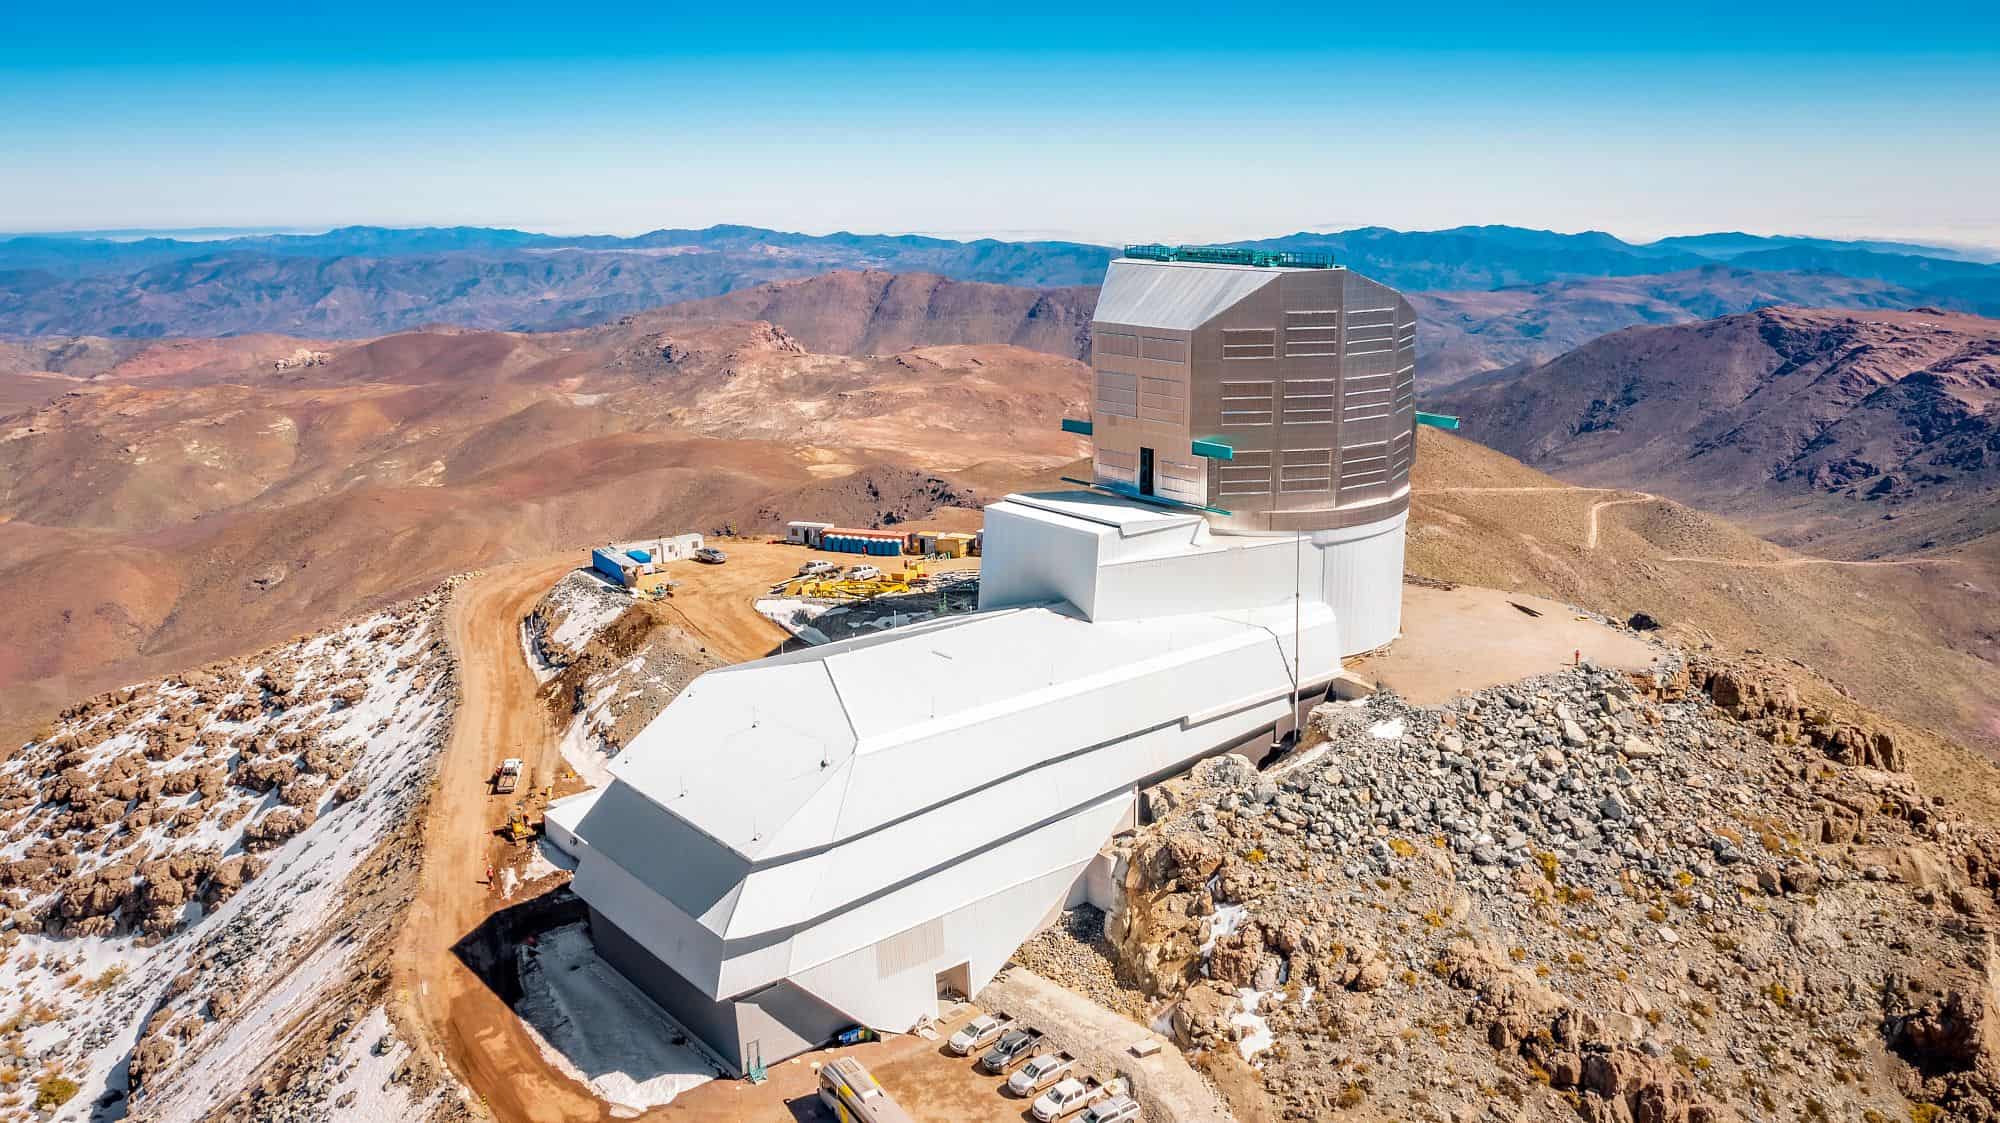
Based in Cerro Pachón in the Andes, the Vera C Rubin Observatory contains the Legacy Survey of Space and Time (LSST) – the largest camera ever built. Taking almost two decades to build, the 3200 megapixel instrument forms the heart of the observatory’s 8.4 m Simonyi Survey Telescope.
The imagery released today, which took just 10 hours of observations, is a small preview of the Observatory’s upcoming 10-year scientific mission.
The image above is of the Trifid and Lagoon nebulas. This picture combines 678 separate images taken by the Vera C Rubin Observatory in just over seven hours of observing time. It reveals otherwise faint or invisible details, such as the clouds of gas and dust that comprise the Trifid nebula (top right) and the Lagoon nebula, which are several thousand light-years away from Earth.
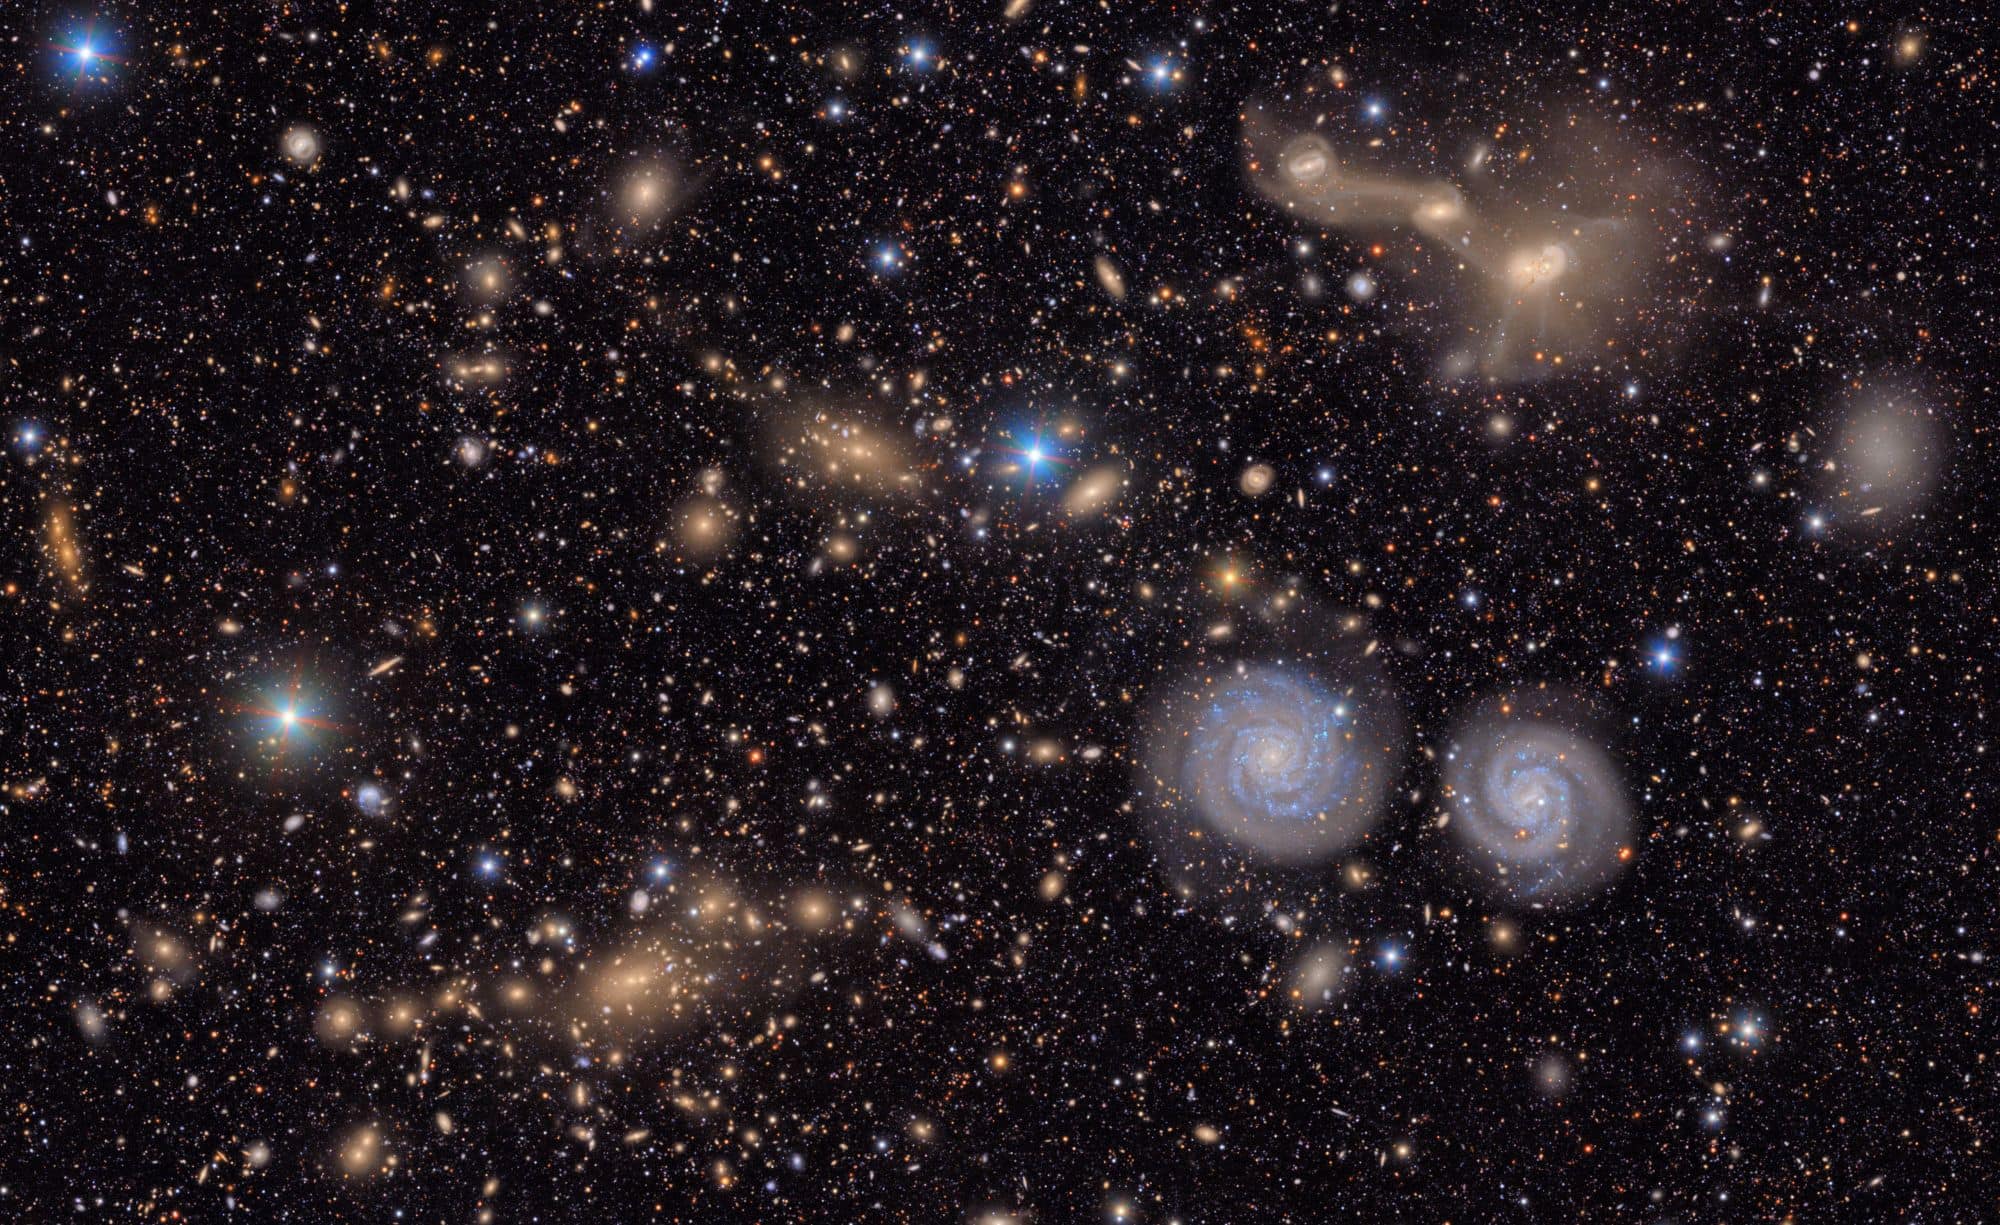
The image below is of the Virgo cluster. It shows a small section of the Virgo cluster, featuring two spiral galaxies (lower right), three merging galaxies (upper right) and several groups of distant galaxies.
Cosmic expanse: Vera C Rubin Observatory’s view of the Virgo cluster. (Courtesy: NSF-DOE Vera C Rubin Observatory)
Star mapper
Later this year, the Vera C Rubin Observatory, which is funded by the National Science Foundation and the Department of Energy’s Office of Science, will begin a decade-long survey of the southern hemisphere sky.
The LSST will take a complete picture of the southern night sky every 3-4 nights. It will then replicate this process over a decade to produce almost 1000 full images of sky.
This will be used to plot the positions and measure the brightness of objects in the sky to help improve our understanding of dark matter and dark energy. It will examine 20 billion galaxies as well as produce the most detailed star map of the Milky Way, imaging 17 billion stars and cataloguing some six million small objects within our solar system including asteroids.
Cosmic pioneer
On top of the world: Later this year, the Vera C Rubin Observatory will begin a decade-long survey of the southern hemisphere sky. (Courtesy: NSF-DOE Vera C Rubin Observatory)
The observatory is named in honour of the US astronomer Vera C Rubin. In 1970, working with Kent Ford Jr, they observed that outer stars orbiting in the Andromeda galaxy were all doing so at the same speed.
Examining more galaxies still, they found that their rotation curves – the orbital speed of visible stars within the galaxy compared with their radial distance to the galaxy centre – contradicted Kepler’s law.
They also found that stars near the outer edges of the galaxies were orbiting so fast that they should be falling apart.
Rubin and Ford Jr’s observation led them to predict that there was some mass, dubbed “dark matter”, inside the galaxies responsible for the anomalous motions, something their telescopes couldn’t see but was there in quantities about six times the amount of the luminous matter present.
Independent measurements of the charge radius of the helium-3 nucleus using two different methods have yielded significantly different results – prompting a re-evaluation of underlying theory to reconcile them. The international CREMA Collaboration used muonic helium-3 ions to determine the radius, whereas a team in the Netherlands used a quantum-degenerate gas of helium-3 atoms.
The charge radius is a statistical measure of how far the electric charge of a particle extends into space. Both groups were mystified by the discrepancy in the values – which hints at physics beyond the Standard Model of particle physics. However, new theoretical calculations inspired by the results may have already resolved the discrepancy.
Both groups studied the difference between the charge radii of the helium-3 and helium-4 nuclei. CREMA used muonic helium ions, in which the remaining electrons replaced by muons. Muons are much more massive than electrons, so they spend more time near the nucleus – and are therefore more sensitive to the charge radius.
Shorter wavelengths
Muonic atoms have spectra at much shorter wavelengths than normal atoms. This affects values such as the Lamb shift. This is the energy difference in the 2S1/2 and 2P1/2 atomic states, which are split by interactions with virtual photons and vacuum polarization. This is most intense near the nucleus. More importantly, a muon in an S orbital becomes more sensitive to the finite size of the nucleus.
In 2010, CREMA used the charge radius of muonic hydrogen to conclude that the charge radius of the proton is significantly smaller than the current accepted value. The same procedure was then used with muonic helium-4 ions. Now, CREMA has used pulsed laser spectroscopy of muonic helium-3 ions to extract several key parameters including the Lamb shift and used them to calculate the charge radius of muonic helium-3 nuclei. They then calculated the difference with the charge radius in helium-4. The value they obtained was 15 times more accurate than any previously reported.
Meanwhile, at the Free University of Amsterdam in the Netherlands, researchers were taking a different approach, using conventional helium-3 atoms. This has significant challenges, because the effect of the nucleus on electrons is much smaller. However, it also means that an electron affects the nucleus it measures less than does a muon, which mitigates a source of theoretical uncertainty.
The Amsterdam team utilized the fact that the 2S triplet state in helium is extremely long-lived. ”If you manage to get the atom up there, it’s like a new ground state, and that means you can do laser cooling on it and it allows very efficient detection of the atoms,” explains Kjeld Eikema, one of the team’s leaders after its initial leader Wim Vassen died in 2019. In 2018, the Amsterdam group created an ultracold Bose–Einstein condensate (BEC) of helium-4 atoms in the 2S triplet state in an optical dipole trap before using laser spectroscopy to measure the ultra-narrow transition between the 2S triplet state and the higher 2S singlet state.
Degenerate Fermi gas
In the new work, the researchers turned to helium-3, which does not form a BEC but instead forms a degenerate Fermi gas. Interpreting the spectra of this required new discoveries itself. “Current theoretical models are insufficiently accurate to determine the charge radii from measurements on two-electron atoms,” Eikema explains. However, “the nice thing is that if you measure the transition directly in one isotope and then look at the difference with the other isotope, then most complications from the two electrons are common mode and drop out,” he says. This can be used to the determine the difference in the charge radii.
The researchers obtained a value that was even more precise than CREMA’s and larger by 3.6σ. The groups could find no obvious explanation for the discrepancy. “The scope of the physics involved in doing and interpreting these experiments is quite massive,” says Eikema; “a comparison is so interesting, because you can say ‘Well, is all this physics correct then? Are electrons and muons the same aside from their mass? Did we do the quantum electrodynamics correct for both normal atoms and muonic atoms? Did we do the nuclear polarization correctly?’” The results of both teams are described in Science (CREMA, Amsterdam).
While these papers were undergoing peer review, the work attracted the attention of two groups of theoretical physicists – one led by Xiao-Qiu Qi f the Wuhan Institute of Physics and Mathematics in China, and the other by Krzysztof Pachucki of the University of Warsaw in Poland. Both revised the calculation of the hyperfine structure of helium-3, finding that incorporating previously neglected higher orders into the calculation produced an unexpectedly large shift.
“Suddenly, by plugging this new value into our experiment – ping! – our determination comes within 1.2σ of theirs,” says Eikema; “which is a triumph for all the physics involved, and it shows how, by showing there’s a difference, other people think, ‘Maybe we should go and check our calculations,’ and it has improved the calculation of the hyperfine effect.” In this manner the ever improving experiments and theory calculations continue to seek the limits of the Standard Model.
Xiao-Qiu Qi and colleagues describe their calculations inPhysical Review Research, while Pachucki’s team have published in Physical Review A.
Eikema adds “Personally I would have adjusted the value in our paper according to these new calculations, but Science preferred to keep the paper as it was at the time of submission and peer review, with an added final paragraph to explain the latest developments.”
Theoretical physicist Marko Horbatsch at Canada’s York University is impressed by the experimental results and bemused by the presentation. “I would say that their final answer is a great success,” he concludes. “There is validity in having the CREMA and Eikema work published side-by-side in a high-impact journal. It’s just that the fact that they agree should not be confined to a final sentence at the end of the paper.”
Fusion is usually performed via two types of plasma confinement. Magnetic involves using magnetic fields to hold stable a plasma of deuterium-tritium (D-T), while inertial confinement uses rapid compression, usually by lasers, to create a confined plasma for a short period of time.
The award-winning work was based on experiments carried out at the National Ignition Facility (NIF) based in California, which is one of the leading fusion centres in the world.
During NIF’s ICF experiments, a slight imbalance of the laser can induce motion of the hot central core of an ignition capsule, which contains the D-T fuel. This effect results in a reduced performance.
Experiments at NIF in 2018 found that laser imbalances alone, however, could not account for the motion of the capsule. The simulations carried out by Milovich and colleagues demonstrated that other factors were at play such as non-concentricity of the layers of the material surrounding the D-T fuel as well as “drive perturbations” induced by diagnostic windows on the implosion.
Computational physicist Jose Milovich of the Lawrence Livermore National Laboratory. (Courtesy: LLNL)
Awarded each year, the PPCF prize aims to highlight work of the highest quality and impact published in the journal. The award was judged on originality, scientific quality and impact as well as being based on community nominations and publication metrics. The prize will be presented at the 51st European Physical Society Conference on Plasma Physics in Vilnius, Lithuania, on 7–11 July.
Below, Milovich talks to Physics World about prize, the future of fusion and what advice he has for early-career researchers.
What does winning the 2025 PPCF Outstanding Paper Prize mean to you and for your work?
The award is an incredible honour to me and my collaborators as a recognition of the detailed work required to make inertial fusion in the laboratory a reality and the dream of commercial fusion energy a possibility. The paper presented numerical confirmation of how seemingly small effects can significantly impact the performance of fusion targets. This study led to target modifications and revised manufacturing specifications for improved performance. My collaborators and I would like to deeply thank PPCF for granting us this award.
What excites you about fusion?
Nuclear fusion is the process that powers the stars, and achieving those conditions in the laboratory is exciting in many ways. It is an interesting scientific problem in its own right and it is an incredibly challenging engineering problem to handle the extreme conditions required for successful energy production. This is an exciting time since the possibility of realizing this energy source became tangibly closer two years ago when NIF successfully demonstrated that more energy can be released from D-T fusion than the laser energy delivered to the target.
What are your thoughts on the future direction of ICF and NIF?
While the challenges ahead to make ICF commercially feasible are daunting, we are well positioned to address them by developing new technologies and innovative target configurations. Applications of artificial intelligence to reactor plant designs, optimized operations, and improvements on plasma confinement could potentially lead to improved designs at a fraction of the cost. The challenges are many but the potential for providing a clean and inexhaustible source of energy for the benefit of mankind is invigorating.
What advice would you give to people thinking about embarking on a career in fusion?
This is an exciting time to get involved in fusion. The latest achievements at NIF have shown that fusion is possible. There are countless difficulties to overcome, making it an ideal time to devote one’s career in this area. My advice is to get involved now since, at this early stage, any contribution will have a major and lasting impact on mankind’s future energy needs.
Artificial intelligence (AI) has the potential to generate a sea change in the practice of radiology, much like the introduction of radiology information system (RIS) and picture archiving and communication system (PACS) technology did in the late 1990s and 2000s. However, AI-driven software must be accurate, safe and trustworthy, factors that may not be easy to assess.
Machine learning software is trained on databases of radiology images. But these images might lack the data or procedures needed to prevent algorithmic bias. Such algorithmic bias can cause clinical errors and performance disparities that affect a subset of the analyses that the AI performs, unintentionally disadvantaging certain groups of patients.
A multinational team of radiology informaticists, biomedical engineers and computer scientists has identified potential pitfalls in the evaluation and measurement of algorithmic bias in AI radiology models. Describing their findings in Radiology, the researchers also suggest best practices and future directions to mitigate bias in three key areas: medical image datasets; demographic definitions; and statistical evaluations of bias.
Medical imaging datasets
The medical image datasets used for training and evaluation of AI algorithms are reflective of the population from which they are acquired. It is natural that a dataset acquired in a country in Asia will not be representative of the population in a Nordic country, for example. But if there’s no information available about the image acquisition location, how might this potential source of bias be determined?
Team leader Paul Yi. (Courtey: RSNA)
Lead author Paul Yi, of St. Jude Children’s Research Hospital in Memphis, TN, and coauthors advise that many existing medical imaging databases lack a comprehensive set of demographic characteristics, such as age, sex, gender, race and ethnicity. Additional potential confounding factors include the scanner brand and model, the radiology protocols used for image acquisition, radiographic views acquired, the hospital location and disease prevalence. In addition to incorporating these data, the authors recommend that raw image data are collected and shared without institution-specific post-processing.
The team advise that generative AI, a set of machine learning techniques that generate new data, provides the potential to create synthetic imaging datasets with more balanced representation of both demographic and confounding variables. This technology is still in development, but might provide a solution to overcome pitfalls related to measurement of AI biases in imperfect datasets.
Defining demographics
Radiology researchers lack consensus with respect to how demographic variables should be defined. Observing that demographic categories such as gender and race are self-identified characteristics informed by many factors, including society and lived experiences, the authors advise that concepts of race and ethnicity do not necessarily translate outside of a specific society and that biracial individuals reflect additional complexity and ambiguity.
They emphasize that ensuring accurate measurements of race- and/or ethnicity-based biases in AI models is important to enable accurate comparison of bias evaluations. This not only has clinical implications, but is also essential to prevent health policies being established in error from erroneous AI-derived findings, which could potentially perpetuate pre-existing inequities.
Statistical evaluations of bias
The researchers define bias in the context of demographic fairness and how it reflects differences in metrics between demographic groups. However, establishing consensus on the definition of bias is complex, because bias can have different clinical and technical meanings. They point out that in statistics, bias refers to a discrepancy between the expected value of an estimated parameter and its true value.
As such, the radiology speciality needs to establish a standard notion of bias, as well as tackle the incompatibility of fairness metrics, the tools that measure whether a machine learning model treats certain demographic groups differently. Currently there is no universal fairness metric that can be applied to all cases and problems, and the authors do not think there ever will be one.
The different operating points of predictive AI models may result in different performance that could lead to potentially different demographic biases. These need to be documented, and thresholds should be included in research and by commercial AI software vendors.
Key recommendations
The authors suggest some key courses of action to mitigate demographic biases in AI in radiology:
Improve reporting of demographics by establishing a consensus panel to define and update reporting standards.
Improve dataset reporting of non-demographic factors, such as imaging scanner vendor and model.
Develop a standard lexicon of terminology for concepts of fairness and AI bias concepts in radiology.
Develop standardized statistical analysis frameworks for evaluating demographic bias of AI algorithms based on clinical contexts
Require greater demographic detail to evaluate algorithmic fairness in scientific manuscripts relating to AI models.
Yi and co-lead collaborator Jeremias Sulam, of Hopkins BME, Whiting School of Engineering, tell Physics World that their assessment of pitfalls and recommendations to mitigate demographic biases reflect years of multidisciplinary discussion. “While both the clinical and computer science literature had been discussing algorithmic bias with great enthusiasm, we learned quickly that the statistical notions of algorithmic bias and fairness were often quite different between the two fields,” says Yi.
“We noticed that progress to minimize demographic biases in AI models is often hindered by a lack of effective communication between the computer science and statistics communities and the clinical world, radiology in particular,” adds Sulam.
A collective effort to address the challenges posed by bias and fairness is important, notes Melissa Davis of Yale School of Medicine, in an accompanying editorial in Radiology. “By fostering collaboration between clinicians, researchers, regulators and industry stakeholders, the healthcare community can develop robust frameworks that prioritize patient safety and equitable outcomes,” she writes.
Last week, Physics World’s Matin Durrani boarded a ferry in Hamburg that was bound for Helgoland – an archipelago in the North Sea about 70 km off the north-west coast of Germany.
It was a century ago in Helgoland that the physicist Werner Heisenberg devised the mathematical framework that underpins our understanding of quantum physics.
Matin was there with some of the world’s leading quantum physicists for the conference Helgoland 2025: 100 Years of Quantum Mechanics – which celebrated Heisenberg’s brief stay in Helgoland.
He caught up with three eminent physicists and asked them to reflect on Heisenberg’s contributions to quantum mechanics and look forward to the next 100 years of quantum science and technology. They are Tracy Northup at the University of Vienna; Michelle Simmons of the University of New South Wales, Sydney; and Peter Zoller of the University of Innsbruck.
Join us to learn about the development and application of a 3-Electrode setup for the operando detection of side reactions in Li-Ion batteries.
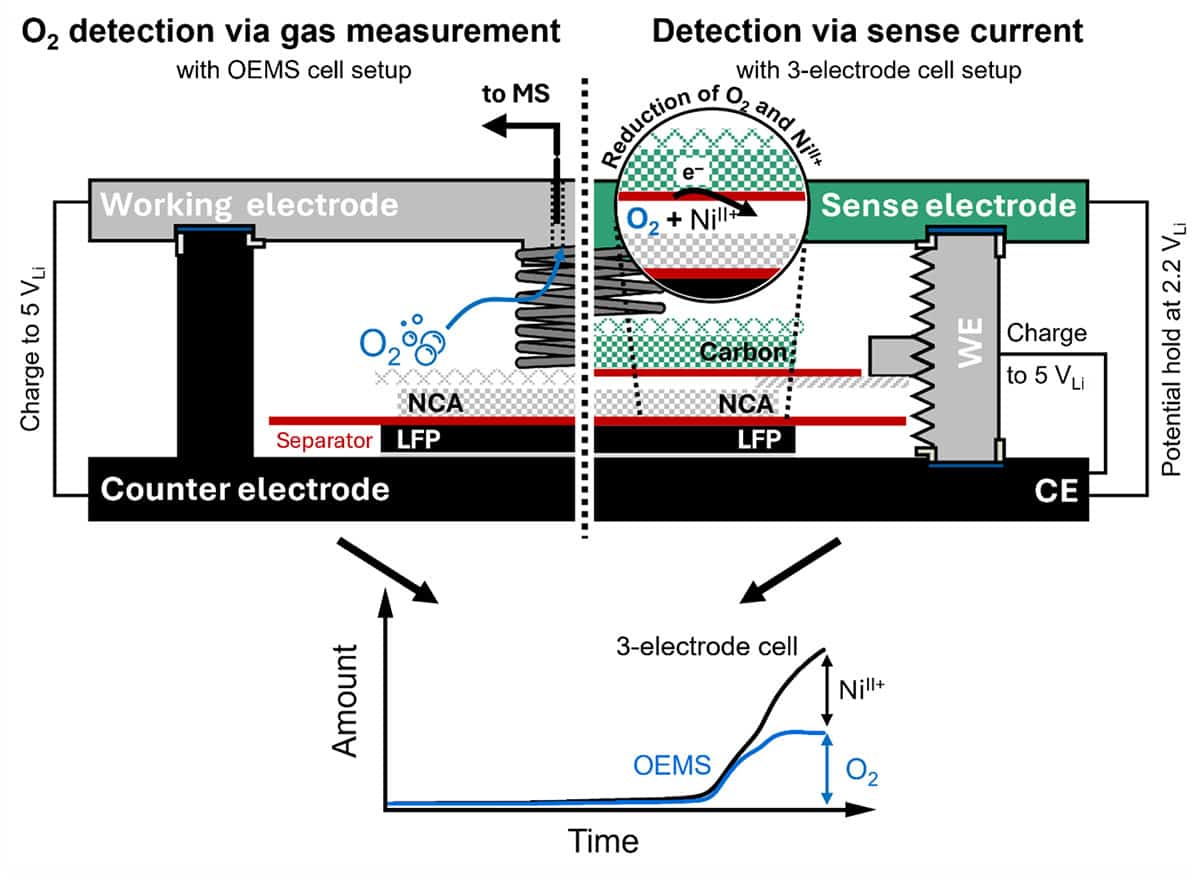
Detecting parasitic side reactions originating both from the cathode active materials (CAMs) and the electrolyte is paramount for developing more stable cell chemistries for Li-ion batteries. This talk will present a method for the qualitative analysis of oxidative electrolyte oxidation, as well as the quantification of released lattice oxygen and transition metal ions (TM ions) from the CAM. It is based on a 3-electrode cell design employing a Vulcan carbon-based sense electrode (SE) that is held at a controlled voltage against a partially delithiated lithium iron phosphate (LFP) counter electrode (CE). At this SE, reductive currents can be measured while polarizing a CAM or carbon working electrode (WE) against the same LFP CE. In voltametric scans, we show how the SE potential can be selected to specifically detect a given side reaction during CAM charge/discharge, allowing, e.g., to discriminate between lattice oxygen, protons, and dissolved TMs. Furthermore, it is shown via On-line Electrochemical Mass Spectrometry (OEMS) that O2 reduction in the here-used LP47 electrolyte consumes ~2.3 electrons/O2. Using this value, the lattice oxygen release deduced from the 3-electrode setup upon charging of the NCA WE is in good agreement with OEMS measurements up to NCA potentials >4.65 VLi. At higher potentials, the contributions from the reduction of TM ions can be quantified by comparing the integrated SE current with the O2 evolution from OEMS
Lennart Reuter is a PhD student in the group of Prof Hubert A Gasteiger at the Chair of Technical Electrochemistry at TUM. His research focused on the interfacial processes in lithium-ion batteries that govern calendar life, cycle stability, and rate capability. He advanced the on-line electrochemical mass spectrometry (OEMS) technique to investigate gas evolution mechanisms from interfacial side reactions at the cathode and anode. His work also explored how SEI formation and graphite structural changes affect Li⁺ transport, using impedance spectroscopy and complementary analysis techniques.
Leonhard J Reinschluessel
Leonhard J Reinschluessel is currently a PhD candidate at at the Chair of Technical Electrochemistry in the Gasteiger research group at the Technical University of Munich (TUM). His current work encompasses an in-depth understanding of the complex interplay of cathode- and electrolyte degradation mechanisms in lithium-ion batteries using operando lab-based and synchrotron techniques. He received his MSc in chemistry from TUM, where he investigated the mitigation of aging of FeNC-based cathode catalyst layers in PEMFCs in his thesis at the Gasteiger group Electrochemistry at TUM. His research focused on the interfacial processes in lithium-ion batteries that govern calendar life, cycle stability, and rate capability. He advanced the on-line electrochemical mass spectrometry (OEMS) technique to investigate gas evolution mechanisms from interfacial side reactions at the cathode and anode. His work also explored how SEI formation and graphite structural changes affect Li⁺ transport, using impedance spectroscopy and complementary analysis techniques.