Serotonin sensor diagnoses depression

Using polymers that specifically bind serotonin, Patrick Wagner and co-workers have built heat-transfer sensors designed to diagnose depression. These small disposable devices can differentiate normal from pathological levels of serotonin, providing a cheaper method than the currently used high-pressure liquid chromatography (HPLC), which needs extensive equipment, trained staff and a laboratory environment. In contrast, the new sensor enables point-of-care testing in clinics and hospitals (Sensors 17 2701).

How it works
The sensor uses molecular imprinted polymers that specifically bind serotonin and are located at a solid-liquid interface. Whether or not serotonin is bound to the polymer changes its heat transfer properties. A copper block serves as the solid phase and is heated; the temperature is then measured in the liquid phase – the blood sample. The blood is heated less efficiently when the serotonin-bound polymer blocks heat transfer, thus providing a measure of serotonin levels. Wagner and his colleagues at the Hasselt University in Belgium were the first to use these heat-transfer sensors on biological samples.

The researchers made the synthetic receptors by synthesizing the polymer in the presence of serotonin and consequently removing the serotonin. The polymer was then ground to achieve maximum surface area and stamped onto an aluminium surface where it can bind serotonin from blood samples.

To increase its accuracy, the sensor has four sensing chambers that measure in parallel. To achieve stable readouts, an equilibration phase is needed both before and after sample addition. Nevertheless, the entire measurement can be performed within 15 to 20 min.

Serotonin imbalance
Serotonin is a chemical that nerve cells use to transmit signals and is involved in regulating mood, appetite and sleep. Low levels of serotonin have been linked to depression, the most common form of psychiatric disorder in Europe, which has a life-time prevalence of 15-20%. However, abnormal serotonin levels are also found in other conditions such as irritable bowel syndrome and hypertension.

But serotonin is not the only chemical that nerve cells use for signalling, and these other signalling molecules can look very similar to serotonin. To determine whether the new sensor can distinguish serotonin from other signalling chemicals, Wagner and his team tested it using histamine, a neurotransmitter that coordinates immune responses and nerve cells in the brain. Blood spiked with histamine instead of serotonin gave a baseline similar to that of a sensor without functioning receptors, indicating that the receptor is specific to serotonin and can distinguish it from other signalling chemicals.

Highlights of nanotechweb.org 2017 – the movie

Looking back on the year, which brought the first single-molecule car race, several advances to combat drug resistance and a wireless nanogenerator among other research highlights, as well as a number of exciting developments at IOP Publishing – we take you through the highlights of 2017.

Humidity is the real heatwave threat

It’s not just the extreme temperature a heatwave brings that’s the problem, but the humidity from its burden of water vapour.

When the mercury climbs to extreme levels, it’s the dangerous humidity produced by heat reacting with water-sodden air that can spell death, not just the heat alone.

US researchers have warned yet again of the need to beware the risks of this combination. With fierce heat waves expected to become more common as the climate warms, they say humidity can greatly intensify the effects of the heat by itself.

They report in the journal Environmental Research Letters that during this century the drastic effects of high humidity in many areas will increase significantly. At times, they may overtake people’s ability to work outdoors or, in some cases, even to survive.

Health and economies would suffer, especially in regions where people work outside and have little access to air conditioning. Potentially affected regions include large swathes of the already muggy south-eastern United States; the Amazon; western and central Africa; southern areas of the Middle East, including the Arabian peninsula; northern India; and eastern China.

“The conditions we’re talking about basically never occur now – people in most places have never experienced them”, said lead author Ethan Coffel, a graduate student at Columbia University’s Lamont-Doherty Earth Observatory. “But they’re projected to occur close to the end of the century.”

The warming climate is projected to make many now-dry areas dryer, in part by changing precipitation patterns. But, as global temperatures rise, the atmosphere can hold more water vapour. That means chronically humid areas may only get more humid.

Muggy heat is more oppressive than the “dry” kind, because humans and other mammals cool down by sweating; sweat evaporates off the skin into the air, taking the excess heat with it. That works well in a desert. But when the air is already laden with moisture, evaporation off the skin slows down, and eventually becomes impossible.

When this cooling process stops, a creature’s core body temperature rises beyond the narrow tolerable range. Without air conditioning, organs strain and then start to fail, leading to lethargy, sickness and possibly death.

Using global climate models, the researchers mapped current and projected future “wet-bulb” temperatures, which reflect the combined effects of heat and humidity (the measurement is made by draping a water-saturated cloth over the bulb of a conventional thermometer; it does not correspond directly to air temperature alone).

The study found that by the 2070s, high wet-bulb readings that now occur perhaps only once a year could stretch to 100 to 250 days annually in some parts of the tropics. In the south-east US, wet-bulb temperatures now sometimes reach 29 or 30°C; by the 2070s or 2080s, such weather could occur 25 to 40 days each year, say the researchers.

Laboratory experiments have shown wet-bulb readings of 32°C are the threshold beyond which many people would have trouble functioning outside. This level is rarely reached anywhere today.

Risk to India

But the study projects that in 50 or 60 years the limit could be reached one or two days a year in the US southeast, and three to five days in parts of South America, Africa, India and China. Worldwide, hundreds of millions of people would suffer.

The hardest-hit area in terms of human impact, the researchers say, will probably be densely populated north-eastern India.

“Lots of people would crumble well before you reach wet-bulb temperatures of 32°C, or anything close”, said co-author Radley Horton, a climate scientist at Lamont-Doherty. “They’d run into terrible problems.”

The study projects that some parts of the southern Middle East and northern India may even hit 35 wet-bulb degrees Celsius by late this century – equal to the human skin temperature, and the theoretical limit at which people will die within hours without artificial cooling.

Using a related combined heat/humidity measure, the so-called heat index, this would be the equivalent of nearly 170° Fahrenheit of “dry” heat. But the heat index, invented in the 1970s to measure the real feel of moist summer weather, actually ends at 136; anything above that is literally off the chart.

Avoiding the worst

On the bright side, the paper says that if nations can substantially cut greenhouse gas emissions in the next few decades, the worst effects could be avoided.

Only a few weather events like those projected have ever been recorded. The most recent was in Iran’s Bandar Mahshahr in July 2015. That day the “dry” air temperature alone was 115°; saturated with moisture, the air’s wet bulb reading neared the 35 °C fatal limit, translating to a heat index of 165°F.

Bandar Mahshahr’s infrastructure is good and electricity cheap, so residents adapted by staying in air-conditioned buildings and vehicles, and showering after brief excursions outside. But this is not an option in other vulnerable places, where many people cannot afford such remedies.

“It’s not just about the heat, or the number of people. It’s about how many people are poor, how many are old, who has to go outside to work, who has air conditioning”, said the study co-author Alex deSherbinin of Columbia’s Center for International Earth Science Information Network (CIESIN).

He said that even if the weather does not kill people outright or stop all activity, the necessity of working on farms or elsewhere outdoors in such conditions can bring chronic kidney problems and other damaging health effects.

Previous warnings

Other researchers have sounded the alarm about the risks dangerous humidity levels can pose. A 2015 study said parts of the Gulf region, where Bandar Mahshahr lies, could, on present trends, become uninhabitable for humans by 2100.

The following year another study extended the warning to include North Africa. Earlier this year sports chiefs even reported that humidity could affect the behaviour of cricket balls.

Climate scientist Steven Sherwood of the University of New South Wales, who proposed the 35°C survivability limit, said he was sceptical that this threshold could be reached as soon as the researchers say. All the same, he said, “the basic point stands.”

Unless greenhouse emissions are cut, “we move toward a world where heat stress is a vastly greater problem than it has been in the rest of human history. The effects will fall hardest on hot and humid regions.” – Climate News Network

• This report was first published in Climate News Network

A ‘gross’ miscalculation

The International Energy Agency (IEA) “under-reports (the) contribution solar and wind by a factor of three” compared to fossil fuels, according to a recent report. I and others have been pointing this out regularly, but it’s good to see this methodological anomaly (if that’s what it is) exposed and explored in more detail in an article by Erik Sauar.

His rendition of it is a little complex and convoluted in places, but the basic point is that the IEA makes use of primary energy data, which, for fossil fuels, are relatively straight forward: the tonnes of fuel used by power plants, usually rendered as million tonnes of oil (mtoe) to make it comparable in energy content terms. However, for renewables, since you can’t really measure the input raw energy, for wind and solar they just use the output energy to represent the primary mtoe figure. But strictly, to make sensible comparisons (e.g. of the relative carbon emission implications), a way to infer the primary energy for these renewables is needed. One way is to work out the amount of fossil fuel that would have to be used to produce the same energy output. Standard steam-raising fossil plants are very inefficient, typically wasting two thirds of the primary energy fed in to them, rejected as heat into the environment. So you would need about three times more fossil energy input to get the same output as from a similarly rated renewable generator. Hence Sauar’s claim that some renewables are in effect de-rated unfairly by around a third.

Sauar notes that something like the “grossing up” he thinks is necessary is actually done in the case of biomass and nuclear. He says the IEA has chosen “to only measure the electricity produced for these two energy sources, and thereafter multiply it with 3.0 for biomass and 3.03 for nuclear energy”, to get a primary energy figure. That may make sense, even though for biomass, its output is already subject to the aforementioned losses when burnt for power production. But presumably some adjustment would be needed to take account of the lower energy content/tonne compared with oil. Sauar, however, does not change the figure for biomass in his correction of the IEA data, and he also leaves the IEA nuclear primary energy unchanged, just adjusting wind and solar. However, his take on wind and solar seems slightly odd – he says solar needs a 5 times mark-up, wind just 2.3 times, since he includes losses in their conversion processes. That’s debatable. Their “internal” technical efficiencies (which he puts at 20% and 50% respectively) are surely a separate issue, and in any case their load factors vary by location and over time. It seems odd to try to track back to some pre-conversion stage “virtual” renewable energy input and present that as the primary energy.

It makes more sense to work on the final actual output, however derived, suitably grossed up to mtoe, as if it was delivered by a fossil plant, if you want a primary energy figure. He says that BP now does that and uses a 2.8× conversion figure. If you look at the company’s recent statistical review, it says the data for hydro, wind, geothermal, solar, biomass and waste, and also nuclear, are “converted on the basis of thermal equivalence assuming 38% conversion efficiency in a modern thermal power station”. So it seems BP is grossing up renewables properly, including biomass, and also nuclear.

Even so, there’s still room for methodological disputes. Indeed, evidently in response to Sauar’s article, the IEA produced an analysis, which noted that “The IEA had at a point used the ‘partial substitution method’, based on the assumption that hydro, wind, solar electricity had displaced thermal generation. This involved using an average thermal conversion efficiency (e.g. 36%) to back-compute their corresponding ‘primary energy equivalent’. This made their shares in the primary energy supply greater (around three times as much). However, the principle was abandoned as it relied on arbitrary conversion factors and was creating some transformation losses inside the energy balance that did not really exist.”

Nevertheless, their version of the primary energy data is still problematic. Maybe it’s best to use output data. That’s what Michael Liebreich from Bloomberg New Energy Finance said in response to Sauar’s article: “Using primary energy to compare the contribution of different energy sources, rather than final energy, needs to be consigned to the dustbin. It rewards the least efficient technologies, making them seem irreplaceable, at the expense of modern renewables.”

The debate goes on, although there does seem to be some confusion and the need for a standardized approach. See Energy Matters’ take on it, based on their uncertainties about the EU’s handling of data.

We do need to sort this all out. Does “grossing up” really make sense, especially for steam-raising nuclear? Does that give us a useful number?  It would get even harder with hybrid systems: how would hybrid solar thermal PVT fare on this analysis? And nuclear, biomass or geothermal combined heat and power? Which bit of the output would be grossed up and which bit left alone? You can see why final megawatt-hour output is maybe a more solid metric. It tells us what is actually available, always assuming the data have been collected live and not just inferred from the megawatt capacity and assumptions about load factors and likely plant availability.

There are plenty of other potential energy data issues that also need addressing. For example, it’s vital that a clear distinction is made between energy and electricity. Too often, in media presentations and even company PR, contributions are cited as if they are a percentage of “energy” when it’s actually only of electricity. For example, it is sometimes claimed that the Hinkley, Moorside or some other nuclear plant will supply “7% of UK energy”, when in fact it’s only 7% of electricity – the energy contribution would be more like 2%, depending on how you do the sums: are we talking about ex-plant output, or (somewhat less, after transmission) final electricity use?  This type of error is regularly pointed out.

It doesn’t help that the term “power” is often used to mean electricity (and we talk of electric power, power outputs, power plants, and even combined heat and power) when what is meant is electricity. In any case “power” and “energy” are different things: power is the generation or consumption capacity of a device, measured in watts (or multiples of watts), the energy they then supply or use is a time based-measure, calculated in watt-hours (and multiples). So a 1 kW power-rated electric fire run for an hour uses 1 kWh of electrical energy, while a 1 MW-rated wind turbine, if the wind was such that it could run at its full power rating for an hour, would generate 1 MWh of electrical energy. Simple really, but even the best of us occasionally use “power” as shorthand for electricity.

And here’s another potential screw up: Blockchain and all that

The Bitcoin e-banking system uses block chain electronic encryption exchanges to transfer credits and its booming. The same idea is now being touted for wider use.

It has issues and then some – it’s very energy intensive. Also see this analysis and this review. There are maybe better ideas. Though is this really sensible as a fix for it?

US candidates on science policy, your satellite idea could bag a share in £50,000

By Hamish Johnston

The Science Debate organization sent out questions about science policy to candidates in the 2018 US elections and the answers are in (at least some of them). Prospective US representatives, senators and state governors were queried on 10 topics ranging from climate change to the importance of science to American prosperity.

James Henry, a Democratic Party candidate in Florida, pointed out: “If you look at your monthly credit card statement and remember the kinds of products and services you spent your money on recently, many of the items purchased probably did not even exist 10 or 20 years ago.” This, he added, is why “It is critical that the government encourage a proactive approach to technology”.

“It is foolish to deny the overwhelming scientific evidence for climate change,” said Elizabeth Moro, who is a Democratic Party candidate in Pennsylvania. “We need leaders who aren’t afraid to stand up for science and for our future and the futures of generations to come,” she added.

There is an interactive map of the US where you can click on a state and see if its candidates have responded. As far as I can tell, only a handful of candidates have submitted answers – and not surprisingly, the responses I have seen are all positive about science. But hopefully there will be more answers before the elections in November.


Staying on the economic and societal relevance of science and technology, the UK Space Agency is offering young people help with developing new ideas about how satellites could improve life on Earth.  And even better, folks who come up with really good ideas could share in a £50,000 prize. If you have a brilliant idea, check out the above video.

Supercooled water could exist in two liquid phases

Illustration showing fluctuations between regions of two different local structures of water

Water could exist in two different liquid phases with different densities. That is the conclusion of researchers in Sweden, Japan and Korea, who have used ultrafast X-ray scattering to measure the properties of supercooled water droplets.

Despite being the most ubiquitous and important liquid on Earth, water is a deeply puzzling substance with physical properties that deviate significantly from those of an idealized liquid. Several theories have been advanced to account for some of water’s idiosyncrasies, but experimental data have been lacking.

Solid ice is the most stable phase of water below 0° C, but the liquid phase remains metastable at sub-zero temperatures. Under normal circumstances, impurities such as dust particles provide nuclei around which ice crystals can form, so freezing occurs quickly. In the laboratory, however, it is relatively easy to supercool liquid water to well below 0° C by removing impurities. As the temperature goes down further, however, molecular motion slows and, below around -40° C, water molecules begin to form crystals around one another, allowing even pure water to crystallize very rapidly.

“No man’s land”

Many theories about liquid water predict a phase transition between a high-density liquid and a low-density liquid at low temperatures. However, this is expected to occur at temperatures and pressures deep inside the so-called “no man’s land” of the water phase diagram where experiments are very difficult to do.

In the new research, Anders Nilsson at Stockholm University and colleagues evaporatively cooled micrometre-scale water droplets by dispensing them into a vacuum. The droplets are then struck by femtosecond X-ray laser pulses, which determine the molecular structure of the water. The temperature that each droplet has reached when it is analyzed is determined by the distance that the droplet travels in the vacuum before it is struck by the X-ray pulse.

Ice crystals formed in many of the droplets, but the researchers identified these from their X-ray diffraction patterns and excluded such droplets from the analysis. By studying the diffraction patterns of the pure liquid droplets, the researchers measured how their compressibility varied with temperature, finding a maximum at around -44° C. A fluid becomes squishier when it is in fluctuating equilibrium between high-density and low-density phases. This is because an increase in pressure can be accommodated by some of the substance transforming from the low-density phase to the high-density phase. The researchers believe this compressibility maximum occurs around the crossover point, where liquid water comprises roughly equal proportions of high and low-density local structures.

At low pressures, this phase transition is not thought to be sharp. Instead, there should be tiny fluctuating regions of one phase within a much larger region of the other phase. If this model is correct, it could explain water’s anomalous properties under ambient conditions because, although water would mainly be in the high-density phase, there would be tiny, fluctuating bubbles of low-density liquid constantly moving around inside it.

Milk, oil and water

By fitting their experimental data to a theoretical model using molecular dynamics simulations, the researchers calculated that, at higher pressures, the crossover point between the two liquid phases would reduce in temperature. The length scale of the density fluctuations would also increase, reaching a “critical point” at a pressure of about 800 atm. “There the liquid would look like milk, because the fluctuations would have reached such a length scale that they would scatter visible light,” says Nilsson. At still higher pressures and lower temperatures, the researchers predict, the high and low-density phases would separate completely so that, at a particular, pressure-dependent temperature, “you would have two different liquids in a glass of water separated with a phase boundary – just like oil and water.”

Paola Gallo of the University of Roma Tre in Italy is impressed with the result. “This group succeeded in going beyond the limit of supercooling obtained before,” she says. “That means that in future we can go even further. There are fields in which it’s important to avoid crystallization: one of these, for example, is cryopreservation. In these cases, for example, solution can be of help, so knowing what is the exact density of water and what is the exact structure water assumes in the supercooled phase is very important.”

Alan Soper of the UK’s Rutherford Appleton Laboratory is intrigued but more sceptical. He notes that the inherent difficulty of measuring the temperature of the droplets makes drawing detailed conclusions difficult, and says the increase in compressibility the researchers record is tiny: “It’s just a very small increase in the scattering and it goes through some sort of maximum… It’s just as likely that it’s just going into the phase where it’s about to crystallize and the molecules are rearranging so they can form the crystal,” he says. “They’ve clearly seen something and it’s very interesting,” he concludes. “But what’s actually causing it is probably something we don’t have a straightforward answer to.”

The research is described in Science.

Stanene grows on silver

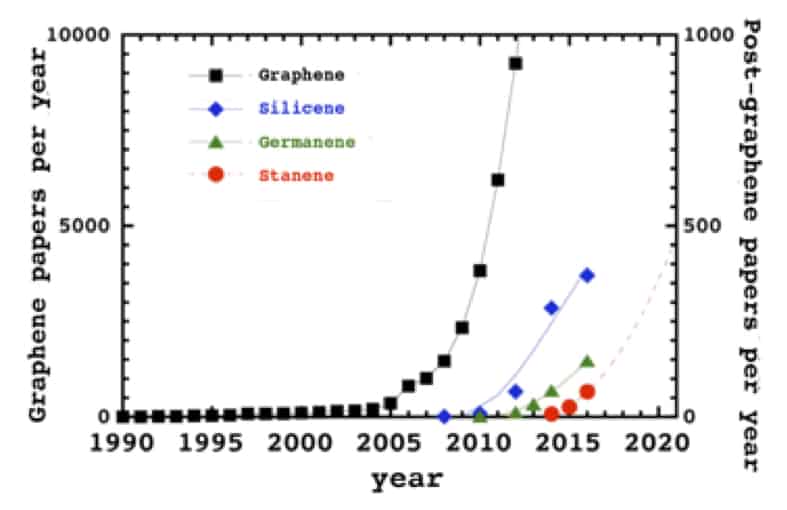
“Post-graphene” 2D materials are creating a flurry of interest in the research world at the moment because they are expected to have new and interesting electronics properties that might be exploited in next-generation devices. A team in Japan, Germany, Spain and France has now succeeded in experimentally synthesizing one such material, stanene, on a silver (111) substrate for the first time. The material, which is the tin analogue of graphene and the heaviest of its cousins, has strong spin-orbital coupling and is expected to be a robust 2D topological insulator with the quantum Hall spin effect, even above room temperature. These properties make it promising for nanoelectronics, spintronics and potential quantum computing applications.

In the last few years, researchers have made 2D materials like silicene, germanene, phosphorene and borophene on Ag(111), Au (111) and ZrB2(0001) substrates. Recent calculations showed that an Ag(111) surface could also be ideal for growing large-area high-quality monolayer stanene. A team led by Junji Yuhara of Nagoya University has now proved that this is indeed possible.

The researchers initially tried to prepare a stanene sheet directly onto a bulk-terminated Ag(111) but they found that the tin atoms chemically react with clean Ag(111) and form a 2D Ag2Sn surface alloy. They turned this problem to their advantage, however, when they discovered (thanks to both DFT calculations and experiments) that a stanene sheet could actually be synthesized onto the 2D Ag2Sn alloy.

Publications per year for graphene and post-graphene materials

“In fact, the Ag2Sn alloy appears to be one of the best substrates to form planar stanene thanks to its chemical and physical properties,” explains Yuhara. “It is typically chemically inert to stanene and there is perfect lattice matching between the planar stanene and the surface alloy.”

The researchers determined the crystalline structure of the stanene using scanning tunnelling microscopy, which is a highly surface-sensitive tool with a depth resolution of less than 0.01 nanometres (10 picometres). They found that the height of the Sn atoms in the stanene sheet varies by less than 5 pm and that the 2D material is also perfectly crystalline on the large scale. They backed up these findings with first-principles simulations of how 2D stanene behaves on an ordered Ag2Sn alloy, as well as with other experimental techniques like high-resolution synchrotron radiation photoemission spectroscopy.

Compatible with silicon technology

“As mentioned, stanene is the heaviest elemental cousin of graphene and thanks to its strong orbital-coupling and the fact that it is expected to be a robust 2D topological insulator, it might be ideal for spintronics applications and for making topological superconductors,” Yuhara tells nanotechweb.org. “And, last but not least, it is compatible with silicon technology, so stanene field-effect transistors might possibly be made using the same procedures used to realize the first silicene FETs.”

The team, which includes researchers from the Aichi Synchrotron Radiation Center, the Universidad del Pais Vasco in Bizkaia, the Max Planck Institute for the Structure and Dynamics and Matter in Hamburg and Aix-Marseille University, say that it is now busy characterizing the edge states in stanene. “We are also looking at how to detach the material we have made from its substrate so that we can characterize its electronic properties,” says Yuhara. “We will then be making plumbene, graphene’s lead cousin.”

The research is detailed in 2D Mater. 5 025002.

Lithium niobate makes ultra-high-Q resonators

Researchers at Harvard University in the US have made the first ultra-high-quality micro-ring and racetrack resonators from lithium niobate. The new devices, which consist of plasma-etched subwavelength waveguides that can propagate light across a metre-length path while losing only about half their optical power, have quality factors of up to 107. They might be used to make ultra-efficient integrated photonics circuits, in quantum photonics and optical communications.

Lithium niobate is used in a wide range of optical and microwave technologies thanks to its unique electro-optical properties that allow it to efficiently transform electronic signals into optical ones. Lithium niobate modulators, for example, are the workhorse of modern telecommunications and convert electronic data into optical information in fibre-optic cables.

There is a problem, however, with this material in that it is difficult to make high-quality small-scale devices out of it, which means that on-chip applications are simply not possible.

Plasma etching

A team of researchers led by Marko Loncar has now succeeded in overcoming this problem by fabricating ultra-high-Q lithium niobate micro-ring and racetrack resonators (with ultra-low loss and high optical confinement) for the first time by plasma etching these devices.

Researchers normally make optical microstructures using chemical or mechanical etching techniques. Lithium niobate is inert, however, so it cannot be chemically etched. Mechanical etching is also difficult given the hardness of the material.

Loncar and colleagues used standard Ar+ plasma etching to physically sculpt micro-resonators from lithium niobate films that were 600 nm thick and grown on a 2 micron-thick SiO2 wafer. The researchers had already successfully used this technique on diamond films in the past so knew that it worked for such hard materials. They etched a total of 350 nm of lithium niobate using a bias power of 112 W, leaving behind a 250 nm-thin lithium niobate slab. The integrated waveguide-coupled micro-ring and racetrack resonators they made have a bending radius of 80 microns and various “straight arm” lengths and waveguide widths.

Subwavelength waveguides propagate light across a metre-length path

The team measured the optical Q-factors of its devices using a tuneable telecom external cavity diode laser and found that they have propagation losses of less than 3 dB/m. This means that they can propagate light across a metre-length path while only losing about half their optical power. To compare, previous lithium niobate devices lost more than 99% over the same distance.

This new nanophotonic platform is a viable step forward for lithium niobate, say team members Mian Zhang and Cheng Wang. The fact that it has ultralow losses, high optical confinement and a tight bending radius and could be integrated with microwave electrodes bodes well for electro-optics and nonlinear optical systems. This opens up a wide range of applications, including ultralow-loss quantum photonics, coherent microwave-to-optical conversion and active topological photonics.

Since the lithium niobate device layer sits atop a standard silicon wafer, our platform might thus also be integrated with many existing photonics technologies, they add.

The LN micro-ring and racetrack resonators are detailed in Optica 10.1364/OPTICA.4.001536.

‘Lab on a CD’ generates spheroid 3D cell cultures

In basic and applied biology research, such as investigations of stem cells and drug screening, spheroid cell cultures are valuable, providing a more realistic test environment than the 2D cultures conventionally used. However, existing techniques for making cell spheroids lack reproducibility, have limited production yields and performance can vary with cell type.

Tackling this, researchers in Korea have developed a technique that generates high yields of spheroid cultures with reproducible shapes and sizes using “lab-on-a-CD” technology, also known as centrifugal microfluidics. The approach involves pumping cells outwards from the centre of a small disc into wells where they aggregate into spheroids. The researchers also used the technique to generate co-cultures containing two cell types in specific arrangements for the first time (Biofabrication 9 045006).

Chung-Ang University researchers

“The rapid, reproducible formation of spheroids whose size we can control can contribute to accelerate biology and pharmacy research, especially cancer drug discovery,” said co-author Jung Chan Lee, who carried out the work with colleagues at Seoul National University and collaborators at Chung-Ang University, also in Seoul.

Spheroid creation

Cell spheroid manufacture is the first application of the well-established lab-on-a-CD technology in cell culture research. Already used for a variety of biomedical diagnostic tests including blood analysis and immunoassays, instrumentation is compact, relatively inexpensive and easy to use.

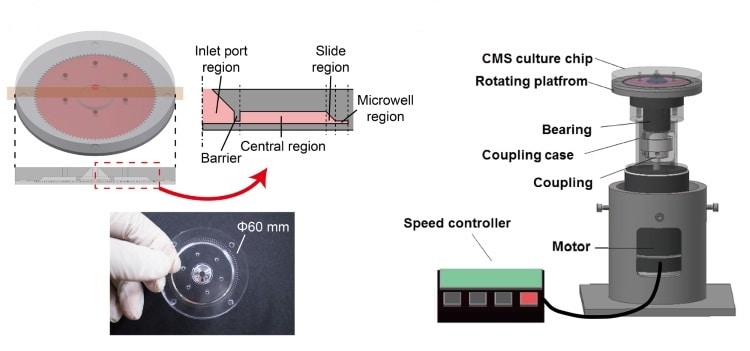
The new system comprises a 6-cm moulded silicone polymer disk on top of a rotating platform driven by a DC motor. The disk contains 100 radial channels measuring 1.4 x 1.5 x 16 mm, each of which feeds a cylindrical microwell 0.4 mm in diameter and 0.4 mm high.

Lab-on-a-CD generates 3D cell cultures

Suspensions of cells are injected through a port in the disk’s centre. Rotatable over a range of speeds, the platform subjects the cells to hypergravity with G-forces of 1-521 G. The centrifugal forces not only drive the cells into the wells and aggregate them into spheroids, but can also encourage cell proliferation.

Lee and co-authors used their system to create cell mono-cultures and co-cultures. They created batches of 100 spheroids at a time, measuring their shape and size using time lapse photography and fluorescence images. Cultures of human adipose-derived stem cells (hASC) and human lung fibroblasts (MRC-5) were created using the microfluidic approach and compared with those generated using conventional well plate-based spheroid (WPS) formation.

Overall, the new system performed better than the conventional method. It demonstrated, for example, a 100% production yield, meaning that significantly fewer cells are needed to generate a given number of spheroids.

Various multicellular spheroid formations

Spheroid size was also significantly more consistent using the new technique, but only in spheroids generated at a higher 103 G-Force, suggesting that hypergravity is an important factor. Up to two days following formation, the spheroids were also more uniform in shape than those produced using the conventional method, indicated by smaller standard deviations in sphericity across the batch.

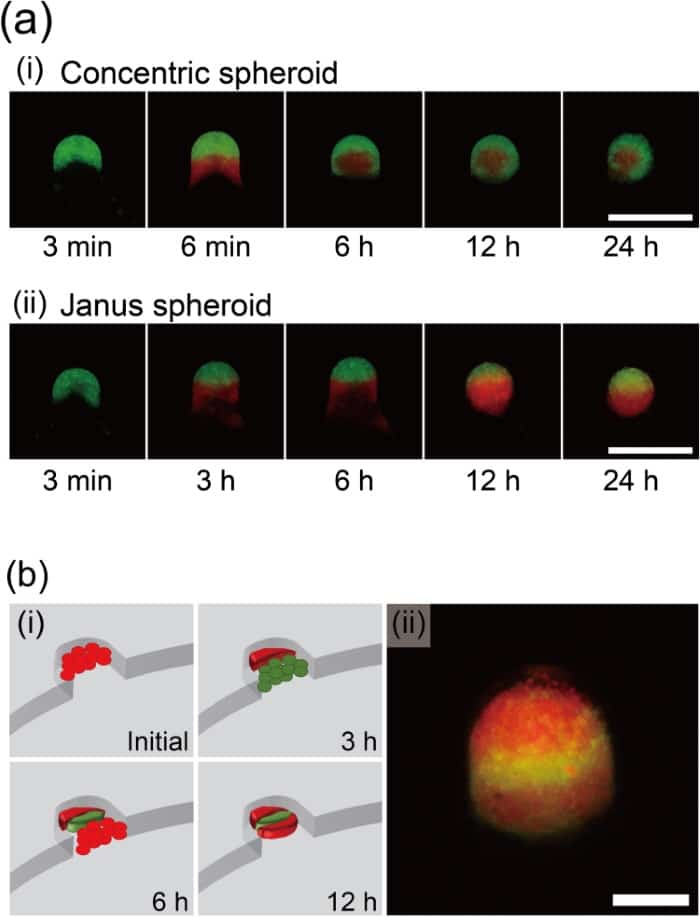
The researchers also successfully generated co-cultures with three spheroid arrangements: a spheroid of stem cells surrounded by a concentric shell of lung fibroblasts, a “Janus” arrangement of two hemispheroids and a sandwich of alternating cell layers. Each arrangement was created by the sequential addition of the different components to the disk at specific time intervals.

The concentric arrangement, for example, was made by injecting a suspension of one cell component, followed by the second three minutes later. At this point, centrifugal forces have driven the first set of cells into a U-shape. The second set of cells settles in this U for the outer layer to close around it.

In ongoing work, the researchers are seeking to further miniaturize their system, said joint first author Jiheum Park of Yale University, who worked on the system at Seoul National University. “One effort is to combine the system with wireless power transfer technology and eliminate the power line, which could be the possible source of incubator contamination,” Park told medicalphysicsweb. The researchers are also investigating the stacking of multiple disks to increase the throughput of the system by up to 100-fold.

Neutrons probe gravity’s inverse square law

A spallation neutron source has been used by physicists in Japan to search for possible violations of the inverse square law of gravity. By scattering neutrons off noble-gas nuclei, the researchers found no evidence of any deviation from the tried and tested formula. However, they could slightly reduce the wiggle room for any non-conventional interactions at distances of less than 0.1 nm, and are confident they can boost the sensitivity of their experiment over the next few months.

According to Newton’s law of universal gravitation, the gravitational force between two objects is proportional to each of their masses and inversely proportional to the square of the distance between them. This relationship can also be derived using general relativity, when the field involved is fairly weak and objects are travelling significantly slower than the speed of light. However, there are many speculative theories – some designed to provide a quantum description of gravity – that predict that the relationship breaks down at small distances.

Physicists have done a wide range of different experiments to look for such a deviation. These include torsion balances, which measure the tiny gravitational attraction between two masses suspended on a fibre and two fixed masses. However, this approach is limited by environmental noise such as seismic vibrations and even the effects of dust particles. As a result such experiments cannot probe gravity at very short distances, with the current limit being about 0.01 mm.

Scattered in all directions

Neutrons, on the other hand, can get down to the nanoscale and beyond. The idea is to fire a beam of neutrons at a gas and record how the neutrons are scattered by the constituent nuclei. In the absence of any new forces modifying gravity at short scales, the neutrons and nuclei essentially only interact via the strong force (neutrons being electrically neutral). But the strong force acts over extremely short distances – roughly the size of the nucleus, about 10–14 m – while the neutrons have a de Broglie wavelength of around 1 nm. The neutrons therefore perceive the nuclei as point sources and as such are scattered equally in all directions.

Any new force, however, would likely extend beyond the nucleus. If its range were comparable to the neutrons’ wavelength then those neutrons would be scattered more frequently in a forward direction than at other angles. Evidence of such a force, should it exist, can therefore be sought by firing in large numbers of neutrons and measuring the distribution of their scattering angles.

In 2008, Valery Nesvizhevsky of the Institut Laue-Langevin in France and colleagues looked for evidence of such forward scattering in data from previous neutron experiments. They ended up empty handed but could place new upper limits on the strength of any new forces, improving on the existing constraints for scales between 1 pm and 5 nm by several orders of magnitude. Those limits were then pushed back by about another order of magnitude two years ago, when Sachio Komamiya at the University of Tokyo and team scattered neutrons off atomic xenon at the HANARO research reactor at the Korean Atomic Energy Research Institute in South Korea.

Time of flight

In the new research, Tamaki Yoshioka of Kyushu University in Japan and colleagues use neutrons from a spallation source at the Japan Proton Accelerator Research Complex (J-PARC) in Tokai, which they fire at samples of xenon and helium. Because the J-PARC neutrons come in pulses, the researchers can easily measure their time of flight, and, from that, work out their velocity and hence their wavelength.

Armed with this information, the team can establish whether any forward scattering is due to a new force or simply caused by neutrons bouncing off larger objects in the gas, such as trace amounts of atmospheric gases. At any given wavelength, both types of scattering would be skewed in the forward direction and so would be indistinguishable from one another. But across a range of wavelengths different patterns would emerge. For atmospheric gases, the scattering angle would simply be proportional to the neutrons’ wavelength. In the case of a new force, on the other hand, the relationship would be more complex because the effective size of the nucleus would itself vary with neutron wavelength.

Reactors can also be used to generate pulses, by “chopping” a neutron beam. But that process severely limits the beam’s intensity. Taking advantage of the superior statistics at J-PARC, Yoshioka and colleagues were able to reduce the upper limit on any new forces below 0.1 nm by about an order of magnitude over the HANARO results – showing that their inherent strength can at most be 1024 times that of gravity’s (gravity being an exceptionally weak force).

Cost-effective search

That is still nowhere near the sensitivity of torsion balance searches at bigger scales – which can get down to the strength of gravity itself. As Nesvizhevsky points out, torsion balances use macroscopic masses with “Avogadro numbers” (1023) of atoms, whereas neutron scattering experiments involve at most a few tens of millions of neutrons. Nevertheless, he believes that the new line of research is well worth pursuing, pointing out that many theories positing additional gravity-like forces “predict forces in this range of observations”. Such experiments, he argues, represent “an extremely cost-effective way of looking for a new fundamental force” when compared to searches carried out in high-energy physics.

Spurred on by the prospect of discovery, Yoshioka and colleagues are currently taking more data. The lead author of a preprint on arXiv describing the latest research, Christopher Haddock of Nagoya University, says that they hope to have new results by the summer. A series of improvements to the experiment, including less scattering from the beam stop, he says, could boost sensitivity to new forces in the sub-nanometre range by up to a further order of magnitude and should also improve existing limits at distances of up to 10 nm.

Copyright © 2026 by IOP Publishing Ltd and individual contributors