Physics-based techniques play a crucial role in helping archaeologists to unravel the history of our ancestors’ lives and reveal previously undiscovered sites without the need to excavate

Archaelogy is becoming increasingly popular, a fact that is reflected by the large number of television programmes and newspaper stories on the subject. Indeed, at the turn of a new millennium there seems to be an obsession with looking at the past. This fascination with discovering how the human character has evolved from pre-human origins until the recent past is understandable. By studying our past, we satisfy our “need to know”. We also gain a greater sense of identity and a perspective from which to view and plan for the future.
Archaeology has developed into a flourishing professional discipline, greatly empowered by science. Indeed “archaeological science” has become a fully recognized multidisciplinary subject with supporting academic journals and university departments. All the major sciences make a contribution, and were this magazine not devoted to physics, we could just as well highlight the role played by molecular biology, botany, geochemistry, physical anthropology and astronomy.
Together with these sciences, physics has played a critical part in dating objects and in discovering new archaeological sites. Radio-isotope dating famously revealed that the Turin Shroud was not a genuine relic from the time of Christ, and the technique continues to shed light on the diet and lifestyle of our ancestors. Meanwhile archaeologists have recently discovered the remains of the largest wooden temple in the UK by detecting tiny variations in the soil’s magnetic field, rather than by digging. Indeed, the impact of such techniques on archaeology should not be underestimated.
Radiocarbon dating
Perhaps the single most important development for archaeology in the 20th century was the discovery of radiometric dating – and of radiocarbon dating in particular. In 1946 Willard Libby of the University of Chicago predicted that all living plants and animals absorb the weakly radioactive carbon-14 isotope from the atmosphere. The process stops when the plant or animal dies, and the carbon-14 nuclei start to decay at a known rate with a half-life of 5730 years. Measurements of the residual radioactivity of a sample thus provide an estimate of its age, provided it is less than 50 000 years old. Libby and his colleagues were the first to estimate the age of archaeological samples in this way, work that earned Libby the Nobel Prize for Chemistry in 1960.
Radiocarbon dating is central to the chronological ordering of events, particularly for prehistoric incidents that occurred before written records began. Indeed, prehistoric events can now be dated to within a few decades if radiocarbon dating is calibrated with data from tree rings and combined with statistical modelling that incorporates stratigraphic information. For instance, we now know that the ditch encircling Stonehenge was dug during the initial phase of construction between 3020-2910 BC. More recently, a combination of radiocarbon dating, mathematical modelling and tree-ring measurements has been used to date the curious timber circle on a Norfolk beach to between April and June 2049 BC precisely.
Other radioactive isotopes with longer half-lives – such as potassium-40 (which decays to argon-40) and uranium-238 (which decays to thorium-230) – extend radiometric dating considerably beyond 50 000 years by measuring the build-up of the decay products. Such methods have proved vital to research into the evolution of early humans and the subsequent colonization of Eurasia over the last 2 million years.
In the late 1970s archaeologists turned to accelerator mass spectrometry (AMS) – a well known technique in nuclear physics – to improve radiocarbon dating. In AMS the sample is first converted to graphite and then bombarded by caesium ions, which causes carbon ions to be released. The carbon ions are then accelerated to high speeds through a magnetic field, which deflects them at an angle that is proportional to their atomic weight. This means that the carbon-14, carbon-13 and carbon-12 isotopes can be detected separately.
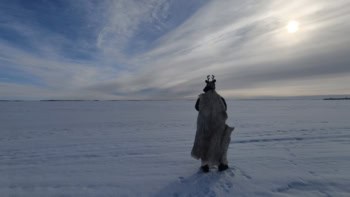
Because individual carbon-14 atoms can be counted, AMS allows much smaller samples to be analysed than was previously possible. This means that tiny items such as individual seeds can be dated. Meanwhile the dating of precious objects can be achieved by removing minute samples without significant or apparent damage. A celebrated application of the technology in 1989 proved that the cloth of the Turin Shroud was medieval and dated from AD 1220-1280, not from the time of Christ (figure 1).
A more prosaic and recent example of AMS dating has shown that scraps of charred organic matter recovered from a pit excavated near Oxford are the earliest examples of charred bread in the UK. Were our ancestors burning toast between 3620-3350 BC? Experiments with even greater sensitivity used AMS to date the individual waxy and oily compounds preserved in prehistoric pots. The results will provide information on both the diet and chronology of our ancestors.
Luminescence, spin and magnetism
Other dating methods that depend indirectly on radioactivity are “luminescence dating” and “electron spin resonance”. Luminescence dating relies on measuring the energy of electrons that are trapped in the crystal structure of the archaeological object. These electrons have been ionized by radiation from radioactive elements in the sample, or its surroundings, and then trapped by defects in the crystal lattice. The electrons are released from the traps by heating the sample – for example when a pot is fired or a flint is burnt – or by exposing it to light. In other words, heating resets the “thermoluminescence clock” to zero. The number of trapped electrons then accumulates according to a rate controlled by the local radiation.
In order to date the object, the sample is first reheated and the electron energy is determined by measuring the light emitted when the electrons recombine with so-called luminescence centres in the crystal. If the local level of radiation from the sample and the environment in which it was buried is known, the proportional build up of thermoluminescence can provide an estimate of the object’s age since the “clock” was last set to zero. Although less precise than radiocarbon dating, thermoluminescence can help date fired materials such as pottery, burnt flint and some industrial products. The method extends well beyond the 50,000 year limit of radiocarbon dating.
In electron spin resonance the presence of trapped energy in a sample is measured from its response to high-frequency electromagnetic radiation in the presence of a magnetic field. This method is useful for materials, such as tooth enamel, that would disintegrate if heated. Electron spin resonance has proved valuable for dating hominid remains in the Middle East in the critical period when Neanderthal and modern man overlapped approximately 100,000 years ago.
As will become more apparent later, the Earth’s magnetic field plays a variety of roles in archaeological science, one of which is “archaeomagnetic dating”. This depends on the imprint of the Earth’s ambient magnetic field in magnetic materials as they cool below their Curie temperature. To date a sample in this way, its orientation in situ must be carefully noted before it is removed. The magnetic field of the sample is then measured with a laboratory magnetometer and compared with known field variations over time.
From time to time the polarity of the Earth’s magnetic field has reversed. The signature of such reversals has been recorded in certain types of sedimentary and volcanic rocks. Palaeomagnetism has been used to date the fossilized remains of the earliest species related to human beings. In 1998, for instance, it was used to date a complete hominid skeleton found at Sterkfontein in South Africa. The measurements revealed that the remains were between 3.22 and 3.58 million years old, owing to their position between layers of rock with known polarity reversals.
Archaeological prospecting
Physics-based methods also play a vital role in helping archaeologists to discover new archaeological sites, and help to define and interpret sites that are not completely understood. Tony Clark, a pioneer of archaeological geophysics, describes the subject as the ability to “see beneath the soil” – surely one of the most cherished desires of archaeologists.
There are, of course, various ways in which archaeological sites can manifest themselves on the ground’s surface. The scattering of artefacts, excavated earth and embankments, and the variation in the depth or colour of crops growing in a field can indicate areas of archaeological interest. These areas can be mapped from the air. However, it is much more of a challenge to penetrate below the surface without resorting to expensive and damaging excavation.
Some of the earliest field archaeologists were aware that the physical properties of the ground could reveal what lay beneath it. By thumping the ground with a crowbar and listening to the variations in resonance, they were able to detect the course of buried ditches on chalk hilltops very effectively. The method was an early precursor of the seismic survey, which ironically has not been used much in subsequent archaeological research.
The geophysical methods that are now routinely used in archaeological prospecting are adapted and scaled-down versions of those applied in geological mapping, mineral exploration, civil engineering and environmental geophysics. These methods may be categorized as either active or passive. Active methods inject energy into the ground, like the crowbar, and measure a response at the surface. They include seismic prospecting, electromagnetic techniques and earth-resistance surveying. Passive methods, such as magnetometry and gravity surveying, simply measure existing physical properties.
Over 50 years ago the first true geophysical technique used to locate archaeological features was the earth-resistance survey, which supplemented information available from aerial photography. Both these remote-sensing techniques rely on changes in the local water content of the subsoil, which appear as variations in the growth of surface vegetation and in the ability of the ground to conduct a small electric current. The presence of archaeological remains close to the surface – such as an impermeable stone wall or a moisture-retentive buried ditch – will alter the water content of the soil in the immediate vicinity. For example, the stone-wall footing will lead to reduced moisture retention that may appear as a parched mark visible from the air during a dry summer. Under suitable conditions, it may also result in a high-resistance anomaly.
Earth-resistance measurements are generally made by inserting a series of electrodes into the soil and injecting a small electric current. This current does not pass through the archaeological features themselves unless they are porous, but it is conducted through mineral ions dissolved in the water held in the soil.
Two practical constraints complicate the measurements in the field. The first is the high contact resistance between the measurement electrodes and the ground surface. This requires the current to be injected through one pair of electrodes and the resulting potential gradient in the soil to be recorded with a second pair of electrodes. The second constraint arises because the ions dissolved in the water in the soil are highly mobile. The measurement current polarizes the ions: positive ions accumulate around the negative electrode, while negative ions build up round the positive electrode. As the polarization increases, the measured potential difference decreases over time, thereby affecting the reliability of the measurement and making it impossible to repeat the results.
This problem is usually overcome by applying a low-frequency AC current that is tuned to disregard spurious electric currents, such as those associated with the mains electricity supply.
The first painstakingly slow earth-resistance measurements were made in the 1940s using a mahogany and brass hand-cranked generator, resplendent of a more genteel age of archaeological geophysics. Instrumentation has advanced rapidly since then and owes much to the development of affordable electronic hand-held resistance meters. These devices were pioneered by Clark and John Martin who both worked in the instrumentation section of the Distillers Company. In 1956 they were inspired by the late Richard Atkinson to apply the latest transistor technology to the development of an archaeological earth-resistance meter.
Modern earth-resistance meters now take full advantage of microprocessor control and are capable of storing the many thousands of readings collected during a survey. Recently a medical imaging technique known as applied potential tomography has been adapted to produce 3-D images of the ground surface by combining measurements from a wide array of electrodes.
When a current is injected into a homogenous medium, it follows an approximately hemispherical path through the ground. By increasing the spacing between the surface electrodes, the resistance measured at the surface will be influenced by current pathways that flow deeper into the ground. These measurements thus indicate the variation of the earth’s resistance as a function of depth. Numerical-reconstruction algorithms are then applied to combine the resulting measurements from each electrode and thereby produce an image of the underlying resistance of the earth.
Due to its reliance on the moisture of the soil, earth-resistance measurements demonstrate a distinct seasonal variability. In general the most successful results are obtained during the spring and autumn months between arid summer conditions and the water-logged depths of winter. A further constraint is the time needed to insert the measurement electrodes over large areas. The electrodes often have to be spaced every 0.5 m to image archaeological anomalies.
A number of systems have been developed to increase the speed with which earth-resistance measurements can be made. These include arrays of spiked metal wheels that act as electrodes as they are pulled across the site, and non-contacting capacitive systems that are being developed by researchers at Iris Instruments in France. Nevertheless, it remains difficult for earth-resistance measurements to match the speed and coverage that magnetic surveys offer.
Geophysics with magnetism
Magnetic surveying is a passive technique that can measure minute variations in the magnitude or gradient of the Earth’s magnetic field. Indeed, it can often detect such variations or “anomalies” over 50 000 times weaker than the ambient field strength. Magnetic surveys were initially used to locate burnt archaeological structures, such as Roman pottery kilns. However, the technique soon demonstrated its sensitivity to other features, such as ditches, rubbish pits and even individual holes into which timber posts were sunk.
The anomalies arise due to variations in the magnetic susceptibility of buried features, which occur when iron-rich minerals in the soil form more strongly ferrimagnetic materials such as magnetite and maghemite. This magnetic enhancement is usually related to burning, although more subtle inorganic and bacterially controlled mechanisms may take place under suitable soil conditions. Such conditions occur naturally in most topsoils, providing a source of magnetically enhanced material that becomes embedded into archaeological features and so produces almost indelible magnetic anomalies.
The first magnetic surveys were conducted in the 1940s using “proton free-precession magnetometers”. The drawback with these instruments was that they had a limited sensitivity and required several seconds at each point to obtain a reading. Currently, the majority of surveys within the UK are conducted using so-called solid-state gradiometers that measure the magnetic gradient between two “flux-gate” sensors separated by 0.5 m on a rigid vertical beam. Each flux-gate sensor consists of two strips of magnetically “soft” Mumetal alloy surrounded by a drive coil. (A magnetically soft material is one in which the direction of magnetization changes easily when an external magnetic field is applied.) The two coils are wound in opposite directions to each other and are fed with a high-frequency sinusoidal signal. The two Mumetal strips are driven through alternating cycles of positive and negative magnetic saturation.
In the absence of any external magnetic field, the positive magnetic field in the first strip will be completely cancelled by the negative field in the second one because the drive coils are counter-wound. However, when an external magnetic field is present, the saturation cycles of the two strips are no longer matched. This results in a beat frequency that is proportional to the magnitude of the external field. The weak signal is detected through an additional pick-up coil wound around the sensor.
These hand-held instruments can record data continuously, allowing several hectares of ground to be covered in a day with many readings per unit area. A further advantage of flux-gate gradiometers is that they are unaffected by variations in the Earth’s magnetic field or by solar electromagnetic storms. This is because the two flux gates experience an identical magnetic disturbance, and thus only more significant local variations in the strength of the Earth’s magnetic field will be detected.
Unlike earth-resistance measurements, magnetic surveys do not exhibit any seasonal variation. However, the success of the technique is often closely related to the geology of the site under investigation. Fortunately, the geological conditions over the majority of the UK are favourable because there is a sufficient supply of iron-rich minerals to ensure that magnetically enhanced topsoils develop. However, some regions contain highly magnetic rocks that may complicate the interpretation of archaeological data.
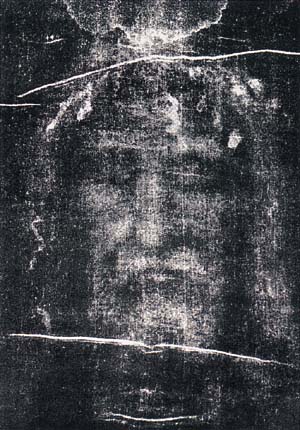
The effectiveness of magnetometer surveying can be illustrated by the recent survey of the Roman city of Cornoviorum, now known as Wroxeter, near Shrewsbury in the UK (figure 2). The 73 hectare survey was completed in 1997 by a team from English Heritage and Geophysical Surveys of Bradford. Some 3 million magnetometer readings were used to create images that have radically improved our knowledge of the fourth largest Roman city in the UK. The city is now all but invisible below pasture fields, but the magnetic survey has revealed roads, buildings and industrial areas with remarkable clarity. Indeed, these images, together with information from aerial photographs and excavations, are helping to re-create the entire cityscape.
The geophysical data have formed the foundation of a series of data sets that can be combined in a “geographic information system” – a powerful computer program that manipulates geographic data to provide a previously unsurpassed level of interpretation and analysis. It has even allowed archaeologists to digitally recreate the appearance of the city.
More recently, alkali-vapour magnetometers have been developed that are 10-100 times more sensitive than the flux-gate detectors used to form the Wroxeter images. These new devices allow archaeologists to detect ever more subtle magnetic anomalies (as small as 0.001 nT) from features that may have previously been invisible.
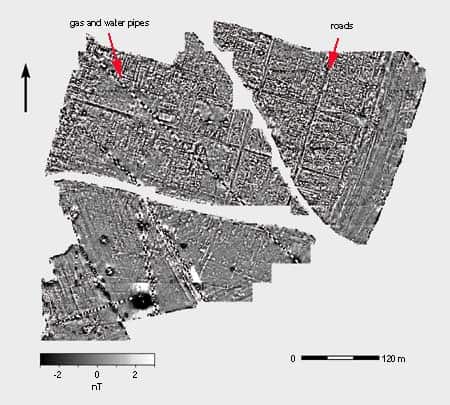
High-sensitivity magnetometry has been used to stunning effect to elaborate the results from a flux-gate gradiometer survey within a stone circle at Stanton Drew, near Bristol in the UK. The magnetic surveys have revealed evidence for a huge timber temple constructed from a series of upright timbers arranged in nine concentric circles (figure 3). Despite magnetic interference from ferrous debris in the soil, the caesium magnetometer revealed a series of discrete positive anomalies related to the holes sunk in the ground to support the individual timber posts. Indeed, anomalies 100 000 times smaller than the Earth’s magnetic field were detected. It is possible that these anomalies are due partly to magnetic biominerals created by bacteria that concentrated in the organic remains of the decaying timbers around 4500 years ago.
Ground-penetrating radar
The ultimate aim of geophysics is to produce a complete 3-D model of buried archaeological features that goes beyond the 2-D plans provided by traditional earth-resistance and magnetic surveys. Although these techniques are capable of providing some depth-related information, the length of time it takes to collect the data can be prohibitive and considerably reduces the area that can be covered. Recently, the combination of ground-penetrating radar and powerful computers to visualize the data has provided a new tool for archaeologists to address this problem.
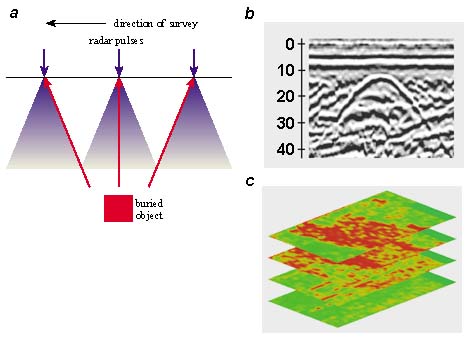
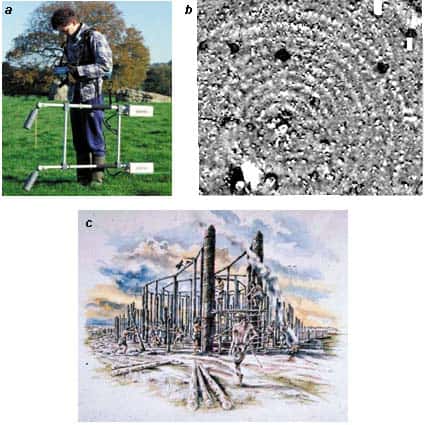
Ground-penetrating radar operates by introducing a short impulse of electromagnetic energy from a surface antenna and recording both the time and magnitude of return signals reflected by dielectric contrasts in the subsoil. A graphical trace is then produced that shows the magnitude of reflection against the time taken for the pulse to travel from the transmitter to the target and back to the receiver (figure 4). This impulse signal covers a wide range of frequencies, but is generally tuned to a centre frequency between 100-1000 MHz, depending on the antenna chosen for the survey. The imaging resolution and penetration depth depend on both the chosen centre frequency and the average dielectric permittivity of the subsoil. Although a high-frequency, short wavelength impulse covers a smaller area, it is capable of resolving smaller objects.
High-speed electronics allow the digital data to be collected every few centimetres along parallel paths and to a depth of several metres. The resulting mass of data is often difficult to interpret because the radar beam spreads out in a cone from the transmitter. This means that the buried object will reflect part of the beam before the antenna passes directly over it. Thus the resulting complex reflected signals may bear little relation to the physical dimensions of the subsurface target.
We can begin to make sense of the data using powerful computer programs. The technique assumes that each reflected wave comes from a point source in the ground and travels towards the surface according to the wave equation. The radar data allows us to build up a 3-D image of the expanded wavefronts. Although it takes a great deal of computational effort, it is possible to “reverse” the wave equation and collapse these expanded wavefronts back to a series of point sources at the correct depths. The process is analogous to running a film of a rising and expanding bubble in reverse to determine the bubble’s source.
Once the data have been analysed, they can be visualized in 2-D “time slices”. Each progressive slice represents reflections from features at an increasing depth, thereby creating a 3-D model of the buried target. We can also enhance any interesting features by combining a series of such time slices in a computer animation. Indeed, this process may reveal an incredible wealth of detail in a buried structure.
Future prospects
Over the last 10 years geophysical prospecting has made great strides. This is due, in part, to a greater recognition that geophysics can provide cost-effective information about important ancient remains. In the UK, where archaeological evaluations are required before any site is developed, the demand for geophysical surveys is on the increase. This mirrors a wider awareness of the importance of archaeological remains and the realization that sites and artefacts are a finite resource to be protected.
Improvements in methodology will continue to increase both the speed with which measurements are made and their surface density. And as the sensitivity of instruments improves, so will the resolution. Many recent developments in this area have been due to the availability of high-power computers for the numerical inversion and analysis of massive amounts of data. Such computing will continue to play a vital role. For example, much of the interpretation of geophysical data is currently a matter of individual experience and even intuition – something that could be improved by employing sophisticated artificial-intelligence algorithms. Future research should focus on new methods that will give us access to the very rich archaeology hidden beneath our cities and buried deep below alluvial deposits.
Physics has played a vital role in calibrating humankind’s passage through time, helping archaeologists to both analyse the physical properties of artefacts and to uncover hitherto undiscovered ancient monuments. There is little doubt that the physical sciences will continue to help unravel the history of ancient technologies and satisfy our desire to understand our ancestors’ lives.