The Gaia spacecraft is conducting the most ambitious and thorough census of our galaxy ever attempted, gathering data on 100,000 stars every hour. With the mission’s first major data release due this month, Gerry Gilmore and Floor van Leeuwen explain how the spacecraft works and assess its likely impact on the field of astrophysics
We all know that space is big. Exactly how big, though, is hard to measure. The distances to stars and other celestial objects are rarely known accurately, or even measured directly. Instead, astrophysicists calculate cosmic distances based on a “ladder” of successive calibration steps. This process begins by using a variety of methods to calibrate the relationship between the period of pulsation and the intrinsic luminosity for certain types of stars, known as Cepheid and Mira variables. Next, these variable stars are used to determine the distances to galaxies in which type Ia supernovae have exploded. Finally, the brightnesses of these type Ia supernovae are corrected to account for their intrinsic diversity.
This complex process inevitably introduces systematic errors. A relatively well-known example is the two “classic” determinations of the cosmological Hubble constant, which were both derived from Hubble Space Telescope data, and which differed by 10%. But the effects of such systematic errors are widespread, touching everything from exoplanet astronomy and stellar evolution to dark-matter dynamics and fundamental physics.
The reason why astronomical distances are so difficult to measure directly can be summed up in one word: parallax. As the Earth travels around the Sun, the position of nearby stars appears to shift relative to more distant background objects. The angle of parallax is defined as the apparent change in line-of-sight direction to an object caused by the changing position of the observer, and basic trigonometry shows that this angle is inversely proportional to the star’s distance from Earth. But because even the nearest stars are (astronomically) far away, their associated parallaxes are tiny. Most amount to less than a few hundred microarcseconds (μas), where 1 μas is equivalent to the thickness of a human hair seen from a distance of 10,000 km.
To measure such small angles, astronomers must make repeated, highly accurate position measurements over a period of several years, in order to separate parallax from a star’s “proper” motion (motion due to its orbit in the galaxy) and from perturbations caused by the gravitational field of an associated companion star and/or planetary system. In 1989 the European Space Agency (ESA) launched a satellite, Hipparcos, to perform such measurements. During its three-year mission, it measured the absolute parallax of more than 30,000 stars, with an accuracy of better than 10%. But in a galaxy that contains 100 billion stars, the Hipparcos measurements could only show us a small part of the picture.
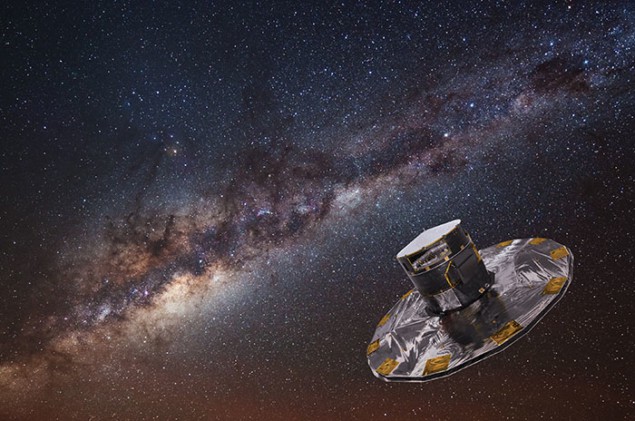
Now, however, the field of precision astrophysics is about to enter a new era. This month marks the first major release of data from ESA’s Gaia mission, a follow-up to Hipparcos that was launched on 19 December 2013 and is now orbiting around the L2 Sun–Earth Lagrangian point, some 1.5 million kilometres from Earth. Gaia’s data-collecting ability is truly astonishing: in one hour of operations, its instruments can take 10 million astrometric measurements and record 300,000 spectra of 100,000 stars. During its five-year sky-scanning mission, Gaia will observe each of its targets around 80 times, enabling scientists to quantify the variability of stars and other light sources; determine their positions and motions (astrometry); and measure their apparent brightness and energy distribution (photometry).
All told, Gaia will make precision distance measurements on some 1.5 billion stars, with an accuracy of up to 10 μas for the brightest among them. The sheer volume of data means that Gaia is set to revolutionize astronomical distance measurement. In doing so, the mission will have broad implications for almost the entire field of astrophysics.
An orbiting optical bench
The Gaia spacecraft is elegantly simple, consisting of a circular optical bench that supports two telescopes. The pair of telescopes is a crucial part of Gaia’s design. With a single telescope, it is only possible to calculate a star’s parallax relative to other stars within that telescope’s field of view (figure 1a). However, with two telescopes that are separated by a (very precisely known) large angle, and that each feed light into a single optical camera, it is possible to measure parallaxes absolutely (figure 1b).
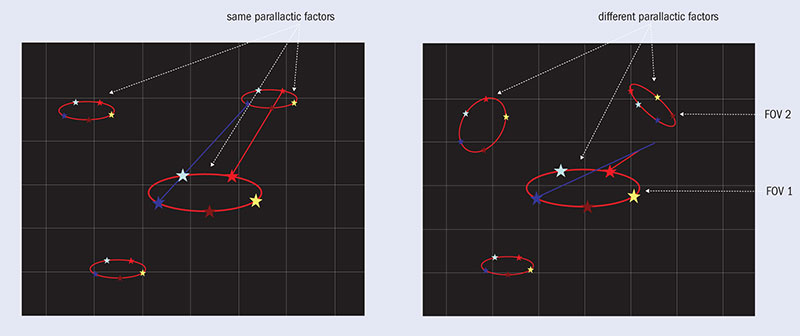
This two-telescope method of measuring parallax was first used on the Hipparcos satellite, but other aspects of Gaia’s instrumentation are novel. Its 0.9 m-long, billion-pixel camera is exceptionally large by spacecraft standards, and its 106 charge-coupled device (CCD) sensors deliver impressive dynamical range, collecting light from objects whose apparent magnitudes range from –1.5 (the bright star Sirius) to 20.7 (more than 5 × 10⁸ times fainter). For each of the 1.5 billion stars Gaia detects, the spacecraft is measuring the broadband optical flux and associated image centroid. This, together with spectrophotometry over the 300–1000 nm range, makes it possible to derive the temperatures and surface gravities for each star, and also to quantify how much cosmic dust is blocking our view of it. A moderate dispersion spectrograph is used to derive radial velocities for the 100 million stars brighter than about magnitude 15.5.
Another innovation is that Gaia’s entire structure is made of silicon carbide (SiC), a compound with a very high strength-to-mass ratio and very low coefficient of thermal expansion. But space is a harsh environment, and the angle between the two telescopes changes as the optical bench and telescope structure react to small temperature variations. By normal standards, the angle variation is tiny: it is equivalent to moving one of the telescope’s primary mirrors by roughly the diameter of a single helium atom. This is, however, “large” by Gaia’s standards – an indication of just how precise this spacecraft has to be.
Other technical challenges include local mechanical adjustments, known as “clanks”, which are caused by local thermal variations. Clanks torque the spacecraft, and are often linked to specific orientations of the satellite, but they are not repetitive enough to predict and so must be accounted for using the data itself. Stray light is also an issue: small threads at the edge of the spacecraft’s solar shield can refract stray sunlight into the telescope, while light from the galactic plane has found a few “unauthorized” ways of getting through the telescope to reach its focal plane. And early in the mission, Gaia experienced a few problems with water condensation on mirrors, which were resolved by occasionally heating the mirrors.
Just getting started
The task of processing Gaia’s data (and dealing with the above-mentioned systematic effects, which add just enough complexity to keep things interesting) falls to a consortium of 450 scientists at six data processing centres: ESAC and Barcelona in Spain; CNES in France; Cambridge, UK; Geneva, Switzerland; and Torino, Italy. This consortium is due to release the first big set of Gaia data on 14 September, in the form of two catalogues: one containing positions and magnitudes for around 1.4 billion stars down to magnitude 20.7; and one containing valuable astrometric data for around two million bright stars.
Before the end of its initial five-year mission (it may be extended for a further five years), Gaia aims to deliver a census of more than a billion stars, providing astrometric, photometric, spectrophotometric and spectroscopic data at unprecedented levels of accuracy, precision and volume. Even in its early stages, it is already proving a success: the spacecraft and data-processing systems are working well, the first “taster” of science data is now public, and there is much, much more to come. The astrometric revolution is truly under way.
Galaxy structure
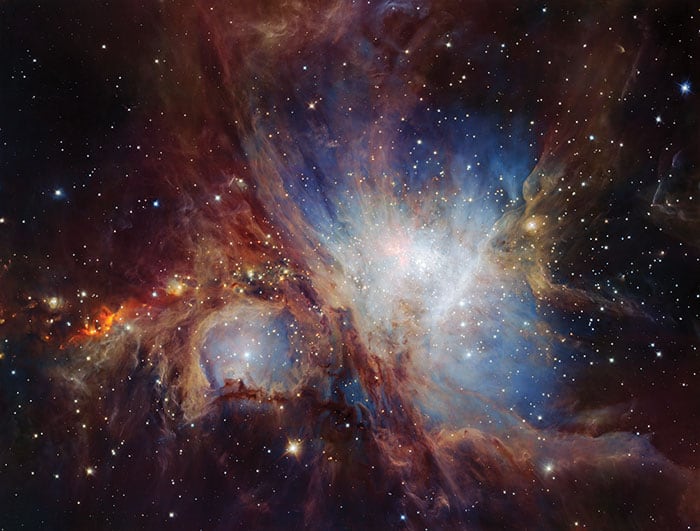
The stars in the Milky Way disc primarily form in small clusters inside larger star-forming regions (such as the Orion nebula) before diffusing away from their origins. During this spatial diffusion, their velocities remained clustered. Hence, if we know their distances and velocities very precisely, we can in effect “turn the clock back” and determine how the diffusion process happened. Many stars in the disc – Gaia will tell us how many – end up being shepherded into “moving groups” of stars that travel together in velocity space and/or coordinate space. Finding and mapping these groups will give us a wealth of information about the large-scale structure and evolution of galactic discs.
Away from the discs, the stars in the Milky Way’s “halo” have (at least) two origins. Some (unknown) fraction formed early on, in situ, in what is now the galaxy. Others formed in small satellite galaxies that were later accreted and dispersed by the galactic tides – a process that continues today. In the outer galaxy, distances are large and timescales are long, so small satellite galaxies are stretched out like a comet tail. Gaia will find these ghostly star streams, and directly recount the assembly history of the outer galaxy.
Perhaps most importantly, the dynamics of these streams is determined by the presence of dark matter – the invisible but gravitationally dominant substance that makes up approximately 27% of the universe’s mass-energy. Gaia’s measurements of stellar kinematics will enable us to determine the 3D distribution of dark matter in our galaxy much more accurately and reliably than is currently known. Such data may even provide clues as to the nature (or natures) of this still-mysterious type of matter.
Exoplanets
Most of the exoplanets that we know about were discovered either photometrically (by measuring the slight dimming that occurs when a planet passes between us and its parent star) or kinematically (by measuring the change in the parent star’s velocity along our line of sight due to the reflex motion induced by the planet). Because Gaia makes highly accurate measurements of stars’ reflex motion in 2D, it is a very sensitive kinematic planet-detector. Simulations show that Gaia can detect planets with a mass equivalent to that of Jupiter (or higher), and there may be as many as 70,000 such planets in orbit around nearby stars. These nearby systems make good targets for detailed follow-up measurements using large ground-based telescopes or special-purpose space observatories.
In addition to its huge numbers, the Gaia exoplanet sample has two other advantages. One is that Gaia’s 2D kinematics measurements give us the information required to calculate an exoplanet’s mass as well as detecting its presence. Even more importantly, since Gaia measures parallaxes for everything nearby, we will know which stars lack massive planets, making it possible to determine how often planetary systems occur around various types of parent star.
Stellar evolution and star clusters
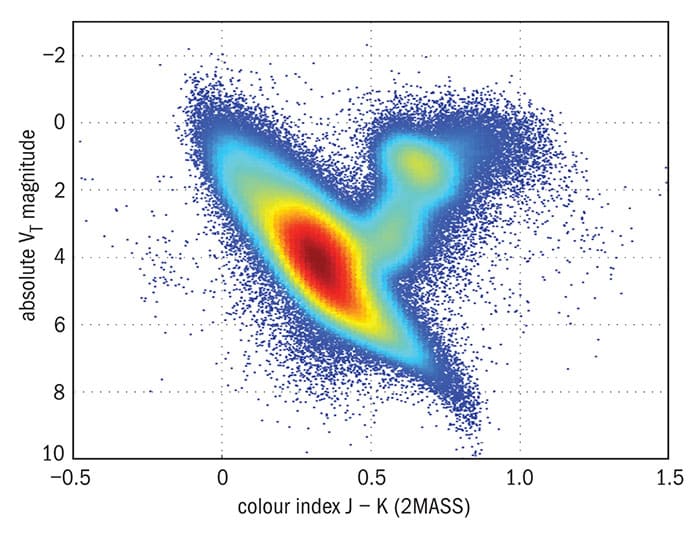
Gaia will provide an unprecedented observational insight into stellar evolution via its measurements of star clusters. These dynamically bound groups of stars have a shared formation history, which gives us a unique opportunity to observe so-called “isochrones” – the tracks that stars with different masses, but similar ages and compositions, trace out on stellar evolution graphs such as the Hertzsprung-Russell diagram (see figure).
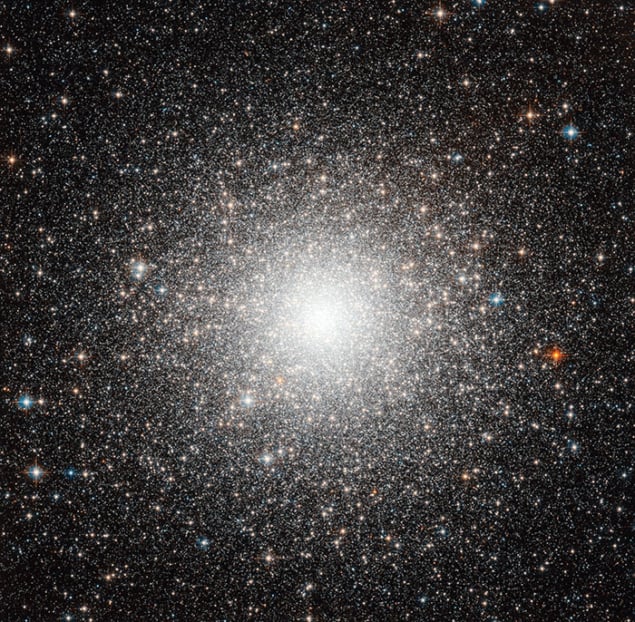
Gaia contributes to these data in many ways. One is that accurate proper motion and parallax measurements give us a highly reliable indication of which stars are actually members of the cluster. For clusters relatively close to the Earth, the same data will also show the cluster’s 3D structure, and highlight how the distribution of stars varies within the cluster as a function of stellar mass. Gaia will provide such data for clusters of many different ages, from the young, open clusters in the plane of the Milky Way galaxy to a few old globular clusters nearby.
General relativity
One of the earliest successes for Einstein’s theory of general relativity was its ability to describe the precession of the (elliptical) orbit of Mercury. Another was the theory’s prediction (famously tested by Arthur Eddington and Frank Dyson during the 1919 solar eclipse) that light from distant stars would bend as it passed near the Sun. Gaia will substantially improve and extend the accuracy of these two tests. The most sensitive tests of Mercury’s precession use an object on an elliptical orbit that takes it deep into the Sun’s gravitational well. There are several known asteroids that are ideal for such tests. Gaia will determine the orbits of these asteroids very precisely, making it possible to test certain parameters in the theory to an accuracy of a few tens of parts per million – a significant improvement.
Solar light-bending is a huge effect at Gaia’s levels of precision. The data that Gaia collects will make it possible to test the predictions of general relativity in a more complicated scenario, where light is bent by a secondary mass (Jupiter, in this case) in the presence of a much larger one (the Sun). This test will probe general relativity down to a level that is relevant for distinguishing between different gravity theories. Happily, this Jupiter test is scheduled to take place in 2019 – the centenary of the test that established general relativity and Einstein in popular culture.
Pulsating stars and the distance ladder
Some stars experience temporary imbalances between convective and radiative energy transport in their outer layers. Such imbalances make the stars pulsate, and this shows up in Gaia’s dataset as periodic changes in a star’s brightness, or “light curves”.
Pulsation is observed for specific groups of stars at different stages of their evolution, and is tightly linked to the stars’ surface temperature, mass and size. Only stars with certain properties will pulsate, and these properties (such as particular features of the light curves and the period of pulsation) are also closely linked to the stars’ intrinsic luminosities. This linkage means that pulsating stars can be used as “standard candles” to calibrate the distance to objects that are too far away for their parallax to be measurable. Three groups of stars make particularly good standard candles: the RR Lyraes, with periods around half a day; Cepheids, with periods of 10–40 days; and Miras, with periods of up to a year.
Gaia is observing thousands of stars in each of these groups. Data from the mission will make it possible to calibrate the relations used to determine extragalactic distances more accurately than ever – so accurately, in fact, that the cosmological distance ladder will no longer be limited by local calibration errors. Instead, the local systematic limit will be set by how well we can calibrate the degree to which light from the Cepheids is being extinguished by cosmic dust located between us and the Cepheid.
Transient events
Gaia is scanning the sky repeatedly, detecting and measuring all sources that are bright enough. However, some sources can suddenly change dramatically in brightness, putting them over the threshold at which they become “visible” to Gaia. These transient and variable sources are the subject of a special data analysis procedure, known as the Gaia photometric science alerts, which is run at the Cambridge Institute of Astronomy DPCI data centre. The Gaia Science Alerts system detects these transients and provides preliminary classifications for what they are – for example supernovae, cataclysmic variable stars, tidal disruption events, gravitational microlenses and so on.
These detections are published so that they can be followed up by ground-based astronomy facilities and, through a dedicated programme, by amateur astronomers and even groups of schoolchildren using a network of remotely controlled robotic telescopes distributed across the globe. A paper based on one such Gaia discovery (authored by a consortium of professional and amateur astronomers) has already been published. It describes a pair of white-dwarf stars whose orbit is aligned such that the stars occult each other in turn, allowing unusually precise study of the physical properties of the system.
An app to follow these events is available at gaia.ac.uk.

