The origin of high-temperature superconductivity in cuprate materials is one of the biggest puzzles in physics, but the behaviour of these materials when they are not superconducting is an even bigger mystery.

The richness and variety of phenomena observed in condensed-matter physics continues to surprise and confound, and no family of materials demonstrates this better than the cuprates. These are ceramic compounds in which elements such as lanthanum and strontium, or yttrium and barium, are sandwiched between layers of copper and oxygen atoms. For instance, the material La2CuO4 is an insulator, but when some of the lanthanum atoms are replaced by strontium, it loses all resistance to electric current and becomes a superconductor. This was essentially the breakthrough made by Georg Bedmorz and Alex Müller in 1986. The temperature below which this “doped” cuprate becomes superconducting varies with the concentration of strontium, and reaches a maximum of 38 K when the composition of the ceramic material is La1.85Sr0.15CuO4.
Cuprates with superconducting transition temperatures as high as 130 K have been discovered, and the cuprate family of materials continues to be of immense theoretical and experimental interest. Today, several hundred base stations for mobile phones are equipped with microwave filters that are made from high-temperature superconductors (HTS). High-power applications of HTS wires and cables include current limiters, beam-steering magnets in high-energy accelerators and energy-storage systems.
High-temperature superconductivity – like its low-temperature counterpart in metals such as lead and niobium – is known to result from electrons forming Cooper pairs. A major challenge is to understand the mechanism that binds the electrons together. In low-temperature superconductors, vibrations of the crystal lattice (known as phonons) enable the electrons to overcome their mutual electrostatic repulsion. The other characteristic of low-temperature superconductors is that the Cooper pairs have zero orbital angular momentum: in other words, they exhibit s-wave symmetry.
In most high-temperature superconductors the Cooper pairs have non-zero angular momentum and are said to exhibit d-wave symmetry. This is the hallmark of strong, short-range repulsion between the electrons.
The superconductivity is clearly linked to the replacement of lanthanum by strontium. This process is called “doping” and involves replacing an atom with three available electrons by an atom with only two available electrons. This introduces “holes” into the copper-oxide layers: these are the charge carriers that make the material conducting and, under the right conditions, superconducting.
Surprising as the superconductivity in these compounds is, it is the properties of the materials in their “normal” metallic state that are even more exceptional and require new physical concepts. Moreover, the mechanism behind the instability that causes the Cooper pairs to form depends on the electronic properties of the normal state. So unless these properties are understood, superconductivity cannot be understood.
The many phases of the cuprates
The generic phase diagram of the cuprates shows a wide variety of different behaviour at different temperatures and levels of doping (figure 1). All the compounds investigated so far show characteristic changes in almost all their thermodynamic and transport properties as either the temperature, T, or the number of holes per unit cell of CuO2 is varied. The number of holes per CuO2 unit, x, is a convenient parameter that can be used to compare the different cuprates.
The physical properties of the cuprates change abruptly at the superconducting transition (and also at the antiferromagnetic transition – see below). In the other regions of the phase diagram, however, the properties change gradually and there is a “cross-over” region rather than a well defined phase transition. Understanding the phase diagram in figure 1 is tantamount to understanding the cuprates and all their puzzling behaviours, including high-temperature superconductivity.
Condensed-matter physicists are interested in all of the thermodynamic, magnetic and transport properties of these materials. The challenge is to develop a microscopic theory that will predict all these properties. Here we will focus on a few key properties, including the specific heat capacity and the magnetic susceptibility, which is governed by excitations of the magnetic degrees of freedom.
The antiferromagnetic region is the best understood region in the phase diagram. At zero doping the cuprates are all insulators, and below a few hundred kelvin they are also antiferromagnets (i.e. the electron spins on neighbouring copper ions point in opposite directions).
However, when the doping is increased above a critical value (about 5%, although this varies from compound to compound), the antiferromagnetic state disappears and we enter the so-called pseudogap or underdoped region. It is called underdoped because the level of doping is less than the level that maximizes the superconducting transition temperature. Some of the most interesting behaviour observed in the cuprates is observed in this region and we will return to it – along with an explanation of what a pseudogap is – later.
The Fermi-liquid region of the phase diagram is also well understood. One of the central concepts in condensed-matter physics, introduced by Lev Landau, is the “quasiparticle”. In a so-called Landau-Fermi liquid the properties of single electrons are changed or “renormalized” by interactions with other electrons to form “quasiparticles”. The properties of the material can then be understood in terms of the weak residual interactions between the quasiparticles and their excitations. A key feature of the quasiparticle concept is that low-energy single-particle excitations have very narrow linewidths: Dw~w2 where w is the energy of the excitation.
When the quasiparticle approach is valid, there is a well defined boundary between particles and holes in both energy and momentum space at zero temperature. This boundary occurs at the Fermi energy and defines the “Fermi surface” in momentum space. However, the Landau quasiparticle model can only explain part of the phase diagram of the cuprates.
The best known characteristic of the superconducting region is the fact that the resistivity is zero. However, condensed-matter physicists measure many other properties of superconductors, such as the energy needed to split the Cooper pairs. This is the superconducting energy gap, 2D. The pairing process means that there are no single-particle excitations with energies of less than D in the superconducting state (hence the name gap).
Normal metals and Fermi liquids do not exhibit such gaps. Energy gaps show up clearly when the single-particle density of states is plotted – that is when the number of electronic states with a given energy is plotted as a function of energy. Energy gaps are also responsible for semiconductivity, but the mechanism that leads to the formation of the gap is completely different.
The part of the phase diagram between the underdoped and Fermi-liquid regions, and above the area with the highest superconducting transition temperatures, is called the non-Fermi-liquid region. The thermodynamic properties in this region are unexceptional and, within experimental uncertainties, are in fact similar to the behaviour of a Fermi liquid. However, this region is characterized by exceptionally simple but unusual power laws in all of its transport properties as a function of temperature. These transport properties include the resistivity, the optical conductivity, the electronic Raman-scattering intensity, the thermal conductivity, various nuclear relaxation rates, the Hall conductivity and the magnetoresistance. These unusual transport properties are why this part of the phase diagram is called the non-Fermi-liquid region.
The exceptional transport properties of the non-Fermi-liquid region led Phil Anderson of Princeton University to suggest in the late 1980s that radically new physics was – and still is – required to understand the cuprates. One of us and collaborators suggested that the non-Fermi-liquid region of the phase diagram is well described by the so-called marginal-Fermi-liquid hypothesis. Here the linewidth of a single-particle excitation is proportional to its energy, which means that the quasiparticles are not well defined, and there is no clear boundary between particles and holes at zero temperature.
This point was reinforced by angle-resolved photoemission spectroscopy measurements, which found no evidence for quasiparticles. On the other hand, the first derivative of the occupied density of states with respect to momentum is discontinuous, and this can be used to define a Fermi surface. But in the underdoped region, as we shall see, the concept of the Fermi surface itself is lost. For condensed-matter physicists this is very strange indeed.
Indirect evidence for the pseudogap region
A large number of experiments have probed the principal thermodynamic and transport properties of the underdoped region. The underdoped samples behave very differently from the overdoped and optimally doped ones (see Timusk and Statt in further reading).
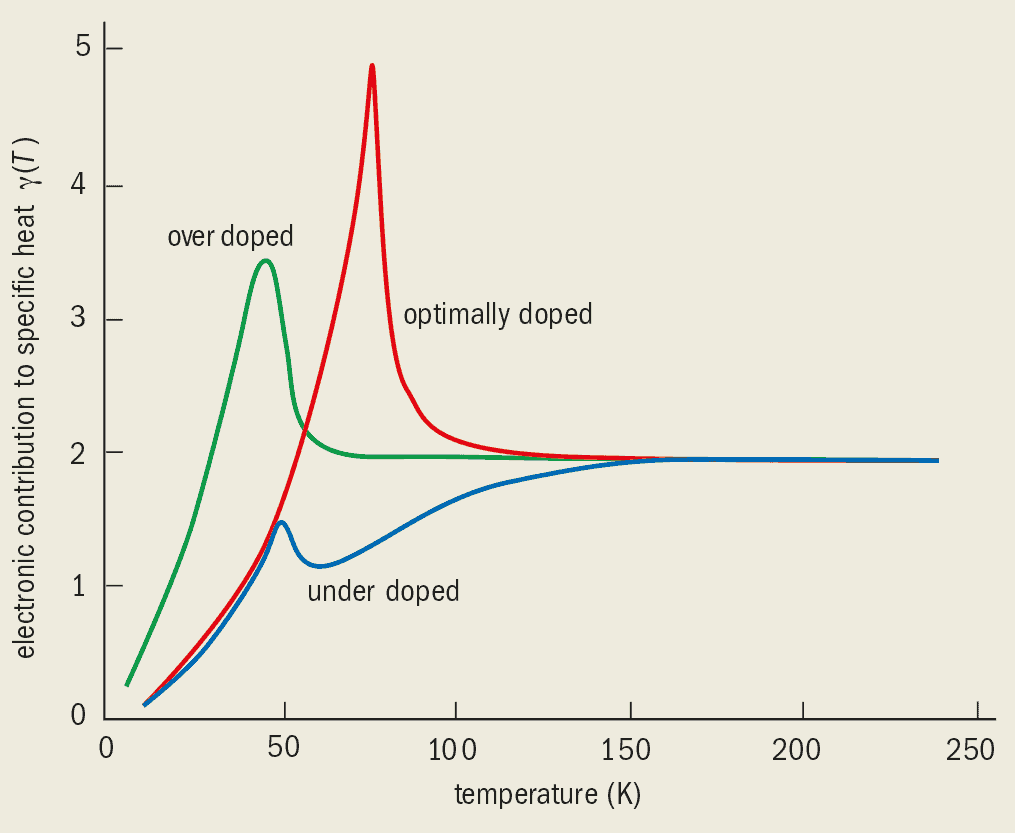
For instance, the contribution of electrons to the specific heat divided by temperature, g(T), of the overdoped and optimally doped samples remains approximately constant as the temperature is reduced. At the superconducting transition temperature, Tc, this contribution peaks, before falling to zero as the sample is cooled further. For underdoped samples, however, g(T) starts to decrease with temperature well above Tc (figure 2). This may be taken as possible evidence for a “pseudogap” phase that exists above Tc and below a characteristic pseudogap temperature, Tp.
For normal Fermi liquids the quantity S(T)/T – where the electronic entropy, S(T), is defined as S(T) = ò0T g(T) dT – is proportional to the contribution of the conduction electrons to the uniform magnetic susceptibility, c(T). Both S(T)/T and c(T) have similar dependencies on temperature for a range of doping levels. In particular, the decreases in S(T)/T and c(T) in the pseudogap region are similar to each other, even though neither is that of a Fermi liquid. This implies that both the charge degrees of freedom and the spin degrees of freedom (which determine the magnetic properties) are suppressed. The simplest possibility, which is consistent with both the thermodynamic data and the photoemission experiments discussed below, is that the one-particle density of states is suppressed. Again, this is indirect evidence for a pseudogap.
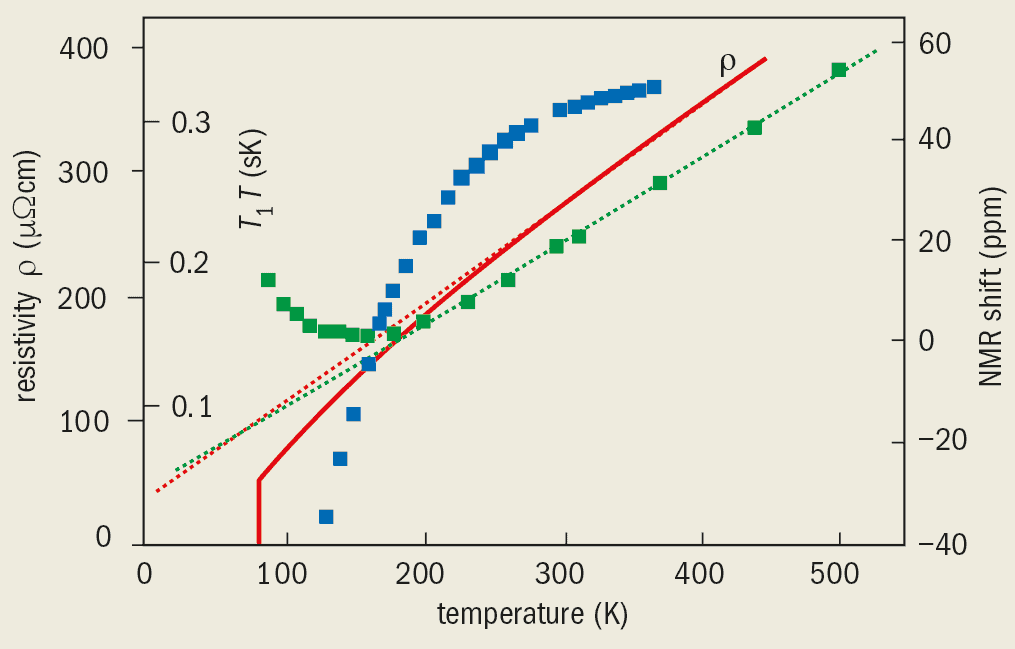
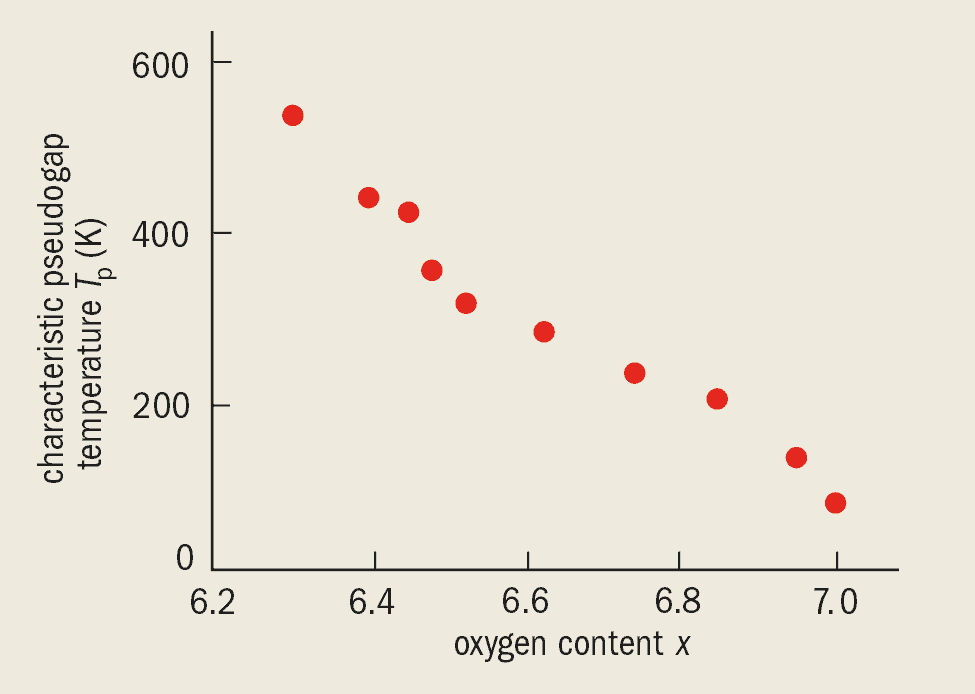
The pseudogap also manifests itself in various transport properties such as the resistivity, the nuclear magnetic resonance (NMR) relaxation time and the so-called Knight shift in NMR measurements. For instance, the cross-over from the linear dependence of the resistivity on temperature in the non-Fermi-liquid region to a stronger dependence in the pseudogap region is clear (figure 3). The characteristic temperature at which the influence of the pseudogap appears in a transport measurement depends on the property measured. It also depends systematically on the doping level (figure 4).
How big is the pseudogap?
Early evidence for the pseudogap in the underdoped phase came from indirect measurements like those described so far. What were really needed to explore and understand the pseudogap region were techniques that could directly measure the density of states. One of the best ways to do this is using angle-resolved photoemission spectroscopy (ARPES).
In a typical ARPES experiment, photons from a radiation source are directed at a sample. The photons have enough energy to expel electrons from the sample. If the direction and energy of the expelled electrons can be measured, it is possible to determine the momentum-dependent single-particle density of states below the Fermi energy. The pseudogap can be seen clearly in the ARPES data as a difference in the spectrum of the cuprate with respect to that of a normal metal (figure 5). Reassuringly, the pseudogap disappears above temperatures similar to those at which the transport properties change (figure 3). Moreover, this characteristic pseudogap temperature also changes with doping, similar to that seen in figure 4.
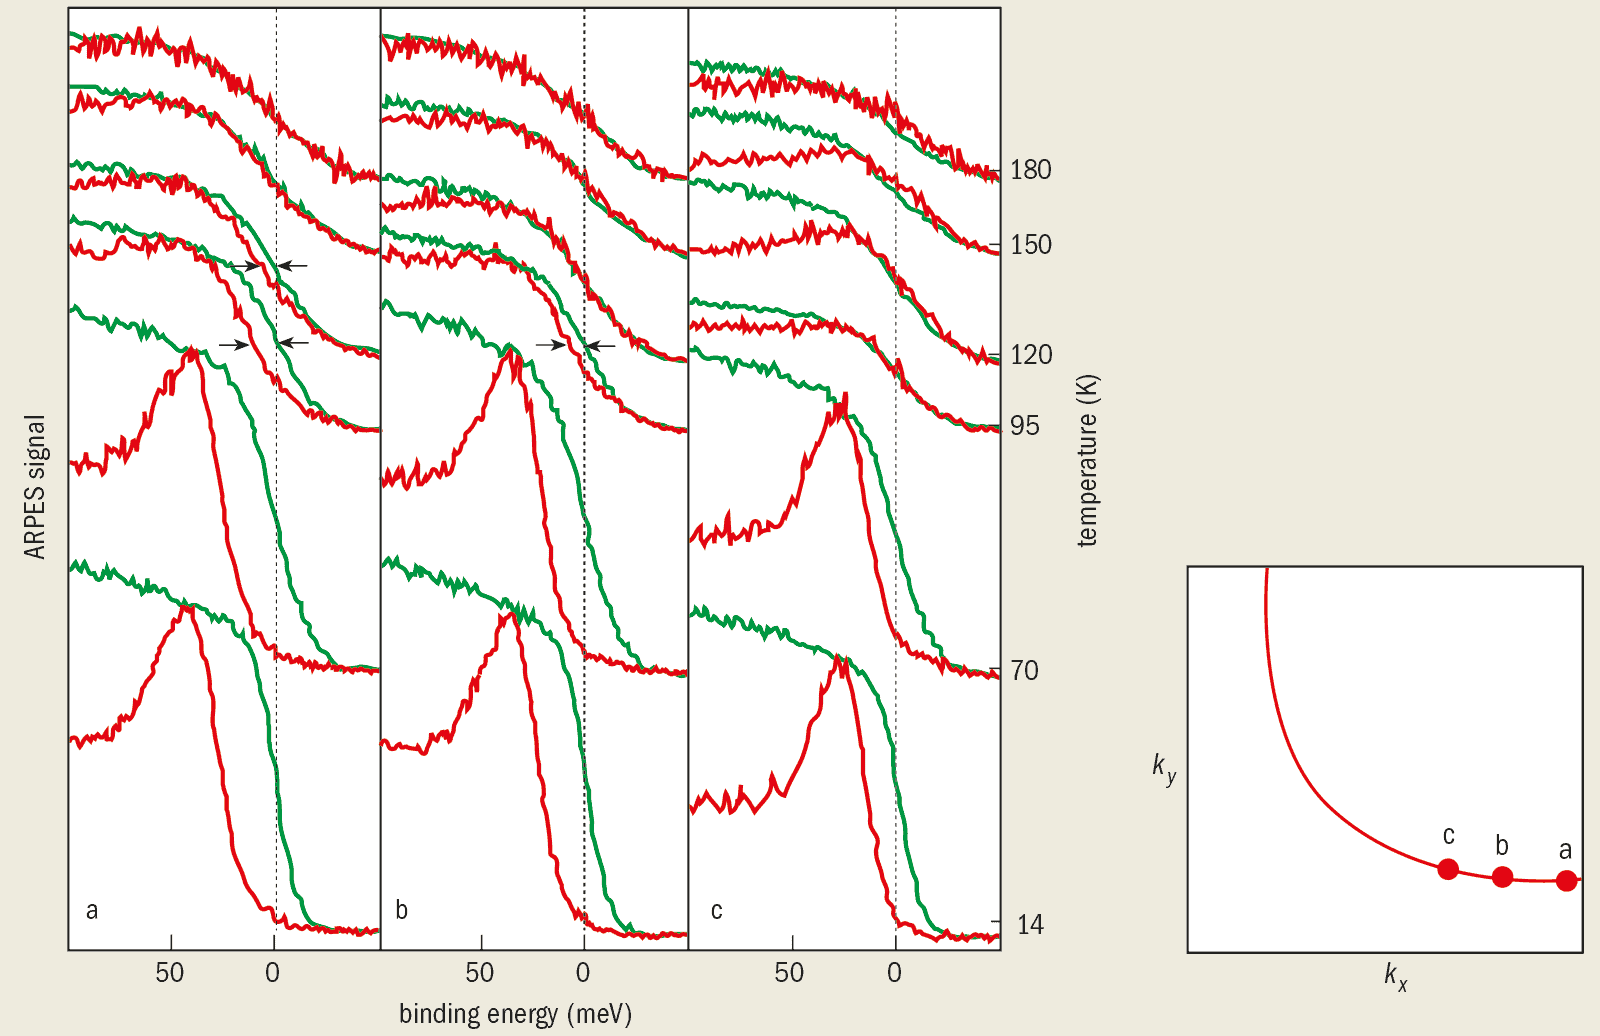
On the Fermi surface, the size of the pseudogap also varies with the direction. In the plane defined by the momentum in the x and y directions in the copper-oxide planes, kx and ky, the pseudogap goes to zero in four directions (kx = ±ky). This four-fold pattern has the same symmetry as the energy gap in a d-wave superconductor. This could prove to be a useful clue to understanding the puzzling behaviour of the underdoped region.
The characteristic energy of the pseudogap can be deduced from the specific-heat and ARPES data, and extrapolates to a value of about 100 meV at zero doping (figure 6). This is a surprisingly large value.
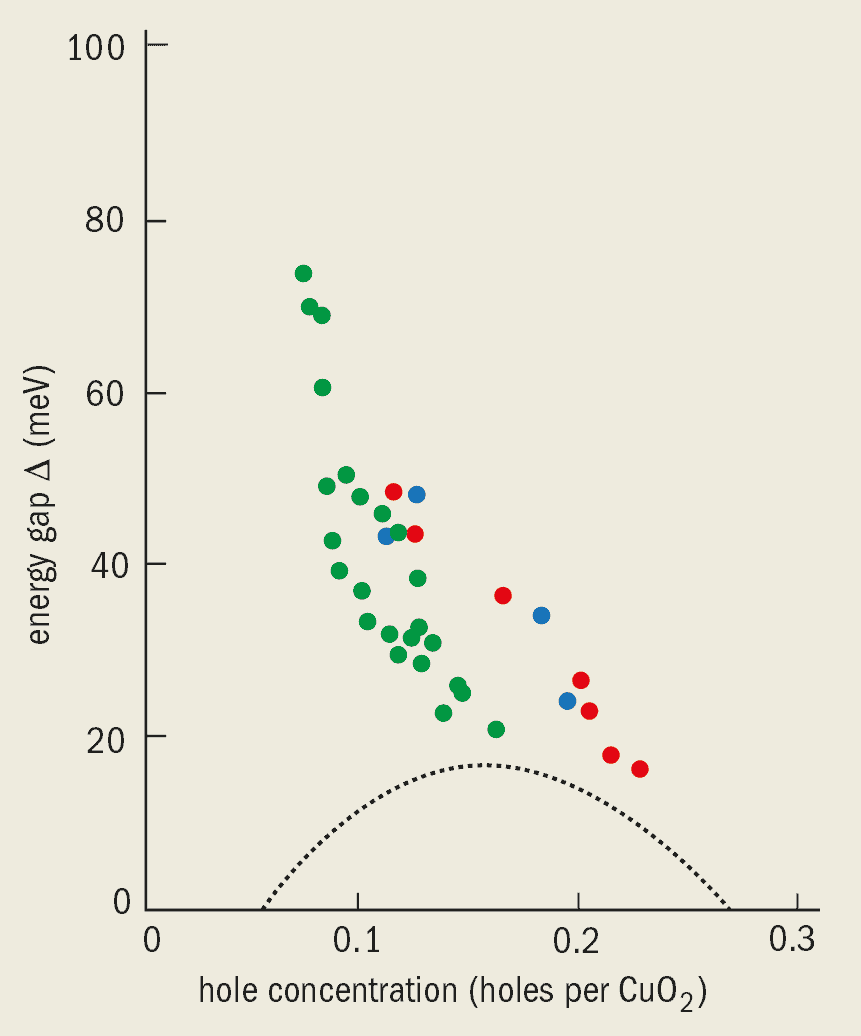
The magnitude of the maximum gap varies with doping in a similar way to Tp. The ARPES signal is also continuous as a function of energy across the superconducting transition, which means that the pseudogap above Tc is as robust as the superconducting gap below Tc. Maybe there is nothing “pseudo” about this gap at all!
If the notion of a Fermi surface is used loosely (i.e. without paying attention to finite temperature effects), one might say that the Fermi surface in the pseudogap regions consists of four arcs the lengths of which progressively diminish as temperature is decreased. If the interpretation of the ARPES data in terms of Fermi arcs is taken literally, the implication is that in the region between the arcs, the distinction between electrons and holes is blurred. This is a very bizarre situation.
As mentioned above, the pseudogap extrapolates to a large value (about 100 meV) at zero doping. It is possible that the gap measured by ARPES below Tc is made up of the pseudogap, Dp(x), and some multiple of kTc(x). Indeed, the gap measured by ARPES seems to vary as ~[Dp(x)2 + m2kTc(x)2]-1/2 with m » 5. This suggests that the pseudogap might have a physical origin that is distinct from the superconducting gap.
Do we understand the pseudogap region?
The experimental discovery of the pseudogap phase in underdoped cuprates has presented a major challenge for theorists, who have responded with an impressive number of ideas.
- Stripes. Some of these proposals rely on strong spin and/or charge fluctuations. Indeed, there is experimental evidence for “stripes” of charge and spin in several compounds in the underdoped phase. Two observations appear to challenge these proposals. First, no systematic correlations between the observation of stripes and either the characteristic pseudogap temperature, Tp(x), or the pseudogap energy, Dp(x), have been found. Second, the stripes appear not to produce the observed angular dependence of the pseudogap as seen using ARPES. It is also hard to see how stripes could lead to pseudogaps as large as those observed.
- Antiferromagnetic fluctuations. The cuprates are antiferromagnets at low doping, so it is natural to propose that antiferromagnetic fluctuations are responsible for the pseudogap phase in the underdoped region (see Pines in further reading). This proposal faces similar questions as the stripes proposal regarding both the symmetry and the magnitude of the pseudogap.
- Preformed pairs/superconducting fluctuations. Given that the symmetry of the pseudogap is the same as that of the superconducting state, it is natural to associate the pseudogap phase with fluctuations that lead to d-wave superconductivity. The pseudogap phase could result from the Cooper-pair formation energy being of the order of kTp(x), where k is the Boltzmann constant. These “pre-formed pairs” would cause all the thermodynamic and transport properties discussed above, and the single-particle spectra, to start changing around Tp(x).At least two versions of this idea have already been proposed. One version assumes that fluctuations in the phase of the superconducting order parameter (a complex number that describes the superconducting state) have such large amplitudes that they reduce the superconducting transition temperature from Tp to Tc (see Emery and Kivelson in further reading) This is supported by the small value of energy of these phase fluctuations in the cuprates. However, other measurements – notably measurements of high-frequency conductivity – appear not to support this idea (see Corson in further reading).
The second idea suggests that the coherence length (essentially the size of a Cooper pair) of the superconductors is so small that Cooper pairs form near Tp and that they all Bose condense into the same quantum state at Tc (see Randeria in further reading). However, experimental measurements of the coherence length do not support this.
Moreover, on the basis of either idea, one would expect the resistance in the pseudogap region to increase when an external magnetic field is applied, but this is not seen.
- Spin-charge separation. Many theorists have developed models in which the spin and charge degrees of freedom associated with the holes become separated. The spins bind together to form so-called spin-singlets, and the energy needed to split them apart leads to the formation of a “spin gap”. The charge degrees of freedom, on the other hand, remain free. The spin-singlets are in a d-wave state that, according to these models, is a prelude to the d-wave superconducting state at low temperatures. An attractive feature of these models is that the characteristic spin-gap energy is the exchange energy, which in the undoped compound is of the order of ~100 meV. Indeed this value is similar to the characteristic energy of the pseudogap extrapolated to zero doping.Many different versions of this idea, which was first proposed by Phil Anderson, have been pursued as experiments (see Lee in further reading). However, the fact that the specific heat (which is related to all the excitations) and the magnetic susceptibility (which is related to the spin excitations) behave in a similar fashion in the pseudogap region poses a problem for this approach. Also, the theory still has to explain the remarkably simple power laws observed in the transport properties and the single-particle spectra measured in the non-Fermi-liquid region of the phase diagram.
- Quantum critical points. This set of theories involves a point in the phase diagram where the transition temperature goes to zero as a function of some parameter, such as doping, pressure or the strength of an applied field – a so-called “quantum critical point” (see Sachdev in further reading). The transition must be between a phase with order or symmetry and one without such order. In other words it must involve a broken symmetry.The marginal-Fermi-liquid nature observed in the non-Fermi-liquid region of the phase diagram is consistent with a quantum critical point close to optimal doping. Several questions arise in applying this model to the cuprates. What is the broken symmetry associated with the pseudogap phase? And why are the thermodynamic properties at Tp(x) not singular, as often happens at such transitions?
One possibility, suggested by one of us (see Varma in further reading), is that the broken symmetry is a very elusive order parameter in the pseudogap region, and that there is a quantum critical point at the transition between the pseudogap and non-Fermi-liquid regimes. In this broken symmetry each unit cell breaks up into four “plaquettes” in which circulating currents flow between the copper and oxygen ions in consecutively opposite directions. Both time-reversal and four-fold rotational symmetry are broken by these currents, while the product of these two symmetries is preserved, as is translational symmetry.
This model makes predictions for the single-particle spectra, and also for the transport, magnetic and thermodynamic properties. However, only a direct observation of the proposed symmetry breaking – in, for example, an ARPES experiment with circularly polarized light – will make this exotic idea credible.
Where next?
Looking at the phase diagram for the cuprates (figure 1), it would be surprising if the four major regions – the pseudogap, the non-Fermi-liquid, the Fermi liquid and the superconducting regions – were not related. The understanding of the underdoped/pseudogap region may well hold the key to the understanding of the physics of the cuprates and, in turn, high-temperature superconductivity.
Given the large energy associated with the pseudogap, we would expect that the low-energy excitations would have unusual wavefunctions. So far experiments have concentrated on the energetics of these materials. However, this is not enough to distinguish between the many different models of high-temperature superconductivity that have been proposed. There is a clear need for experiments that can provide information about the wavefunctions (which could be provided by measurements of various correlation functions).
Of course, it could be that these experiments eliminate all of the theories, in which case it will be back to the drawing board for the theorists.