Numerical models are providing detailed insights into the formation and dynamics of avalanches, which could help to protect mountain communities from destruction.

Two years ago, Switzerland and Austria were struck by the worst avalanches in over 50 years. Some 3000 avalanches occurred in the Swiss Alps alone, 1000 of which caused damage to villages, power lines, forests and agricultural land. Villages were cut off and tourists were stranded, causing havoc to the country’s lucrative tourist industry. A total of 12 people were killed when one massive avalanche destroyed several chalets and overcame two unsuspecting motorists on a road near the village of Evolène. The avalanche came to a halt some 4 km from its starting point, burying the road under 10 m of snow and ice. Across the border in Austria, an avalanche killed 38 residents of the town of Galtür – by far the worst accident of the winter.
Switzerland has a long tradition of coping with snow avalanches, and research at the Swiss Federal Institute for Snow and Avalanche Research (SLF) began in 1938, on the eve of the Second World War. Fearing a German invasion, the Swiss knew that they would have to fight in mountain terrain and feared losing valuable troops to avalanches.
These days it is skiers in remote areas who present avalanche experts with the greatest difficulties. On average, 25 people die every year in Switzerland in avalanches and most of them are back-country or off-piste skiers. After the last catastrophic winter in 1951, when avalanches killed over 100 people, research into avalanche warning, avalanche dynamics, and the physics and mechanics of snow intensified. The winter of 1999 – with its three periods of heavy snowfall in January and February – provided snow and avalanche researchers with their best opportunity to test the simulations and theories that had been developed over the previous 50 years.
Avalanches follow a well worn path
Perhaps the most common misconception – largely propagated by Hollywood films that show avalanches killing villains in quasi acts of God – is that alpine communities are completely unprotected from the wrath of snow. Little wonder that many people think avalanches strike randomly and cause mass destruction. This certainly isn’t the case in Switzerland, a country that has a long tradition in coping with avalanches. A mountain community usually knows the starting or fracture zone of an avalanche, as well as the path that the sliding mass of snow is most likely to take down the mountainside. Indeed, generations of inhabitants who have observed the activity of avalanches for centuries often give these paths names, like Tristallaui or Rotlaui.
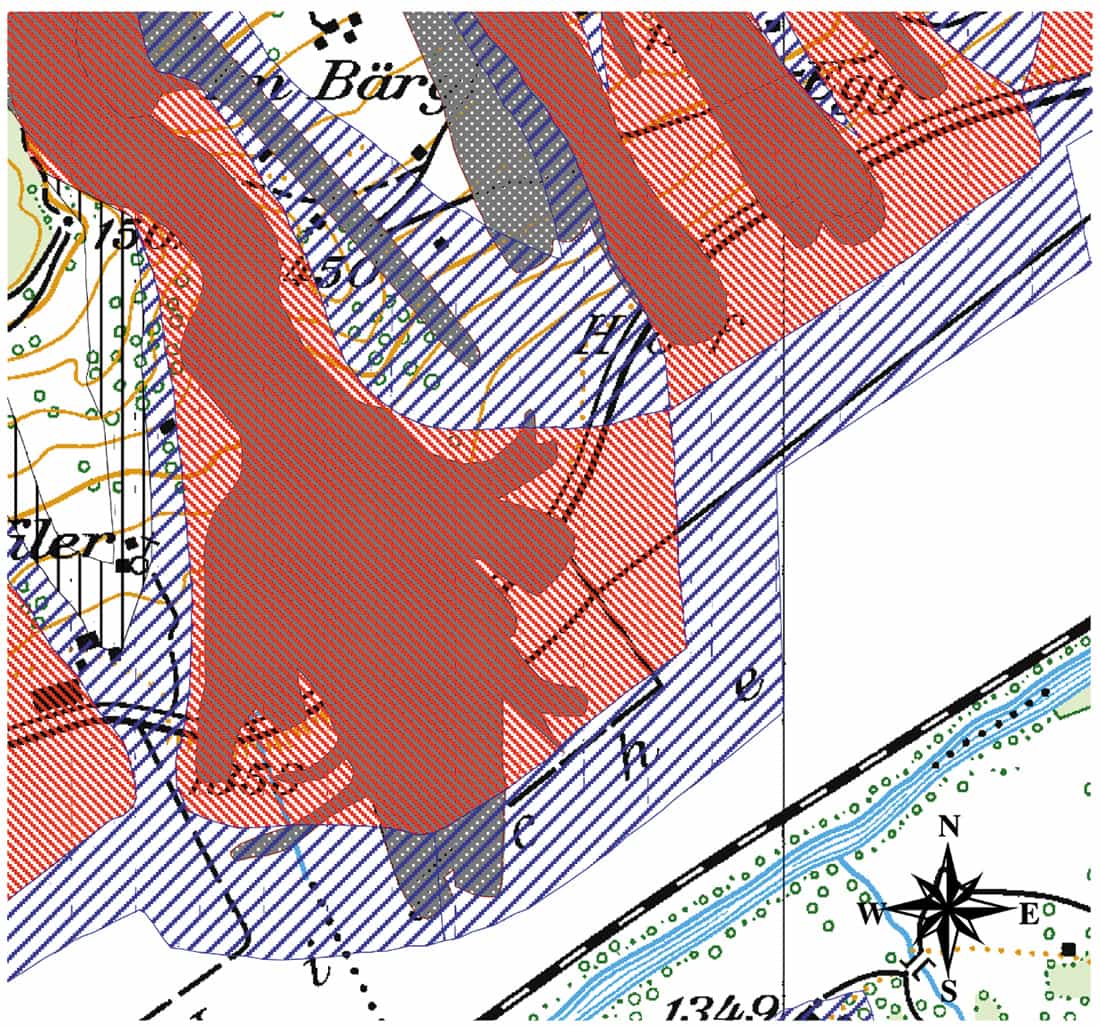
Mountain communities keep official records that contain information about when an avalanche occurred, the meteorological conditions at the time, where the snow slide started and how far it ran down the mountainside. Land planners use these records to draw up so-called hazard maps that help to determine if, for example, a house can be built at a particular location, or if a property needs to be reinforced to withstand the impact pressure of an avalanche (figure 1). Local authorities also refer to these hazard maps to decide whether they should evacuate buildings in extreme situations, like those that occurred during the winter of 1999.
However, in order to draw up such maps, land planners need to know how far an avalanche can travel given the volume of snow that initially breaks away from the mountainside. We relate this volume to the so-called return period, the number of years that have passed since a similar avalanche occurred in the same area. A large avalanche with a return period of 300 years can unleash over 100,000 m3 of snow and ice, weighing about 30,000 tonnes.
During the catastrophic winter of 1999, avalanche researchers observed fracture lines that extended several kilometres along the mountain tops. Ominously, the fractures in the snowpack were between five and eight metres deep. Once such a large avalanche begins, it can reach velocities of over 250 kilometres per hour and exert pressures of over 50 tonnes per square metre.
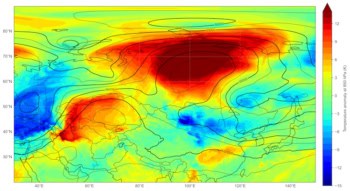
In general, land planners prepare hazard maps by consulting the historical avalanche records and applying their intuition and experience. But if a record-breaking avalanche looks likely, then the planners must turn to models of avalanche dynamics to estimate how far the snow will travel and what its pressure will be on impact.
Go with the flow
In one sense avalanches are rather simple phenomena – they are nothing more than masses moving down a slope under the influence of gravity. On the other hand, they are extremely complex phenomena: avalanches are rapidly moving gravitational shear flows that contain a dense granular core surrounded by a cloud of airborne and turbulent powder.
The properties of the snow – such as its density, mechanical properties and wetness – together with the mountainside terrain determine whether the dynamics of the avalanche are dominated by granular or powder flow (see box). Moreover, avalanches gather more snow as they slide down the mountain, making their flow highly irregular and difficult to predict. In addition, the flow is sensitive to the characteristics of the terrain – such as the steepness and roughness of the mountainside – and the local vegetation.
It is hardly surprising that models of avalanche dynamics range from the trivial to the highly complex. In the simplest case, the terminal flow velocity of an avalanche is estimated based on the conservation of potential and kinetic energy. At the other end of the spectrum, the dynamics are calculated using sophisticated three-dimensional numerical models that take into account both the ice particles and the air contained in the snow slide. The first avalanche models were proposed in 1955 by the Swiss physicist Adolf Voellmy, and numerical models are now being developed by groups in Switzerland, Norway, Austria and France.
Currently the most popular simulations are the so-called depth-averaged hydraulic models. In these models, the differential equations that describe the conservation of mass and momentum are similar to the equations in fluid mechanics that characterize the motion of waves in shallow water. However, flowing snow is very different from water and the equations must be modified to take into account the fact that snow exhibits solid behaviour.
The models also assume that the frictional force at the base of an avalanche is proportional to the force that acts perpendicular to the surface, rather like a solid block sliding down an inclined surface. Meanwhile, the internal friction – the energy that is dissipated via granular collisions and interparticle rubbing – is parametrized by the “angle of repose” of the dense core. This is the steepest slope on which the granular clods (i.e. clumps) of snow that make up the core can lie without slipping.
The reasoning behind this approach is that an avalanche consists of different flow regimes. In the “grain inertia regime”, first defined in the 1940s by the British geophysicist and explorer Ralph Bagnold, granular collisions between the snow clods are the dominant mechanism of energy and momentum transport. The contact forces between the clumps of snow are small, which means that the clods cannot rub together and create friction. Pressure sensors that are placed in the path of real avalanches have confirmed the behaviour of this flow regime by measuring the individual impacts of the clods, rather than a stationary or continuous pressure.
In the second flow regime, the dominant frictional mechanism arises from the snow clods rubbing together, while the collisional activity is small. In an extreme case, the core of the avalanche moves like a solid plug sliding over a thin layer of fluid that is deformed due to rubbing.
Another difference compared with hydraulic models is that avalanches usually “entrain” or collect a significant portion of the snow cover as they slide down the mountain. Snow entrainment is now being included in models of avalanche dynamics. Without it, the mass balance of the calculations is simply wrong. This has practical consequences since the models are used to calculate the height of the deflectors and dams that are built to protect villages and roads. By neglecting snow entrainment, avalanche researchers risk underestimating the height of the flow and therefore the height of the dams that are needed to catch the snow.
The amount of snow entrained by an avalanche is proportional to the flow velocity. The snow that is gathered up as the avalanche slides down the mountain is accelerated from rest up to the flow velocity. As a result, the latest simulations treat snow entrainment as a drag force that is proportional to the velocity squared. On a steep slope, entrainment fails to slow the avalanche, but it does reduce the acceleration.
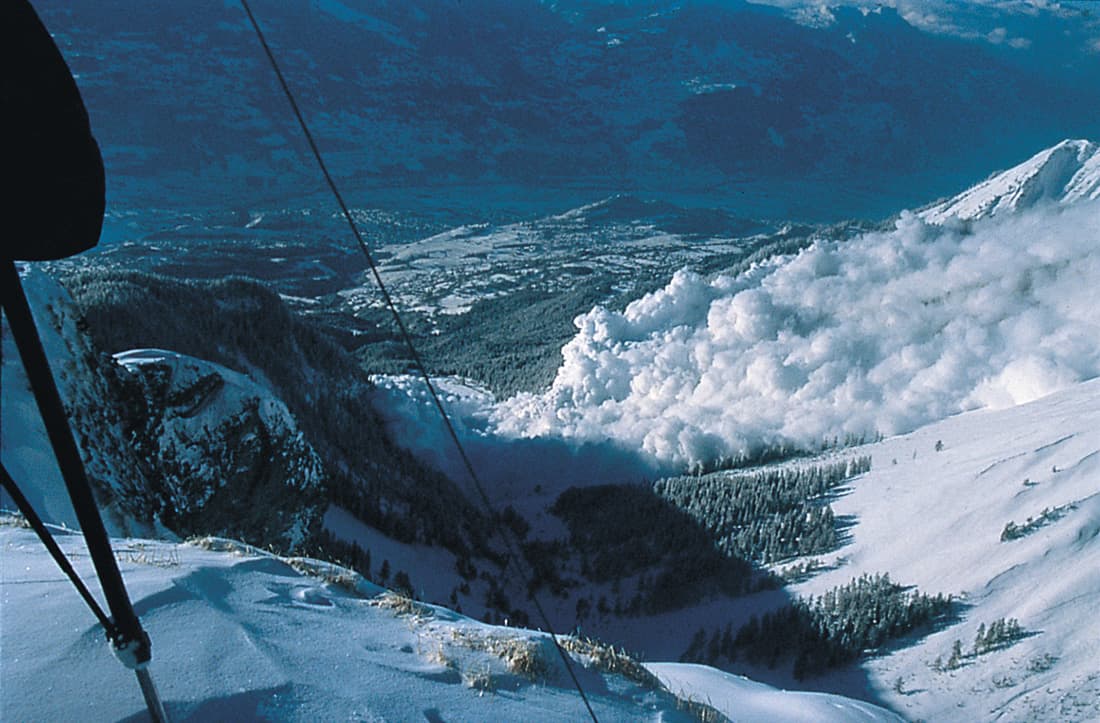
Interestingly, avalanches can easily destroy and entrain entire forests as well as the snow cover. The energy needed to fracture and transport a dense forest of spruce trees is very small compared with the kinetic energy of a good-sized avalanche, which typically ranges between 104-105 megajoules. In other words, once an avalanche has enough force to break or overturn a tree, the deceleration caused by breaking and accelerating a tree trunk up to the flow velocity is very small. This fact explains the massive areas of forest that were destroyed during the winter of 1999 (see figure 2). Forests do not protect communities by stopping a flowing avalanche, but rather by stabilizing the snow cover on steep slopes above the village.
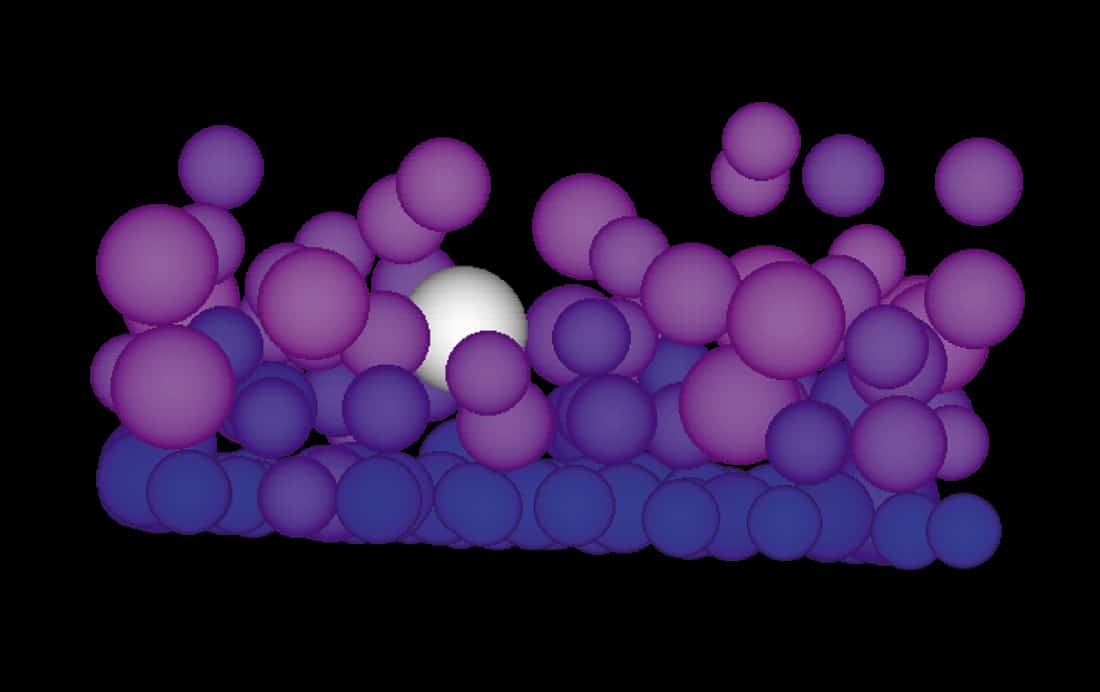
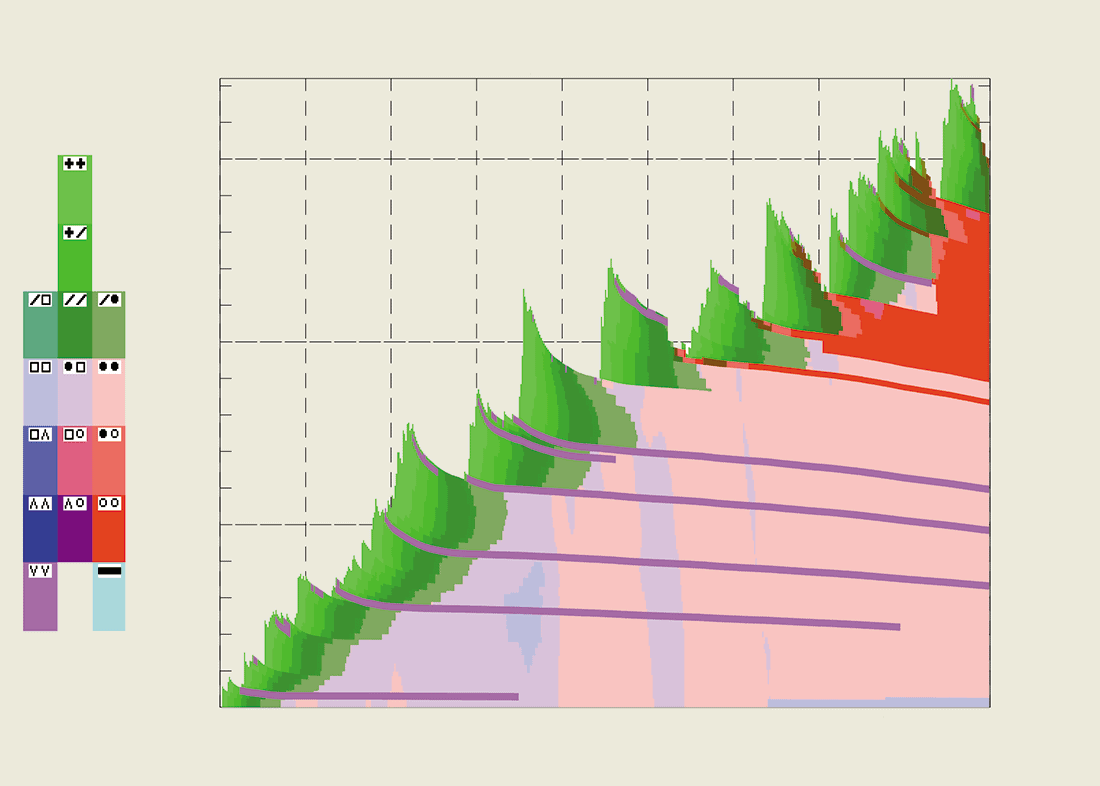
Researchers are also gaining further insights into the nature of avalanche flow using models of particle dynamics. In these computer simulations, the motion of the particles is governed by simple, inelastic, binary collisions – i.e. by the conservation of translational and angular momentum (figure 3). A large number of spherical particles of varying diameters and densities are placed in a box on a virtual slope and accelerated downward by gravity. The sides of the box are periodic – i.e. when one particle leaves the box, it re-enters from the opposite side. (The number of particles depends on the available computing power.) The numerical simulation is then used to model the steady-state conditions of the system.
Such models are being used to determine why larger particles remain on the flow surface – an important point when trying to understand how to save skiers who are caught in an avalanche, and also for establishing rheological laws that can feed into depth-averaged hydraulic models. Moreover, models of particle dynamics may provide important insights into the formation of powder-snow avalanches from flowing ones – a key question that is both difficult and expensive to investigate experimentally.
Simulations of particle dynamics have revealed clearly that the granular motion within a flowing avalanche is chaotic. The exact location of an individual particle cannot be determined after the first 100 collisions or so, due to inaccuracies in the initial state propagating through the simulation.
Different types of avalanches
The dynamics of an avalanche are dominated by either a core of dense snow flowing down the mountain or an airborne cloud of powder. The table shows how the characteristics of the two types are very different.
| Flowing avalanche | Powder avalanche | |
| Typical velocity | 30 – 60 ms-1 | 40 – 100 m s-1 |
| Flow height | 1 – 5 m | 20 – 100 m |
| Density | 100 – 300 kg m-3 | 3 – 20 kg m-3 |
| Pressure | 100 – 500 kPa | 0.5 – 40 kPa |
| Friction | Granular collisions, basal friction | Turbulent drag, surface friction unimportant |
| Terrain | Avalanche often follows gullies | Terrain less important, follows steepest descent |
Snow and ice reach breaking point
Avalanches form as soon as the forces due to gravity, fresh snow, an explosion or the additional weight of a skier, exceed the mechanical strength of the packed snow and ice. However, this simple fact is completely useless to the local authorities that have to decide when to close a road, evacuate a village or artificially release an avalanche to protect a ski run. Researchers therefore need to address questions concerning the forces and the strength of the snowpack.
For example, what is the strength of snow? Not surprisingly, the mechanical properties of snow are somewhat similar to ice. Both are viscoelastic materials that exhibit creep behaviour over time. In other words, snow and ice deform continually without fracturing as the load on top of them increases. However, the loading rate is critical, and avalanche experts are just as interested in the rate of snowfall as they are in the amount. Heavy snowfalls over a short period of time lead to a greater chance of avalanches.
Snow is a porous medium rather than a homogenous solid. It contains grains of ice that are arranged in a complicated interconnected lattice as well as air and, sometimes, water. Ice bonds exist between the grains and under loading the force is carried by grain-bond chains within the lattice.
During creep, the snowpack deforms via two main mechanisms: intergranular sliding and straining. Experiments indicate that the sliding of the ice grains over each other – a frictional and irreversible process – dominates in new or low-density snow. Meanwhile, the viscoelastic straining of the granular ice chains, and in particular of the ice bonds, dominates in older and denser snow. As a chain is only as strong as its weakest link, the bonds between the grains are critical. However, the breaking of a single bond does not necessarily initiate a chain reaction that leads to an avalanche. On the contrary, new bonds can form under deformation that might even strengthen the snow cover.
What is important is that the stresses on the ice bonds are some 50 to 100 times higher than the continuum stresses exerted on the snowpack as a whole. The reason for this is that snow is a porous medium and the force is carried only by the ice chains, which have a small cross-sectional area. The exact stress on the ice bonds depends on the microstructural properties of the ice grains, such as their size and shape. And it is this problem that makes predicting the stability of the snowpack so difficult. Researchers must forecast how the microstructural properties of the snow cover change over time. The only way to accomplish this task is with numerical snowpack models.
Simulations based on finite-element analysis can track the heat transfer and the mechanical deformation of the snow, together with the transport of water and water vapour, and the phase changes that occur within the snowpack over the entire winter. At the SLF, these models are driven using meteorological data – such as the air temperature, solar radiation, wind speed and relative humidity – measured at some 80 automatic weather stations scattered throughout the Swiss Alps.
The model we have developed, called SNOWPACK, also tracks the microstructural changes of the snow grains. These changes are governed by vapour-pressure differences between the layers of snow, between the grains in a layer, and between the surfaces of a single grain. Within the model, the laws that describe the heat conductivity and viscosity of the medium are parametrized in terms of the size and shape of the snow grains.
SNOWPACK is probably the most advanced model of its type because a great deal of effort has gone into evaluating the model by digging snow pits and comparing the observed and simulated layers in the snow. The model appears to work, since it is now being used by avalanche specialists to estimate the height of new snowfall and the snowfall loading rates – the initial information needed to predict the degree of avalanche danger.
However, the model needs considerable work and validation before it can be used to predict exactly when and where avalanches will occur. Currently SNOWPACK only calculates the development of the snowpack at a single isolated point, not for an entire slope (figure 4).
The delicate and intricate structure of falling snowflakes doesn’t last for long (figure 5a). The tiny branches of the crystal break as soon as the flake lands on the ground and is covered by fresh snow. This load deforms the crystalline structure, increasing the density of the new layer of snow. Gravity is the obvious force driving the structural changes but there are other, more subtle, mechanisms at work that are just as powerful.
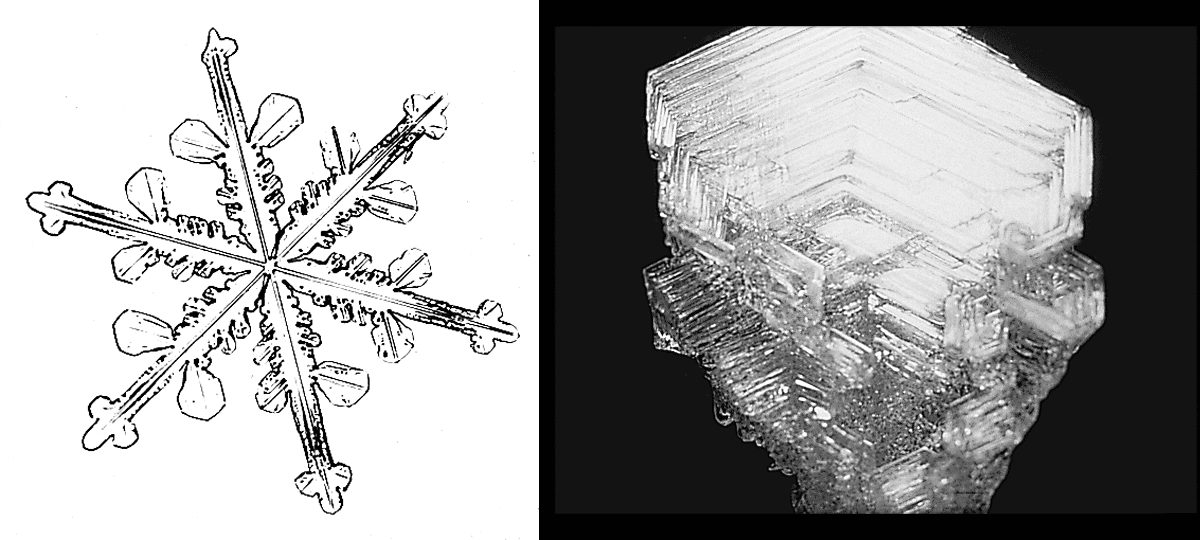
The heat flow from the ground is typically large enough to ensure the temperature at the soil-snow interface is kept at freezing point, while the surface of the snow is normally below 0 °C. This heat flow generates a corresponding water-vapour pressure difference, which leads to the onset of diffusion. The sublimed water molecules in the warmer regions wander to the colder areas, where they deposit on the ice frame. In addition, water vapour can move freely throughout the porous system. The consequence of this transport is a localized change in the density and in the shape of the crystals – known as metamorphosis. As a result, we often find a spectacular layer of “depth-hoar” – hollow cup-shaped ice crystals that grow up to a few millimetres in size (figure 5b). Depth-hoar crystals develop in a loose array that leads to a zone of weakness within the snowpack and are a major contributor to avalanche formation.
Metamorphosis is often thought of as a rather slow process. However, since the structural changes in porous snow occur close to the melting point, metamorphosis can happen quickly. Indeed, the changes may be visible within a day or so. The fragile ice hoar-frost crystals that appear on cold surfaces, such as car windscreens, build up overnight. Next time you scrape the frost from your car, take a better look at the beautiful crystals you destroy. Snow physics is a cold job, but nevertheless could be classified as high-temperature solid-state physics.
Avalanche warning
With the development of winter tourism and ski resorts, safeguarding skiers and increasing numbers of snowboarders and snowmobilers, both on and off piste, has become even more important. Skiers and mountaineers have to be aware of the avalanche lurking in their path. Avalanche management is called for, including implementing sophisticated methods to control avalanches.
Just as wild waters can be tamed, so avalanches can be controlled – with a few exceptions that we call catastrophes. Avalanche managers – such as the Forest Service in the US and the local authorities in Switzerland – apply different strategies, depending on the situation. For example, avalanche fences can be placed in the starting zone to stabilize the snow cover, while deflector or catching dams can be constructed in the avalanche runout zone. The artificial release of avalanches with explosives is also a powerful defence tool. Forecasting is another.
Avalanche forecasts based on purely physical methods are not really feasible. Physical models require knowledge about when the load exceeds the strength of the snow cover. To obtain this information, researchers would need to know how much snow there is, and its temperature, to an accuracy that we can only hope for.
Based on both experience and experiments, we know that variables such as the snow temperature, air temperature, wind, precipitation and solar radiation, among others, affect the stability of the snow cover. The SLF has gathered such data for decades and also kept records of avalanches, such as their date, location and cause. Such data beg a statistical treatment. Charles Obled and P Bois at the Cemagref agriculture and environmental research centre in Grenoble, France, first developed this kind of approach as an avalanche warning system in the 1970s.
Using statistical methods, they developed a technique to find the most significant meteorological variables (e.g. precipitation) related to an avalanche that occurred in a particular area. The results were always expressed as a probability that an avalanche would strike on a given day. In practice, however, these statistical outcomes were of little value because the technique failed to distinguish between different types of avalanches. Suppose, for example, that the technique predicts that the probability of an avalanche is 100%. Statistics do not tell us whether there will be one small avalanche or many large ones. Other ways had to be found to make the results more transparent and applicable.
The solution is a simple concept known as the “k nearest neighbours” method, which was pioneered by one of us (OB). Essentially it is a way of quantifying our experience. On a given day we examine the state of the snow and the weather conditions on a representative snow field. The variables we consider are the ones found by Obled and Bois to give the best results in their statistical method. We then look back through the records to find the 10 days – the nearest neighbours – that best match these conditions and check if an avalanche subsequently occurred. If there were no avalanches, then we can be pretty sure that one will not happen that day. However, if an avalanche did occur then we can find out from the records the type of avalanche it was, the time of day it happened and, perhaps, even what caused it. The local authorities can then decide whether to close a ski resort or roads, and also issue their own forecast for that particular area. This means that actions are taken based on a numerical methods, rather than intuition.
Outlook: goodbye to the weakest link
What began in the 1930s with coarse and simple field observations has become a sophisticated and fascinating field of experimental, theoretical and numerical physics. And the experiments continue. At the Vallée de la Sionne avalanche-dynamics test site in Switzerland, we conduct field tests to measure avalanche flow velocities, impact pressures, flow heights and densities. The avalanches are artificially released with explosives and flow past instrumented obstacles located along the avalanche path. Our final goal is to improve the basic understanding of avalanche motion and to develop better physical models that can be applied by avalanche practitioners to calculate runout distances.
Meanwhile in the laboratory, computed tomography imaging is being applied to determine how the microstructure of snow changes over time. The aim of this research is to relate microstructural changes to mechanical strength. Moreover, experiments that measure the stress-strain behaviour of snow samples of known structure should improve our knowledge of specific bond strengths.
Armed with this information, we might be able to model the propagation of a crack and tell whether it will be damped or will lead to a full-sized fracture that will start an avalanche. As with many things in life, tiny events like the failure of the “important” bond can have disastrous results. To find this bond in the snow is the ultimate challenge in snow and avalanche research.