Margaret Harris reviews Cosmos: the Infographic Book of Space by Stuart Lowe and Chris North

Space, as Douglas Adams once wrote, is big. Really big. But just how big is it? And what else, aside from our own planet Earth, is out there in it? Cosmos: the Infographic Book of Space answers these questions in a stunning fashion, but to describe it as a beautiful book full of interesting facts does not do it justice. Frankly, it’s a marvel and a delight, and no-one with an interest in space or science communication should be without it.
The infographics in Cosmos cover a broad range of topics, from human space exploration through to cosmology. Some, such as a pair of graphics illustrating how large and how small stars can be, convey messages that can be absorbed at a single glance. Others invite the reader to dive in and explore. A good example is “Collision imminent”, which displays data on asteroids, plotted according to the year of their closest approach to the Earth (angular axis, running clockwise from the year 1900 at the top) and by how close they came, or will come, to colliding with the planet’s surface (radial axis).
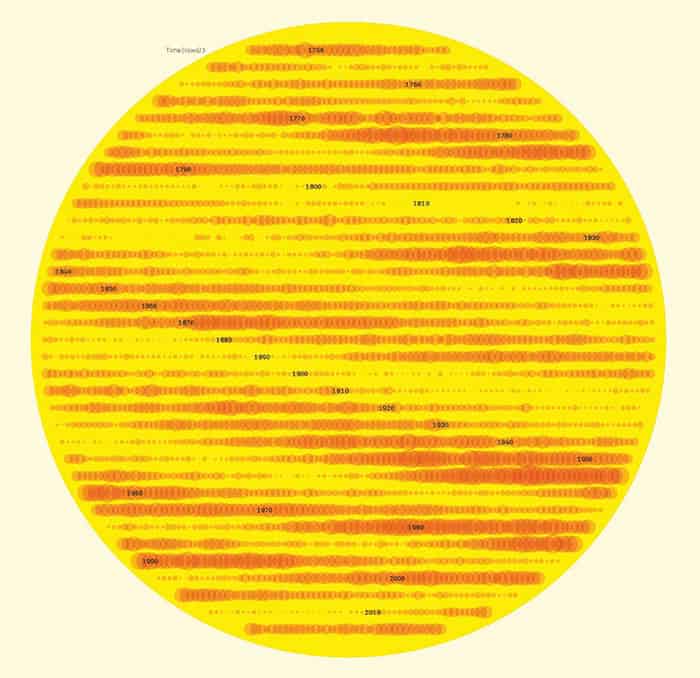
Still other graphics, such as “Sunspots”, are deceptive in their apparent simplicity. In this image, authors Stuart Lowe and Chris North have plotted the number of sunspots observed each month from the mid-18th century (top) through to the present day (bottom). Larger circles represent more active months, and plainly, their frequency is not random; as the authors note in the accompanying text, “the overall number of sunspots changes over an 11 year cycle”. But why should that happen? And why were there such long stretches of inactivity in the early 19th century, and such an active period in the middle of the 20th?

Sunspot records alone won’t tell us the answers to these questions. Fittingly, Cosmos doesn’t either. What it does tell us, though, is that these are questions worth asking. Often, the questions that Cosmos leaves unanswered are active areas of research. A plot of the “30,000 nearest galaxies”, for example, shows plainly that they are not evenly scattered through space. Yet while astronomers have identified several distinct “superclusters” (such as the Great Attractor, located towards the right of the plot, just above the central plane of the Milky Way), their exact nature and origin remain elusive. Few, if any, popular-science books make such mysteries as accessible as Cosmos does.
- 2015 Aurum Press £25/$34.99hb 224pp