Positron emission tomography (PET) is used extensively within preclinical research, enabling molecular imaging of rodent brains, for example, to investigate neurodegenerative disease. Such imaging studies require the highest possible spatial resolution to resolve the tiny structures in the animal’s brain. A research team at the National Institutes for Quantum Science and Technology (QST) in Japan has now developed the first PET scanner to achieve sub-0.5 mm spatial resolution.
Submillimetre-resolution PET has been demonstrated by several research groups. Indeed, the QST team previously built a PET scanner with 0.55 mm resolution – sufficient to visualize the thalamus and hypothalamus in the mouse brain. But identification of smaller structures such as the amygdala and cerebellar nuclei has remained a challenge.
“Sub-0.5 mm resolution is important to visualize mouse brain structures with high quantification accuracy,” explains first author Han Gyu Kang. “Moreover, this research work will change our perspective about the fundamental limit of PET resolution, which had been regarded to be around 0.5 mm due to the positron range of [the radioisotope] fluorine-18”.
System optimization
With Monte Carlo simulations revealing that sub-0.5 mm resolution could be achievable with optimal detector parameters and system geometry, Kang and colleagues performed a series of modifications to their submillimetre-resolution PET (SR-PET) to create the new high-resolution PET (HR-PET) scanner.
The HR-PET, described in IEEE Transactions on Medical Imaging, is based around two 48 mm-diameter detector rings with an axial coverage of 23.4 mm. Each ring contains 16 depth-of-interaction (DOI) detectors (essential to minimize parallax error in a small ring diameter) made from three layers of LYSO crystal arrays stacked in a staggered configuration, with the outer layer coupled to a silicon photomultiplier (SiPM) array.
Compared with their previous design, the researchers reduced the detector ring diameter from 52.5 to 48 mm, which served to improve geometrical efficiency and minimize the noncollinearity effect. They also reduced the crystal pitch from 1.0 to 0.8 mm and the SiPM pitch from 3.2 to 2.4 mm, improving the spatial resolution and crystal decoding accuracy, respectively.
Other changes included optimizing the crystal thicknesses to 3, 3 and 5 mm for the first, second and third arrays, as well as use of a narrow energy window (440–560 keV) to reduce the scatter fraction and inter-crystal scattering events. “The optimized staggered three-layer crystal array design is also a key factor to enhance the spatial resolution by improving the spatial sampling accuracy and DOI resolution compared with the previous SR-PET,” Kang points out.
Performance tests showed that the HR-PET scanner had a system-level energy resolution of 18.6% and a coincidence timing resolution of 8.5 ns. Imaging a NEMA 22Na point source revealed a peak sensitivity at the axial centre of 0.65% for the 440–560 keV energy window and a radial resolution of 0.67±0.06 mm from the centre to 10 mm radial offset (using 2D filtered-back-projection reconstruction) – a 33% improvement over that achieved by the SR-PET.
To further evaluate the performance of the HR-PET, the researchers imaged a rod-based resolution phantom. Images reconstructed using a 3D ordered-subset-expectation-maximization (OSEM) algorithm clearly resolved all of the rods. This included the smallest rods with diameters of 0.5 and 0.45 mm, with average valley-to-peak ratios of 0.533 and 0.655, respectively – a 40% improvement over the SR-PET.
In vivo brain PET
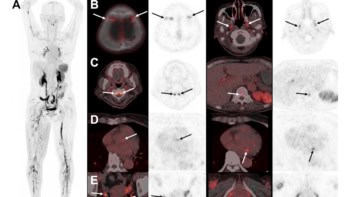
The researchers then used the HR-PET for in vivo mouse brain imaging. They injected 18F-FITM, a tracer used to image the central nervous system, into an awake mouse and performed a 30 min PET scan (with the animal anesthetized) 42 min after injection. For comparison, they scanned the same mouse for 30 min with a preclinical Inveon PET scanner.
After OSEM reconstruction, strong tracer uptake in the thalamus, hypothalamus, cerebellar cortex and cerebellar nuclei was clearly visible in the coronal HR-PET images. A zoomed image distinguished the cerebellar nuclei and flocculus, while sagittal and axial images visualized the cortex and striatum. Images from the Inveon, however, could barely resolve these brain structures.
The team also imaged the animal’s glucose metabolism using the tracer 18F-FDG. A 30 min HR-PET scan clearly delineated glucose transporter expression in the cortex, thalamus, hypothalamus and cerebellar nuclei. Here again, the Inveon could hardly identify these small structures.
Ultrafast PET imaging could shed light on cardiac and neurological disease

The researchers note that the 18F-FITM and 18F-FDG PET images matched well with the anatomy seen in a preclinical CT scan. “To the best of our knowledge, this is the first separate identification of the hypothalamus, amygdala and cerebellar nuclei of mouse brain,” they write.
Future plans for the HR-PET scanner, says Kang, include using it for research on neurodegenerative disorders, with tracers that bind to amyloid beta or tau protein. “In addition, we plan to extend the axial coverage over 50 mm to explore the whole body of mice with sub-0.5 mm resolution, especially for oncological research,” he says. “Finally, we would like to achieve sub-0.3 mm PET resolution with more optimized PET detector and system designs.”